August 4, 2026
The Hidden Architecture of America's Nuclear Fuel Supply Chain
Uranium markets have a structural characteristic that most energy investors overlook: the price signals visible at any given moment tell only a partial story. The uranium spot price is widely reported, futures curves are tracked, and producer revenues are modelled. Yet the deeper mechanics of how American reactors actually source their fuel, at what prices, from which countries, and through which contractual frameworks, remain largely invisible to all but the most specialised market participants.
The U.S. Energy Information Administration's 2025 Uranium Marketing Annual Report changes that. Released in August 2026 against a backdrop of uranium prices steady as EIA releases annual market report headlines, the publication provides a rare, granular window into the real economics of American nuclear fuel procurement. What it reveals is a market simultaneously more resilient and more exposed than surface-level price data would suggest.
When big ASX news breaks, our subscribers know first
Decoding the EIA's Uranium Marketing Survey: What the Data Actually Covers
The EIA compiles its annual uranium marketing dataset through form EIA-858, drawing responses from across the entire U.S. nuclear fuel value chain. Participants include reactor owners and operators, uranium converters, enrichment service providers, fuel fabricators, producers, brokers, and traders. The breadth of this survey is what gives the resulting report its analytical authority.
Key data categories collected include:
- Uranium purchase contracts and physical delivery volumes
- Forward delivery projections spanning a 10-year horizon
- Enrichment service purchases expressed in separative work units (SWUs)
- Reactor inventory holdings and fuel assembly consumption rates
- Market requirements and procurement strategies across near and long-term timeframes
"The EIA-858 survey is one of the few data sources in the nuclear fuel sector that captures the entire procurement chain simultaneously, from raw concentrate through to enriched product delivery, making it an indispensable reference for energy economists, investors, and policymakers alike."
Total U.S. Uranium Procurement in 2025: Volume, Price, and Contract Structure
Purchase Volumes and the Spot-vs-Contract Divide
American civilian reactor operators acquired a combined 46.9 million pounds of U3O8 equivalent across 2025. This figure encompasses uranium concentrate, uranium hexafluoride, and enriched uranium quantities all standardised into a common measurement denominator based on uranium content.
The pricing architecture behind these purchases reveals an important structural reality. Furthermore, understanding uranium supply-demand volatility is essential context for interpreting these figures:
| Contract Type | Share of 2025 Deliveries | Weighted-Average Price (per lb U3O8e) |
|---|---|---|
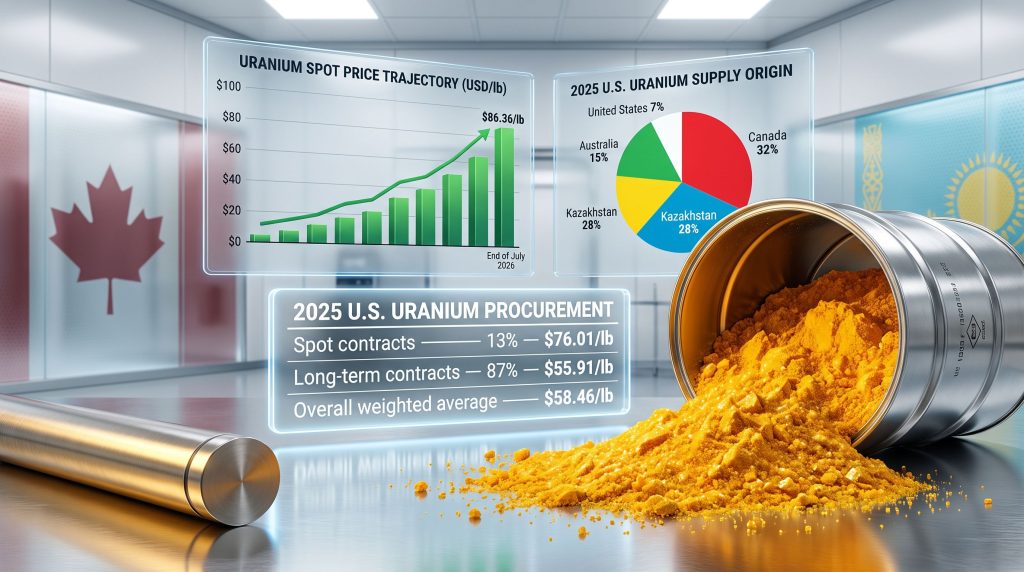
| Spot contracts | 13% | $76.01 |
| Long-term contracts | 87% | $55.91 |
| Overall weighted average | 100% | $58.46 |
The overwhelming dominance of long-term contracting, 87% of all deliveries, reflects a procurement culture within the utility sector that prioritises supply security over price optimisation. Nuclear fuel procurement officers operate on planning horizons measured in years, not quarters. Reactors require continuous fuel supply with virtually zero tolerance for disruption, which creates a structural bias toward long-dated agreements regardless of prevailing spot market conditions.
The $30 Per Pound Question: Why the Contract-Spot Gap Matters
The gap between the long-term contract average of $55.91 per pound and the mid-2026 spot price of approximately $86 per pound is not merely an academic observation. It carries direct financial implications for uranium producers and significant forward pricing risk for utilities.
Consider what this gap implies:
- Utilities currently covered by pre-existing long-term contracts are effectively insulated from the current elevated price environment
- As those contracts expire and utilities return to market to negotiate replacements, new agreements will almost certainly be struck at materially higher base prices
- The 13% of deliveries transacted at spot in 2025 averaged $76.01 per pound, already a significant premium to long-term contract prices but still below mid-2026 spot levels
- This rolling repricing dynamic represents one of the most predictable structural tailwinds for uranium producers over the medium term
"For uranium producers with production costs below $40 per pound, the prospect of locking new long-term contracts at prices between $70 and $90 per pound as legacy utility agreements expire represents a generational revenue opportunity."
Geographic Origins of U.S. Uranium Supply: Mapping the Dependency
Country-by-Country Delivery Breakdown
Perhaps the most strategically significant finding in the 2025 EIA report is the near-total dependence of American reactors on foreign uranium sources. Domestic production contributed just 7% of total reactor deliveries in 2025, a figure that sits in stark contrast to the scale of the nation's nuclear generation fleet. In addition, the broader uranium market dynamics at play make this dependency even more consequential for long-term energy policy.
| Country of Origin | Share of U.S. Deliveries |
|---|---|
| Canada | 32% |
| Kazakhstan | 28% |
| Australia | 15% |
| Uzbekistan | 7% |
| United States | 7% |
| Namibia | 4% |
| Other | 7% |
Canada and Kazakhstan together account for 60% of all uranium delivered to U.S. reactors. This concentration creates a supply chain with identifiable single points of failure. Kazakhstan uranium dominance in the global market means its product transits Russian territory, adding a geopolitical layer of complexity that is rarely factored into standard supply chain risk assessments.
The Domestic Production Gap: By the Numbers
U.S. uranium concentrate production for the first quarter of 2026 reached approximately 1.04 million pounds, according to the EIA's Domestic Uranium Production Report released in July 2026. Annualised, that figure implies domestic output of roughly 4 million pounds per year, against a consumption requirement of 46.9 million pounds in 2025 alone.
The arithmetic is unambiguous: domestic production covers approximately 8-9% of annual reactor demand at current output rates. The U.S. uranium production rebound remains insufficient to close this gap meaningfully, as doing so would require a multi-year effort involving new mine development, permitting processes, and infrastructure investment. Neither the geological endowment nor the production technology is a barrier — the United States holds substantial uranium resources, particularly in Wyoming's Powder River Basin and the Colorado Plateau. The constraint is economic, temporal, and regulatory.
Enrichment Services: The Invisible Vulnerability in the U.S. Fuel Cycle
How SWU Markets Work and Why They Matter
Raw uranium concentrate is not reactor-ready. Before fuel assemblies can be manufactured, uranium must be enriched — a process that increases the concentration of the fissile isotope U-235 from its natural abundance of approximately 0.7% to the 3-5% level required by most commercial light water reactors. This enrichment process is measured in separative work units, with each SWU representing a defined quantity of separation effort performed by centrifuge cascades.
In 2025, U.S. reactor operators purchased a total of 13 million SWUs of enrichment capacity. The average price paid was $108.70 per SWU, representing an 11% increase from 2024. That year-on-year price movement in enrichment services deserves more attention than it typically receives in uranium market coverage.
Enrichment Origin Breakdown: Russia at the Centre of the Problem
| Enrichment Source | Share of SWU Purchases |
|---|---|
| Russia | 26% |
| United States | 23% |
| France | 18% |
| United Kingdom | 14% |
| Netherlands | 8% |
| Other foreign | 11% |
Russia remains the single largest foreign supplier of enrichment services to American reactors, providing 26% of total SWU purchases in 2025. This figure represents one of the most analytically uncomfortable findings in the entire report.
The Russian uranium import ban established a framework to phase out Russian uranium imports, though waiver provisions allowed continued purchases in certain circumstances during a transitional period. The persistence of Russia's 26% enrichment share in 2025 data reflects both the contractual inertia of the nuclear fuel cycle and the limited availability of substitute enrichment capacity at short notice.
The combined European enrichment capacity from France, the United Kingdom, and the Netherlands reaches approximately 40% of U.S. SWU purchases, representing the most credible near-term substitute for Russian supply. However, expanding centrifuge capacity at facilities operated by Urenco and Orano takes years, not months, and typically requires long-lead capital investment commitments.
"The 11% year-on-year increase in SWU prices to $108.70 per unit in 2025 may partially reflect early-stage market pricing of Russian supply risk, as utilities and intermediaries began diversifying enrichment procurement ahead of potential restrictions becoming more binding."
Uranium Spot Price Trajectory: What Stability at $86 Per Pound Signals
Reading the 2026 Price Curve
The uranium price narrative through 2026 has been characterised by a brief spike and a sustained plateau rather than the continued ascent that some market participants anticipated entering the year.
| Period | Approximate Spot Price |
|---|---|
| Late October 2025 | ~$75-$78/lb |
| January 2026 | ~$82/lb |
| Late January 2026 | $94.28/lb (two-year high) |
| End of February 2026 | $86.95/lb |
| End of March 2026 | $84.25/lb |
| End of April 2026 | $86.35/lb |
| End of July 2026 | $86.36/lb |
Cameco reported the end-of-July 2026 spot price at $86.36 per pound, while Trading Economics tracked uranium futures at $86.60 per pound for the same period. Both figures had remained broadly unchanged since approximately February 2026, following the retreat from the January peak of $94.28 per pound, which represented a two-year high.
Interpreting Price Consolidation at Elevated Levels
In commodity markets, price consolidation at elevated levels carries different informational content than a price correction. A correction back toward marginal cost of production typically signals oversupply or demand disappointment. A sideways plateau above historical norms, by contrast, often reflects a market in demand-supported equilibrium where near-term supply additions are insufficient to push prices materially lower.
Several structural factors support the current price floor:
- Global nuclear capacity continues to expand, with China's installed base growing from 31.4 gigawatts in 2016 to 58.7 GW by mid-2026, an 87% increase over ten years, according to EIA analysis published in June 2026
- Utility re-contracting cycles are progressively resetting at higher price points as legacy agreements expire
- New mine supply from primary producers requires multi-year development lead times, limiting short-term volume responsiveness to price signals
- The small modular reactor pipeline, while longer-dated in its fuel demand implications, is creating forward demand expectations that support producer investment cases
The next major ASX story will hit our subscribers first
Cross-Border Uranium Trading: The Net Import Picture
Beyond direct reactor procurement, the EIA report captures transaction data from U.S.-based uranium market intermediaries operating in international markets. The 2025 cross-border figures illustrate the net import orientation of the American uranium sector with clarity:
| Transaction Direction | Volume (lbs U3O8e) | Weighted-Average Price |
|---|---|---|
| Foreign purchases by U.S. participants | 30 million lbs | $56.80/lb |
| Sales to foreign buyers by U.S. participants | 4 million lbs | $75.05/lb |
U.S. market participants purchased 30 million pounds from foreign counterparts at an average of $56.80 per pound, while selling just 4 million pounds abroad at $75.05 per pound. The directional asymmetry — 30 million lbs in versus 4 million lbs out — confirms that the United States functions as a structural net importer in global uranium markets, not a trading hub.
Notably, U.S. participants achieved a meaningful premium on their outward sales ($75.05/lb) versus inbound purchases ($56.80/lb), a spread of approximately $18 per pound. This differential likely reflects the timing of contract negotiations and the varying price environments in which inbound long-term contracts were originally struck versus the more recent market pricing applied to outward transactions.
Frequently Asked Questions
What does U3O8e mean in uranium market reporting?
U3O8e stands for triuranium octoxide equivalent. It is the standard unit used to express uranium quantities across different chemical forms, including uranium concentrate, uranium hexafluoride, and enriched uranium, by converting all forms to their uranium content equivalent measured as U3O8.
Why do long-term uranium contracts price so far below spot?
Long-term contracts are negotiated years in advance, locking in prices that reflect market conditions at the time of signing. In 2025, the weighted-average long-term contract price of $55.91 per pound was approximately 35% below the prevailing mid-2026 spot price because many of these agreements were established during an earlier, lower-price market cycle.
What is a separative work unit and why does its price matter?
A separative work unit measures the effort required to enrich uranium by concentrating fissile U-235. Rising SWU prices directly increase the operating costs of nuclear power generation, making enrichment market dynamics an important but underreported variable in reactor economics.
Which country supplies the most uranium to U.S. reactors?
Canada was the largest single source of uranium delivered to U.S. reactors in 2025, accounting for 32% of total deliveries, followed by Kazakhstan at 28% and Australia at 15%.
How significant is Russia's role in U.S. nuclear fuel supply?
In 2025, Russia supplied 26% of enrichment services purchased by U.S. reactor operators, making it the single largest foreign enrichment provider. This dependency remains a focal point of energy security debate given the broader geopolitical context.
Key Takeaways for Investors and Energy Analysts
The 2025 EIA Uranium Marketing Annual Report, released as uranium prices steady as EIA releases annual market report coverage circulates, offers more than a snapshot of last year's transactions. It maps the structural conditions that will shape uranium market economics for the next several years.
The most material conclusions for investors and analysts to carry forward:
- Long-term contract repricing is the dominant medium-term revenue driver for uranium producers, as utilities renegotiate agreements at price points 35-50% above those embedded in expiring contracts
- Enrichment cost inflation at 11% year-on-year is an emerging pressure on reactor operating economics that is not yet widely reflected in utility cost forecasting
- Russia's 26% enrichment market share remains the most acute supply chain vulnerability in the U.S. nuclear fuel cycle, with substitution capacity constrained by centrifuge expansion timelines
- Domestic uranium production at approximately 4 million pounds annualised covers less than 9% of reactor demand, underscoring the strategic importance of allied-nation supply relationships
- Price stability at $86 per pound reflects genuine demand-side support rather than speculative excess, suggesting the floor for uranium has shifted structurally higher relative to pre-2023 market conditions
Disclaimer: This article contains forward-looking analysis and market projections for informational purposes only. It does not constitute financial or investment advice. Uranium market conditions are subject to rapid change based on geopolitical events, regulatory developments, and supply-demand dynamics. Readers should conduct independent research and consult qualified financial advisers before making investment decisions.
Want to Track the Next Major Uranium or Critical Mineral Discovery Before the Market Does?
Discovery Alert's proprietary Discovery IQ model delivers real-time alerts on significant ASX mineral discoveries, transforming complex resource data into actionable investment insights for both short-term traders and long-term investors — explore historic examples of exceptional discovery returns and begin your 14-day free trial at Discovery Alert to position yourself ahead of the market.