
July 27, 2026
Why the Global Urea Market Is Structurally Vulnerable to Geopolitical Shocks
When commodity analysts describe a market as "structurally fragile," they are rarely referring to the size of the market itself. They are describing the geometry of its supply chain — the degree to which production capacity, processing infrastructure, and export logistics are concentrated within a single geography. Few commodities illustrate this fragility more starkly than urea, the world's most widely traded nitrogen fertiliser, and few geographies demonstrate the risk more clearly than the Middle East.
The region collectively exports approximately 20 million tonnes of urea per year, a figure that represents close to one-third of total global urea export volume, according to market analysis published by Argus Media in July 2026. That single statistic reframes how the Middle East conflict urea trade disruption should be understood — not as a regional event with isolated implications, but as a systemic shock with reverberations across every major agricultural importing economy in the world.
The Hormuz Chokepoint: Where One Passage Controls Global Food Security
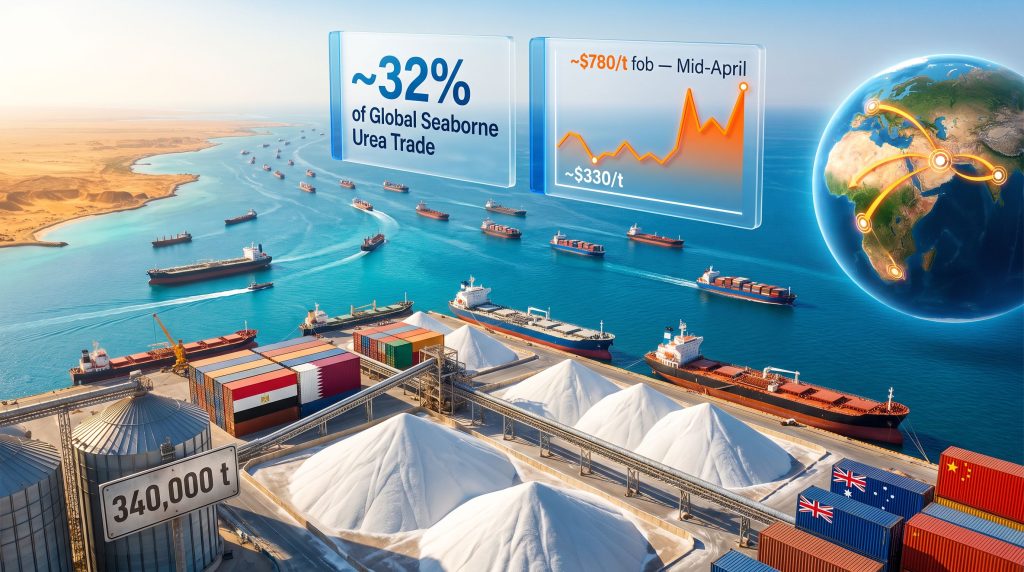
The Strait of Hormuz is most commonly discussed in the context of crude oil. Its role as a nitrogen fertiliser transit corridor receives far less attention, yet approximately 32% of global seaborne urea trade moves through this single maritime passage. When that passage is effectively closed, the consequences are immediate and quantifiable.
According to Argus Media's Urea Market Outlook: Middle East Supply Disruptions (27 July 2026), the effective closure of the Strait left more than 800,000 tonnes of urea stranded in the Middle East Gulf within a matter of weeks. That stranded volume is not an abstraction — it represents nitrogen fertiliser that was contracted, financed, and scheduled for delivery to farms across multiple continents, now immobilised by a geopolitical event happening thousands of kilometres away from the fields it was meant to serve.
How Concentrated Is Middle Eastern Urea Production?
| Region / Country | Estimated Annual Urea Export Contribution | Key Vulnerability |
|---|---|---|
| Middle East (combined) | Hormuz transit dependency | |
| Iran | Significant ammonia/urea producer | Production outages under conflict conditions |
| Qatar (QAFCO) | Major nitrogen exporter | LNG-linked plant sensitivity |
| Egypt | Alternative export corridor | Rising buyer demand post-disruption |
| Russia / Black Sea | Secondary corridor | Port incidents, freight risk escalation |
Key Insight: The concentration of urea production within a single geopolitical risk zone creates a structural fragility that market participants have historically underpriced. A shock event forces rapid repricing not just of the commodity itself, but of the entire logistics architecture that connects producers to buyers.
What makes the current disruption particularly instructive is the simultaneity of production outages and transit restrictions. Iranian plant outages, which materialised primarily during March 2026, reduced available supply just as Hormuz transit was being constrained. These two events compounded each other in a way that neither would have produced independently, illustrating a critical but underappreciated risk dynamic in fertiliser markets: correlated shock events within a single geopolitical zone amplify disruption far beyond what supply-demand models based on historical averages would predict. The broader geopolitical risk landscape across the region has further reinforced how interconnected commodity vulnerabilities have become.
When big ASX news breaks, our subscribers know first
What Happens to Urea Prices When Hormuz Is Effectively Closed?
Price behaviour during the Middle East conflict followed a trajectory that, in retrospect, has a clear internal logic — but which was almost impossible to navigate in real time for procurement teams managing multi-month supply requirements.
The Four-Phase Price Cycle
Phase 1 — Shock Onset (March to mid-April 2026): Iranian production outages combined with vessel traffic restrictions through Hormuz drove benchmark urea prices to approximately $780 per tonne fob by mid-April 2026, according to Argus Media. Depending on the reference benchmark and origin, this represented a price surge of between 40% and 80% from pre-conflict levels.
Phase 2 — Demand Collapse (May to June 2026): At those price levels, the market encountered a structural ceiling. Major buyers across Brazil, India, Europe, and the United States halted procurement activity. The affordability threshold had been breached, causing a sharp demand-side correction that pulled prices back sharply.
Phase 3 — China Re-entry Expectation: As expectations built around Chinese export volumes re-entering the market, benchmark prices declined to approximately $330 per tonne fob — effectively below pre-conflict levels. This reflected buyers pricing in the supply relief that Chinese exports could theoretically provide.
Phase 4 — Renewed Tension Premium: A resurgence of US-Iran hostilities reintroduced a geopolitical risk premium into the market. Buyers resumed inquiries, with particular interest in alternative-origin cargoes from Egypt and Sub-Saharan Africa, where spot market prices at the peak exceeded $850 per tonne, reflecting the scarcity premium attached to non-Middle East supply.
Price Volatility Summary
| Market Phase | Approximate Price Level (fob) | Primary Driver |
|---|---|---|
| Pre-conflict baseline | ~$330–$380/t | Normal supply-demand balance |
| Peak disruption (mid-April 2026) | ~$780/t | Hormuz restriction + Iran outages |
| Demand collapse trough | ~$330/t | Buyer withdrawal + China expectations |
| Egyptian spot market peak | >$850/t | Alternative origin scarcity premium |
| Post-renewal tension range | Elevated vs. baseline | Ongoing Middle East export restrictions |
One of the less-discussed dynamics within this price cycle is what traders refer to as the demand destruction ceiling — the price level at which buyers collectively exit the market rather than absorb further cost. This ceiling functions differently across importing regions depending on subsidy structures, credit availability, and seasonal urgency. In India, where a government subsidy framework buffers the end-user cost, procurement sensitivity operates at the institutional level rather than the farm level. In Brazil, where procurement is commercially driven and season-dependent, the ceiling is effectively enforced by crop-to-fertiliser price ratios.
Which Importing Regions Face the Greatest Procurement Risk?
Brazil: Seasonal Demand and the Q3 Procurement Imperative
Brazil's agricultural calendar creates a procurement window that cannot be deferred without consequence. The country's soy and maize planting cycles generate structurally non-negotiable nitrogen demand in the third quarter, and with Middle East cargoes constrained, Brazilian buyers face both price volatility and logistical delays simultaneously.
The primary supply buffer available to Brazil is China's June 2026 export window, which opened with potential shipment volumes of up to 2.6 million tonnes, according to Argus Media. If that window remains open and those volumes flow, Brazil's seasonal Q3 nitrogen requirements should be adequately covered. If it does not, the country faces a supply shortfall during peak application season with few readily available alternatives at competitive delivered cost.
India: The World's Largest Urea Importer Under Pressure
India's position as the world's largest urea importer gives it an outsized stake in the outcome of Middle East supply disruptions. The country's fertiliser subsidy framework creates government-level procurement sensitivity to global price spikes — when international prices surge, subsidy expenditure increases, creating fiscal pressure that can influence tender timing and volume decisions. Alternative sourcing from Egypt, Russia, and Southeast Asia is available but adds freight cost premiums that reduce affordability margins even before the commodity price premium is considered.
Europe and the United States: West-of-Suez Procurement Dynamics
European buyers face a compounded challenge. Middle East supply disruption coincides with elevated freight costs through alternative routing, and the Black Sea corridor — a secondary supply route — carries its own escalating logistical risk. Fourth-quarter procurement requirements for both Europe and the United States remain substantial, providing a demand floor that analysts expect to sustain price support through the second half of 2026.
Strategic Implication: The convergence of Q3 and Q4 procurement needs from Brazil, India, Europe, and the United States against a backdrop of constrained Middle East supply creates a structural demand overhang that limits the downside for urea prices even if Chinese exports partially fill the gap.
How Is the Black Sea Urea Market Responding to Dual-Risk Exposure?
Active Trade Against an Uncertain Backdrop
Despite elevated uncertainty, the Black Sea urea market has remained transactionally active. According to Argus Media's July 2026 analysis, recent deals have been executed at a range of price levels across different destinations:
- Turkey: approximately $405 per tonne fob
- Romania: approximately $440 to $445 per tonne
- Georgia (Batumi): offers near $475 per tonne attracted no buyer interest
- Azerbaijan (Socar tender): bids settled at approximately $500 per tonne, below seller expectations
The spread across these destinations reflects not only origin-specific cost structures but also the varying freight risk tolerance of buyers operating in different parts of the Black Sea basin. The fact that Georgian offers at $475 per tonne found no takers while Romanian cargoes cleared at $440 to $445 per tonne suggests buyers are applying precise freight-adjusted value calculations rather than making panic-driven purchasing decisions.
Port Incident Risk and the Hidden Cost Layer
Ukrainian port facilities including Pivdenny, Odesa, and Chornomorsk have sustained vessel damage from conflict-related incidents. While these ports officially remain operational, the practical reality for buyers involves a set of additional cost and risk factors that do not appear in headline commodity prices:
- Elevated marine insurance premiums for vessels operating in affected zones
- Contract renegotiations incorporating force majeure provisions
- Reduced vessel availability as operators recalibrate risk exposure
- Potential delays from port authority capacity constraints under conflict conditions
These factors collectively add an unquantified but material cost layer that compresses the apparent price advantage of Black Sea sourcing relative to alternative origins. Furthermore, commodity price volatility of this magnitude has broad implications well beyond the fertiliser sector itself.
Comparing Supply Corridor Risk Profiles
| Supply Corridor | Current Risk Level | Price Premium vs. Baseline | Buyer Activity |
|---|---|---|---|
| Strait of Hormuz (Middle East) | Very High | +40–80% at peak | Severely constrained |
| Black Sea (Ukraine/Russia) | High | Moderate freight premium | Active but cautious |
| Egypt / North Africa | Moderate | Alternative origin premium | Rising buyer interest |
| Southeast Asia | Low to Moderate | Freight-adjusted | Increasing volumes |
| China (export window) | Policy-dependent | Variable | Critical swing factor |
What Role Does China Play as the Global Urea Swing Supplier?
China's Export Policy: The Binary Risk at the Centre of the Market
No single variable carries more weight in current urea pricing dynamics than China's export policy. The country's domestic fertiliser framework balances agricultural self-sufficiency against export revenue, and the government has demonstrated a willingness to open and close export windows with limited advance notice. This creates binary risk scenarios for buyers who attempt to price in Chinese supply when building procurement strategies.
The June 2026 export window opened with potential shipment volumes of up to 2.6 million tonnes, a figure that Argus Media characterises as sufficient to meet Brazil's seasonal Q3 demand if fully realised. However, the key word is if. Chinese export availability is subject to rapid policy reversal driven by domestic price management considerations, agricultural input security priorities, and bilateral trade considerations that may have no direct connection to global fertiliser market conditions.
Three Scenarios for Chinese Export Outcomes
Scenario A — Full Export Window Maintained:
Brazil's Q3 demand is substantially covered, global prices stabilise in a $350 to $450 per tonne range, and west-of-Suez buyers gain meaningful procurement flexibility heading into Q4.
Scenario B — Partial or Curtailed Chinese Exports:
Brazil faces a supply shortfall during peak application season. Global prices re-test the $600 to $700 per tonne range, and India and Europe compete directly for Egyptian and African cargoes, pushing alternative-origin premiums higher.
Scenario C — China Export Window Closes Abruptly:
A full supply shock resumes. Prices potentially approach or exceed the April 2026 peak levels. Force majeure declarations increase across the supply chain, and agricultural input costs spike with downstream implications for food price inflation in import-dependent economies. The World Economic Forum has highlighted how fertiliser supply shocks of this nature translate directly into food security risks for the world's most vulnerable populations.
Market Psychology Note: Buyers who priced in Scenario A during the May-June demand trough and deferred procurement captured a temporary price advantage. Those same buyers now face binary execution risk if the window closes before cargoes can be confirmed and shipped.
How Australia Secured Urea Supply Through Diversification
From Shortage to Stabilisation: A Practical Model for Import-Dependent Nations
Australia's experience during the second quarter of 2026 offers one of the more instructive case studies in how an import-dependent agricultural economy can respond to supply chain disruption in real time. Following meaningful urea supply shortfalls caused by the US-Iran conflict, Australian buyers and government institutions implemented a multi-component response:
- Geographic diversification: Increased procurement volumes from Southeast Asian producers, reducing dependence on Gulf supply routes
- New origin development: The first Nigerian urea cargoes were secured, materially expanding the country's supplier base beyond traditional Middle East sources
- Government-backed credit facility: Export Finance Australia was authorised to underwrite imports of critical agricultural commodities, providing financial backing that enabled procurement under conditions of elevated market uncertainty
- Volume secured: Approximately 340,000 tonnes of additional urea was committed for leading domestic distributors including CSBP, Incitec Pivot, and Summit
- In-transit inventory: More than 380,000 tonnes is currently in transit, including shipments successfully navigated through Hormuz in late June 2026
Policy Insight: Australia's use of a government export credit agency to underwrite fertiliser imports represents a model for national food security risk management that other agricultural import-dependent economies may consider as geopolitical supply disruptions become more structurally frequent rather than episodic.
The Nigerian cargo development is particularly noteworthy from a supply chain diversification perspective. West African urea production has historically been constrained by gas feedstock availability and plant reliability issues, but the materialisation of exportable volumes into the Australian market signals a broadening of the Atlantic basin supply base. This evolution has longer-term implications for global trade flow geography and for how nations manage global supply chain disruptions of this complexity.
The next major ASX story will hit our subscribers first
What Fertiliser Affordability Means for Agricultural Producers
The Affordability Index: Connecting Nitrogen Costs to Crop Economics
Fertiliser affordability cannot be assessed in isolation from the revenue-generating capacity of the crops it supports. A urea price of $500 per tonne means something very different to a wheat farmer when wheat is trading at $350 per tonne versus when it is trading at $250 per tonne. This relationship is formalised in the Global Fertiliser Affordability Index published by Argus Media, which benchmarks urea and nitrogen costs against major grain price indicators including wheat, maize, soybean, and rice.
An index reading below 1.0 signals affordability stress — the threshold at which fertiliser costs begin to compress farm margins to levels that may trigger application rate reductions. When growers reduce nitrogen application, yield potential in the subsequent harvest cycle is compromised, initiating a supply-side response that can take one to two growing seasons to fully manifest in grain market statistics.
How Crop Price Movements Partially Offset Urea Cost Increases
Recent wheat price appreciation has improved the crop-to-fertiliser price ratio for grain producers in several key markets. According to Argus Media's July 2026 analysis, gains in wheat prices could offset some of the impact of elevated urea costs, supporting investment in fertiliser inputs ahead of the next planting cycle. However, this offset mechanism is not uniform across crops or geographies.
| Crop | Nitrogen Dependency | Recent Price Trend | Net Affordability Outlook |
|---|---|---|---|
| Wheat | High | Rising | Moderate — partial cost offset available |
| Maize | Very high | Stable to firm | Stressed in high-urea-cost markets |
| Soybeans | Lower (fixes own N) | Variable | Relatively insulated |
| Rice | High | Regional variation | Exposed in Asian import markets |
The maize exposure is particularly worth monitoring. Maize is the most nitrogen-intensive of the major grain crops, and its production is heavily concentrated in regions — the United States, Brazil, Ukraine — that are themselves affected by either direct supply disruption or elevated alternative-origin procurement costs.
The Broader Agricultural Supply Chain Risk: From Fertiliser Shock to Food System Pressure
The Transmission Pathway from Input Cost to Consumer Price
Sustained urea price elevation creates a multi-stage risk transmission that moves through the agricultural supply chain over time:
- Farm-level: Higher input costs compress grower margins, potentially triggering nitrogen application rate reductions
- Yield-level: Sub-optimal nitrogen application reduces crop yields in the following harvest season
- Food price-level: Lower yields in major producing regions contribute to global grain supply tightness
- Consumer-level: Grain price increases translate into food inflation, with disproportionate impact on lower-income populations in import-dependent economies
This transmission pathway operates with a significant lag. A fertiliser shock in mid-2026 may not fully manifest in food price statistics until the 2027 harvest results are reflected in global grain balances. This lag creates a dangerous illusion of stability in food price indices during the fertiliser shock itself, obscuring the forward risk that is being built into the system. UNCTAD's analysis of Strait of Hormuz disruptions underscores just how profoundly choke point closures can reverberate through global trade and development outcomes.
Procurement Timing as a Strategic Risk Management Variable
In a market characterised by the price volatility described above, the timing of fertiliser procurement has become as consequential as the price negotiated. Buyers who secured supply before the April 2026 price peak avoided the worst of the shock. Those who deferred procurement in anticipation of further declines faced a binary outcome — either catching the China-driven trough near $330 per tonne or being caught by the renewed price support that followed the resumption of US-Iran hostilities. In addition, natural gas price trends remain a critical upstream variable, given that gas feedstock costs directly influence the economics of urea production across all major exporting regions.
FAQ: Middle East Conflict and Global Urea Trade Disruption
How much of global urea trade passes through the Strait of Hormuz?
Approximately 32% of global seaborne urea trade transits through the Strait of Hormuz, making it the single most critical chokepoint in the global nitrogen fertiliser supply chain. The broader Middle East region accounts for roughly one-third of total global urea exports by volume, or approximately 20 million tonnes per year.
How high did urea prices rise during the Middle East conflict urea trade disruption?
Benchmark urea prices reached approximately $780 per tonne fob at peak disruption in mid-April 2026, according to Argus Media. Egyptian spot market prices exceeded $850 per tonne at the height of the supply shock, reflecting the scarcity premium attached to alternative-origin cargoes.
Which countries are most exposed to Middle East urea supply disruption?
Brazil faces the most acute near-term risk due to its non-deferrable Q3 seasonal procurement window. India, as the world's largest urea importer, faces institutional and fiscal exposure. Europe and the United States have substantial Q4 procurement requirements that will need to be sourced from alternative origins at elevated cost.
What is China's role in stabilising global urea supply?
China functions as the world's primary swing supplier of urea. Its June 2026 export window opened with potential volumes of up to 2.6 million tonnes — the most significant available supply buffer for markets disrupted by Middle East conflict. However, Chinese export policy can change rapidly, making it an inherently uncertain supply source for procurement planners.
How has Australia responded to the urea supply disruption?
Australia diversified procurement to include Southeast Asian producers and pioneered the first Nigerian urea cargoes into its market. Export Finance Australia was authorised to underwrite fertiliser imports, securing approximately 340,000 tonnes of additional supply for major domestic distributors, with more than 380,000 tonnes currently in transit.
What does the Global Fertiliser Affordability Index measure?
The index, published by Argus Media, measures nitrogen fertiliser costs relative to major crop commodity prices including wheat, maize, soybean, and rice. A reading below 1.0 signals affordability stress — the level at which fertiliser costs may cause growers to reduce application rates, creating a leading indicator of potential yield reductions and downstream food price pressure.
What Is the Outlook for Global Urea Markets Through the Second Half of 2026?
The Key Variables That Will Determine Price Direction
The second half of 2026 will be shaped by the interaction of several independently uncertain variables, each capable of shifting price trajectories significantly:
- Middle East conflict resolution or escalation: Any ceasefire or Hormuz reopening would release stranded supply and compress prices; further escalation would sustain or amplify the current premium
- China's export policy continuity: Whether the June export window remains open through Q3 is the most operationally significant near-term variable for Brazilian and global seasonal demand coverage
- Black Sea logistical risk evolution: Continued port incidents could further constrain an already stressed secondary supply corridor
- Seasonal demand convergence: The overlap of Q3 Brazilian, Q4 European, and ongoing Indian procurement needs creates sustained demand pressure regardless of supply-side outcomes
Strategic Recommendations for Fertiliser Buyers and Agricultural Producers
- Diversify supply origins beyond traditional Middle East sources to reduce single-corridor dependency risk
- Engage government-backed procurement mechanisms where available, using the Australian Export Finance model as a reference framework
- Monitor China export policy signals as the primary leading indicator for near-term price direction
- Use the Global Fertiliser Affordability Index as a decision-support framework for application timing and rate optimisation relative to current crop prices
- Build strategic inventory buffers during price troughs rather than relying on just-in-time procurement in a structurally volatile market
- Assess freight risk comprehensively, including marine insurance premiums, force majeure provisions, and vessel availability constraints — not just the commodity price itself
Forward Risk Note: The scenarios outlined above involve inherent uncertainty. Market conditions, geopolitical developments, and policy decisions can shift rapidly. This analysis is intended as an informational framework and does not constitute financial or procurement advice. Readers should consult independent market specialists before making procurement or investment decisions.
For ongoing market intelligence on global urea pricing, nitrogen trade flows, and fertiliser affordability metrics, Argus Media publishes dedicated analysis through its Urea Market Outlook and Nitrogen market coverage at argusmedia.com.
Want to Stay Ahead of the Next Major Commodity Shock?
The geopolitical disruptions reshaping global urea and fertiliser markets are just one signal of how quickly commodity supply chains — and the ASX-listed companies exposed to them — can reprice. Discovery Alert's proprietary Discovery IQ model scans ASX announcements in real time, delivering instant alerts on significant mineral discoveries so investors can act before the broader market catches on. Begin your 14-day free trial at Discovery Alert today, or explore how historic discoveries have generated extraordinary returns for investors who positioned early.