
June 13, 2026
The Hidden Architecture of US Copper Trade: Why the Rules of the Game Changed in 2025
Commodity markets rarely transform overnight, yet the architecture governing US copper imports and tariffs underwent a fundamental restructuring in 2025 that continues to reshape global supply chains heading into 2026 and beyond. Understanding what actually changed, and why the consequences extend far beyond American warehouse stockpiles, requires stepping back from the headline numbers and examining the structural forces at work beneath the surface.
Copper is not an ordinary industrial metal. It sits at the intersection of military hardware, power grid infrastructure, electric vehicles, and digital communications in a way that few other materials can claim. A single modern electric vehicle contains roughly 83 kilograms of copper, compared to approximately 23 kilograms in a conventional combustion-engine car. A utility-scale wind turbine requires between 2.5 and 6.5 tonnes of copper per megawatt of generating capacity.
These demand realities give copper a strategic dimension that has increasingly drawn the attention of policymakers working within the framework of Section 232 of the Trade Expansion Act of 1962, the legal mechanism that grants the executive branch authority to impose trade restrictions on national security grounds.
The structural gap underpinning that security argument is significant. According to US Geological Survey estimates, approximately 45% of annual US copper consumption depends on imported supply, reflecting a domestic mining and smelting base that has not kept pace with the country's expanding appetite for the metal across electrification and infrastructure end uses.
When big ASX news breaks, our subscribers know first
What the 2025 Tariff Framework Actually Did
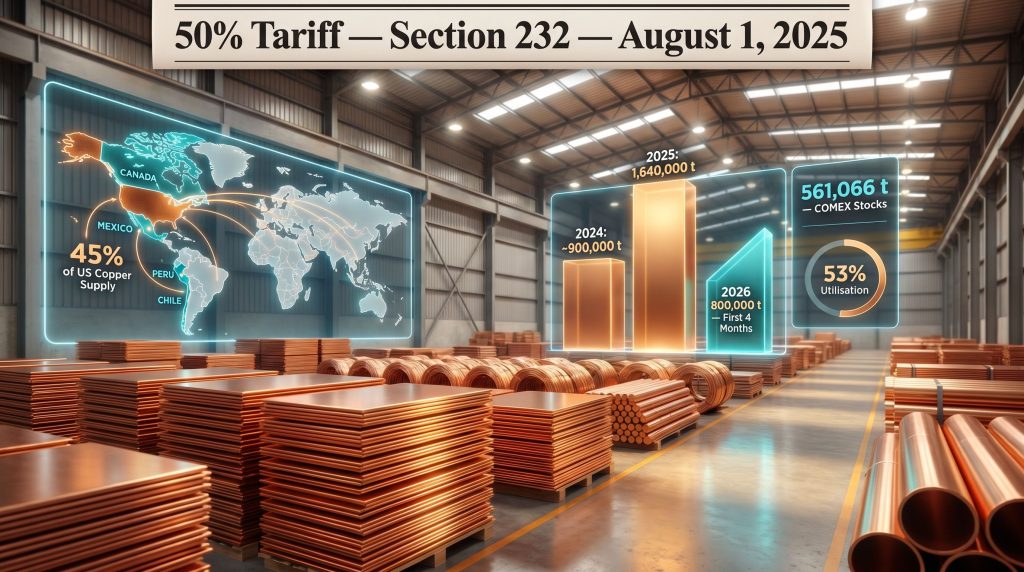
The tariff architecture that took effect on August 1, 2025 was considerably more surgical than many market participants initially anticipated. Rather than applying a blanket tax to all copper imports, policymakers targeted semi-finished copper products and copper-intensive derivatives at a 50% tariff rate on the copper content of those goods. The affected product categories include pipes, wires, rods, sheets, tubes, pipe fittings, cables, connectors, and electrical components.
Critically, the framework deliberately preserved access to upstream raw copper inputs. The following categories were carved out from tariff exposure:
- Copper ores and concentrates
- Copper mattes
- Refined copper cathodes and anodes
- Copper scrap materials
This exemption structure was not accidental. By shielding the raw material inputs that domestic smelters depend on while taxing fabricated downstream products, the policy created a protected market advantage for US-based manufacturing operations that convert cathodes and scrap into finished goods. The design logic was to incentivise domestic value-add manufacturing investment rather than simply restrict raw material access.
Furthermore, compliance obligations under the new framework are substantive. US Customs and Border Protection implemented mandatory copper content declaration requirements for affected product categories, administered through new HTSUS codes 9903.78.01 and 9903.78.02. The prohibition on tariff drawback, which would normally allow importers to reclaim duties paid on inputs used in re-exported goods, was also enforced, closing a potential arbitrage route for processors importing tariff-subject material for transformation and re-export.
The copper tariff impacts on global trade investment have been widely documented, with analysts noting that the policy's reach extends well beyond US domestic fabricators into international supply chains. The US tariffs on copper supply have consequently reshaped sourcing decisions across multiple continents.
Policy Design Insight: The deliberate asymmetry between raw input exemptions and semi-finished product tariffs reflects a sophisticated industrial policy objective. Rather than protecting existing copper consumption patterns, the framework is designed to restructure where value-adding fabrication activity occurs within the supply chain.
The 2025 Import Surge: What the Numbers Actually Show
The market's response to the tariff architecture produced one of the most dramatic commodity inventory accumulation episodes in modern metals trading history. Between the announcement period and the implementation date, the COMEX copper exchange in the United States became the destination of choice for globally available refined copper, driven by a widening price gap between COMEX and London Metal Exchange benchmark prices.
The scale of the accumulation was extraordinary:
| Metric | Pre-Surge Level (2024) | Peak 2025 Level | May 2026 Level |
|---|---|---|---|
| COMEX Copper Stocks | Under 100,000 tonnes | 461,833 tonnes | 561,066 tonnes |
| COMEX Storage Capacity | 1,050,000 tonnes | 1,050,000 tonnes | 1,050,000 tonnes |
| Capacity Utilisation | ~10% | ~44% | ~53% |
| Total US Copper Imports | ~900,000 tonnes (2024) | 1,640,000 tonnes (2025 record) | Tracking above record pace |
This five-fold increase in COMEX inventories, from under 100,000 tonnes to a peak of 461,833 tonnes during 2025, with a further climb to 561,066 tonnes by May 2026, reflects the mechanics of tariff anticipation arbitrage operating at an industrial scale, as reported by Reuters via Mining Weekly (May 2026). Indeed, the copper rally on tariff fears that preceded the August 2025 deadline set the commercial context for this extraordinary accumulation.
How the COMEX-LME Spread Mechanics Actually Work
The price spread between COMEX copper futures and LME benchmark prices is the fundamental commercial signal driving US import decisions, and understanding its mechanics reveals why market participants behaved as they did.
When COMEX copper prices trade at a premium to LME prices, the differential creates a commercially viable case for routing globally available refined copper to US COMEX-registered warehouses. Importers can capture this spread by purchasing copper at LME-linked prices in global markets, shipping it to the United States, warehousing it at COMEX facilities, and selling it at COMEX-linked prices. The trade is profitable as long as the spread exceeds the combined costs of freight, insurance, financing, and storage.
In 2025, this spread widened significantly as tariff anticipation pulled demand forward into the US market. Refined copper was ultimately granted an exemption from the tariff structure, but the uncertainty surrounding that outcome was sufficient to sustain an exceptionally wide price differential for an extended period. As Reuters reported in May 2026, COMEX copper prices were again trading at a premium to LME benchmarks in early 2026, triggering a renewed wave of inflows even against a backdrop of already-elevated US inventory levels.
The speculative dimension of this dynamic is worth examining. A meaningful portion of the 2025 inflows reflected positioning by traders and financial intermediaries rather than genuine end-use demand from US copper fabricators. This distinction matters because speculative inventory accumulation is more reversible than structural demand growth, and the risk of a sharp inventory liquidation if arbitrage conditions deteriorate is not trivial.
2026: A Market Divided Between Bulls and Bears
The central debate among copper market analysts in 2026 concerns whether the record 1.64-million-tonne US copper import figure from 2025 can be equalled or exceeded. The market intelligence available as of May 2026 suggests a genuine division of expert opinion.
The Case for Moderation
Howard Lau, Director of Asia Materials Research at HSBC, has assessed that exceeding 2025 volumes in 2026 is unlikely, pointing to the cumulative weight of existing inventory. His estimate that total US copper stocks across exchange and non-exchange holdings already exceed one million tonnes as of mid-2026 represents a significant absorption challenge. With COMEX alone holding 561,066 tonnes, equivalent to more than half of the exchange's 1.05-million-tonne total storage capacity, the physical headroom for continued accumulation is structurally narrowing, according to Reuters reporting (Mining Weekly, May 2026).
Guy Wolf, Global Head of Market Analytics at Marex, has characterised the 2025 opportunity in terms that suggest it was a near-singular market event. Speaking at LME Asia Week in Hong Kong, Wolf indicated that the conditions that made 2025's import surge commercially straightforward — a clearly defined tariff deadline, wide price spreads, and manageable logistics costs — are substantially less favourable in 2026. His analysis suggests that replicating 2025's volumes will prove considerably more difficult as the arbitrage window becomes more complex.
The bearish case rests on three converging constraints:
- Physical storage saturation: COMEX at 53% capacity utilisation with total US stocks above one million tonnes
- Elevated logistics costs: War risk insurance premiums on shipping routes increased dramatically following geopolitical escalation
- Reduced arbitrage clarity: Uncertainty about refined copper tariff scope makes the trade risk calculus less favourable than in 2025
The Case for a New Record
Nicholas Snowdon, Head of Metals and Mining Research at Mercuria, holds a markedly different view. His analysis of first-quarter 2026 data points to an import pace that, if sustained, would establish a new annual record comfortably above two million tonnes. The US had already imported close to 800,000 tonnes in the first four months of 2026 alone, according to Snowdon's internal tracking data, as reported by Reuters via Mining Weekly (May 2026).
Annualising this four-month figure suggests a potential full-year result of approximately 2.4 million tonnes, though such extrapolation assumes conditions remain constant. Snowdon's bullish projection incorporates a global demand dimension that the bearish analysts assign less weight to. Chinese exchange copper inventories were declining sharply as of May 2026, creating a competing demand signal for globally available refined copper.
| Analyst | Institution | 2026 Import Outlook | Primary Rationale |
|---|---|---|---|
| Guy Wolf | Marex | Below 2025 record | Arbitrage less compelling; storage constraints |
| Howard Lau | HSBC | Unlikely to match 2025 | One million tonnes already in total US inventory |
| Nicholas Snowdon | Mercuria | Potentially above 2 million tonnes | Strong Q1 momentum; Chinese demand competition |
Disclaimer: Analyst projections reflect individual institutional assessments as of May 2026 and are inherently uncertain. They should not be construed as investment advice. Actual import volumes will depend on price spreads, logistics conditions, policy decisions, and demand dynamics that cannot be reliably forecast.
The Logistics Shock That Changed the Cost Calculus
One of the most consequential and least anticipated developments affecting US copper imports and tariffs in 2026 has been the rapid escalation of shipping costs linked to geopolitical conflict in the Middle East. The outbreak of hostilities involving the United States and Iran triggered an immediate and severe repricing of war risk insurance on affected shipping routes.
Sabrina Qian, Director at shipbroker IFCHOR GALBRAITHS Singapore, documented a 40 to 60-fold increase in war risk insurance premiums within a two-week window following the outbreak of conflict, as reported by Reuters via Mining Weekly (May 2026). This scale of premium escalation is extraordinary by historical standards and represents a structural cost headwind that raises the minimum COMEX-LME price spread required to make US-bound copper shipments commercially viable.
The practical consequence is a higher arbitrage threshold. Transactions that were commercially attractive in 2025, when logistics costs were relatively contained, may no longer clear the profitability hurdle when insurance premiums alone have increased by several dozen times. This cost shock effectively narrows the pool of market participants willing and able to execute profitable US-bound copper trades, reducing the volume of metal that can be economically routed to COMEX warehouses under current conditions.
This logistics dimension adds a layer of complexity that distinguishes 2026's import environment from 2025's in ways that pure inventory or price spread analysis does not fully capture. For a broader perspective on how these disruptions intersect with geopolitical rivalry, the US-China trade war copper prices dynamic adds another layer to consider.
The June 2026 Policy Review: The Pivotal Catalyst
Perhaps the most consequential near-term development for the trajectory of the market is the Commerce Department's scheduled review, with findings due by June 30, 2026. This review will assess whether US domestic copper fabrication capacity has recovered sufficiently since the August 2025 tariff implementation.
The potential outcomes and their market implications are structured as follows:
| Scenario | Trigger | Tariff Outcome | Likely Market Response |
|---|---|---|---|
| Status Quo Extension | Adequate domestic recovery assessed | No expansion to refined copper | Moderate imports; spread-driven arbitrage continues |
| Phased Tariff Escalation | Insufficient domestic fabrication growth | 15% on refined copper from January 1, 2027, rising to 30% from January 1, 2028 | Renewed front-loading cycle; potential new COMEX inventory surge |
| Tariff Rollback or Relaxation | Trade agreement or market balance restoration | Partial or full exemption restoration | Sharp import volume decline; COMEX-LME spread compression |
The asymmetry in the risk calculus facing importers is notable. Missing a tariff window by failing to accumulate sufficient inventory ahead of a potential tariff implementation carries a higher cost than over-importing into storage. This asymmetry inherently biases import decisions toward front-loading, even when fundamental demand does not justify the volumes being moved.
Extending tariffs to refined copper cathodes, the primary internationally traded form of the metal, would represent a far more disruptive policy intervention than the 2025 semi-finished product tariff. When the August 2025 announcement initially appeared to include refined copper before the exemption was clarified, copper prices on COMEX fell by an estimated 20 to 22% in the immediate aftermath, illustrating the sensitivity of market pricing to the scope of tariff coverage. According to the White House fact sheet on strengthened copper tariffs, this escalation pathway was designed explicitly to incentivise domestic industrial recovery.
The next major ASX story will hit our subscribers first
Global Supply Chain Exposure: Which Countries Face the Most Risk
The tariff architecture's impact extends well beyond US borders. The countries that supply the majority of US copper needs face direct exposure to the 50% tariff on semi-finished copper products, regardless of the trade agreements in place between those nations and the United States.
Canada, Chile, Mexico, and Peru collectively supply approximately 45% of US copper requirements based on 2024 USGS data. All four face the tariff on semi-finished copper exports to the US despite existing free trade frameworks. This creates a policy paradox in which instruments designed to strengthen bilateral economic relationships are effectively undermined by sector-specific trade restrictions.
Individual exporting nations have responded through a combination of approaches:
- Reclassifying products to qualify for exemption categories where legitimately applicable
- Exploring alternative destination markets for copper that previously flowed to the US
- Engaging in diplomatic discussions regarding potential carve-outs or bilateral exemptions
- Redirecting investment toward upstream product forms that remain tariff-exempt
The domestic US copper industry, meanwhile, is the intended beneficiary of this restructuring. The policy framework is designed to create conditions where domestic fabricators have a cost advantage over imported semi-finished products, theoretically incentivising capital investment in US copper processing and manufacturing capacity over the medium term. Broader analysis of copper market supply trends in 2025 reinforces that this structural shift is already influencing long-term investment planning. Analysts at the Center for Strategic and International Studies have similarly rethought copper tariff policy, noting the complex trade-offs between strategic self-sufficiency and market efficiency.
Frequently Asked Questions: US Copper Imports and Tariffs
What tariffs currently apply to US copper imports?
A 50% tariff on the copper content of semi-finished copper products and copper-intensive derivatives has been in effect since August 1, 2025, under Section 232 authority. Refined copper cathodes, anodes, ores, concentrates, mattes, and scrap are currently exempt, though the refined copper exemption remains under active policy review.
Why did US copper imports reach a record 1.64 million tonnes in 2025?
The combination of tariff anticipation, a wide COMEX-LME price spread, and relatively contained logistics costs created a compelling arbitrage opportunity. Traders and importers front-loaded copper into US COMEX warehouses ahead of potential tariff implementation, driving COMEX stocks from under 100,000 tonnes to above 461,000 tonnes over the course of the year.
Can 2026 US copper imports realistically exceed the 2025 record?
Analyst opinion is genuinely divided. HSBC and Marex analysts point to inventory saturation above one million tonnes in total US holdings and elevated logistics costs as structural barriers to matching 2025 levels. Mercuria's research projects that imports could exceed two million tonnes if the Q1 2026 pace of approximately 800,000 tonnes in four months is sustained, supported by competing Chinese demand for available global copper supply.
What is the significance of the June 2026 Commerce Department review?
The review will assess whether domestic copper fabrication capacity has recovered sufficiently under the tariff regime. If the conclusion is that recovery has been inadequate, the policy framework provides for a phased tariff expansion to refined copper, beginning at 15% from January 1, 2027 and rising to 30% from January 1, 2028. This represents the most material near-term policy catalyst for US copper import volumes and global price dynamics.
How have Middle East shipping disruptions affected copper import economics?
War risk insurance premiums increased by an estimated 40 to 60 times within two weeks of the outbreak of US-Iran hostilities, according to data from shipbroker IFCHOR GALBRAITHS Singapore as reported by Reuters (May 2026). This cost escalation has raised the minimum price spread required to make US-bound copper shipments economically viable, materially narrowing the arbitrage window for 2026 compared to 2025 conditions.
Which exporting nations face the greatest tariff exposure?
Canada, Chile, Mexico, and Peru collectively supply roughly 45% of US copper consumption and face the 50% semi-finished product tariff despite existing bilateral trade frameworks. Their exposure reflects the policy's application to trade partners regardless of free trade agreement status.
Key Takeaways for Investors and Market Participants
The US copper imports and tariffs landscape as it stands in mid-2026 presents a genuinely complex picture with meaningful uncertainty in multiple directions:
- The 2025 import record of 1.64 million tonnes was produced by a near-unique alignment of conditions that are materially less favourable in 2026, including lower logistics costs and a more clearly defined tariff deadline
- COMEX stocks at 561,066 tonnes and total US copper holdings exceeding one million tonnes represent a physical constraint on continued accumulation at 2025 rates
- The June 2026 Commerce Department review is the most consequential near-term policy catalyst, with the potential to trigger either a new front-loading cycle or a significant reversal in import momentum depending on its conclusions
- Middle East conflict-driven logistics cost inflation has structurally altered the arbitrage economics underpinning US copper inflows, with war risk premium increases of 40 to 60 times over a two-week period
- Competing Chinese demand for globally available copper adds a global dimension that complicates both the bearish inventory saturation thesis and the bullish sustained-inflow scenario
- The long-term trajectory toward a potential 30% tariff on refined copper by January 2028, if the phased escalation path is triggered, would represent a fundamental restructuring of global copper trade flows with consequences extending well beyond US shores
Investment Disclaimer: This article provides educational and informational analysis of publicly available market data and reported analyst commentary. It does not constitute financial or investment advice. Readers should conduct their own due diligence and consult qualified financial advisers before making investment decisions related to copper markets, mining equities, or related asset classes. Commodity market conditions are inherently uncertain and subject to rapid change.
Want To Stay Ahead of the Next Major Copper Discovery on the ASX?
Discovery Alert's proprietary Discovery IQ model delivers real-time alerts the moment significant copper and base metal discoveries are announced on the ASX, transforming complex geological data into clear, actionable investment insights for traders and investors at every experience level. Explore how historic mineral discoveries have generated extraordinary returns on Discovery Alert's dedicated discoveries page, and begin your 14-day free trial today to ensure you're positioned ahead of the broader market.