
June 25, 2026
When Inventory Buffers Disappear: Understanding the Structural Forces Behind U.S. Oil Market Tightness
Energy markets operate on a simple but powerful principle: when the cushion between supply and demand shrinks, prices respond. Inventory levels function as that cushion, absorbing temporary mismatches between what producers pump and what consumers burn. When those buffers begin eroding week after week, the market stops reacting to individual data points and starts pricing in a structural shift. US crude oil inventories in freefall EIA data has now confirmed an acceleration in commercial stock drawdowns that carries significant implications for energy prices, downstream costs, and the broader economic outlook.
When big ASX news breaks, our subscribers know first
The Macro Supply-Demand Equation Behind the U.S. Inventory Drawdown
How Tightening Global Supply Chains Are Amplifying Domestic Stock Declines
The erosion of U.S. crude inventories does not exist in isolation. Global supply chains that once reliably delivered barrels to American shores have become increasingly strained, with OPEC+ production discipline limiting the volumes available on international markets. Understanding OPEC's market influence helps explain why, when global exporters hold firm on output constraints, the residual slack that U.S. commercial stockpiles would normally absorb disappears, leaving domestic inventories exposed to demand-side pressure without a reliable offset from imports.
This dynamic is compounding an already complex domestic picture. Refinery utilisation rates have climbed as processors rush to meet pre-summer product demand, driving crude throughput higher and pulling barrels out of commercial storage at an accelerating pace. The seasonal transition into peak driving season has historically generated inventory drawdowns, but the pace of the current decline is moving faster than typical seasonal patterns would suggest.
Why Seasonal Demand Cycles Are Compressing Inventory Buffers Faster Than Expected
The summer driving season creates predictable demand uplift for gasoline and refined products, but what makes the current cycle unusual is the combination of factors hitting simultaneously. Refinery run rates are elevated, geopolitical disruption is constraining available supply, and underlying demand has proven more resilient than many analysts anticipated. Furthermore, each of these forces would be manageable in isolation. Together, however, they are compressing inventory buffers at a rate that has caught market participants off guard.
What Does the EIA Weekly Petroleum Status Report Actually Measure?
Understanding Commercial Crude Stockpiles vs. the Strategic Petroleum Reserve
The EIA's Weekly Petroleum Status Report, released every Wednesday, tracks crude oil held in commercial storage facilities across the United States. A critical distinction that is often misunderstood in public discourse is that these figures exclude the Strategic Petroleum Reserve, the government-controlled emergency stockpile that serves an entirely different function. Commercial inventories represent the working stock of the market — the barrels that refineries draw upon to maintain production and that traders use to calibrate near-term supply expectations.
The SPR, by contrast, is not available for routine market balancing. It requires a formal government release process and is intended for genuine supply emergencies rather than seasonal tightness. When analysts discuss the market implications of falling inventories, they are almost always referring to the commercial stockpile, not the SPR.
How the EIA Calculates the Five-Year Average Baseline
The five-year average functions as the primary benchmark against which weekly inventory readings are evaluated. The EIA calculates this baseline using the same seasonal week across the five preceding years, creating a normalised reference point that accounts for seasonal variation in both supply and demand. When commercial stocks fall below this average, it signals that the current market is tighter than historical norms would suggest for that time of year. A deviation of 3% below the five-year average — which is where the latest data now sits — is considered a meaningful signal by market participants.
Why the API Report and EIA Report Often Diverge
One of the more nuanced aspects of the weekly inventory release cycle is the existence of two separate reporting streams. The American Petroleum Institute publishes its own estimates every Tuesday, a day ahead of the official EIA figures. The API report is based on industry self-reporting, while the EIA uses a more comprehensive government survey methodology. The two figures frequently diverge, sometimes materially.
| Data Source | Reporting Frequency | Week Ending May 29 Draw Estimate | Methodology |
|---|---|---|---|
| EIA (Official) | Weekly (Wednesday) | -8.0 million barrels | Government survey-based |
| API (Industry) | Weekly (Tuesday) | -6.75 million barrels | Industry self-reported |
| Five-Year Average Deviation | Benchmark | -3% below average | Historical seasonal comparison |
Markets generally treat the EIA official figures as the authoritative reading because of its broader survey coverage and methodological rigour, but the API number serves as a directional indicator that often moves prices in the hours before the official release.
Breaking Down the Latest EIA Inventory Data: What the Numbers Reveal
Commercial Crude Stockpiles: From 441.7 Million to 433.7 Million Barrels
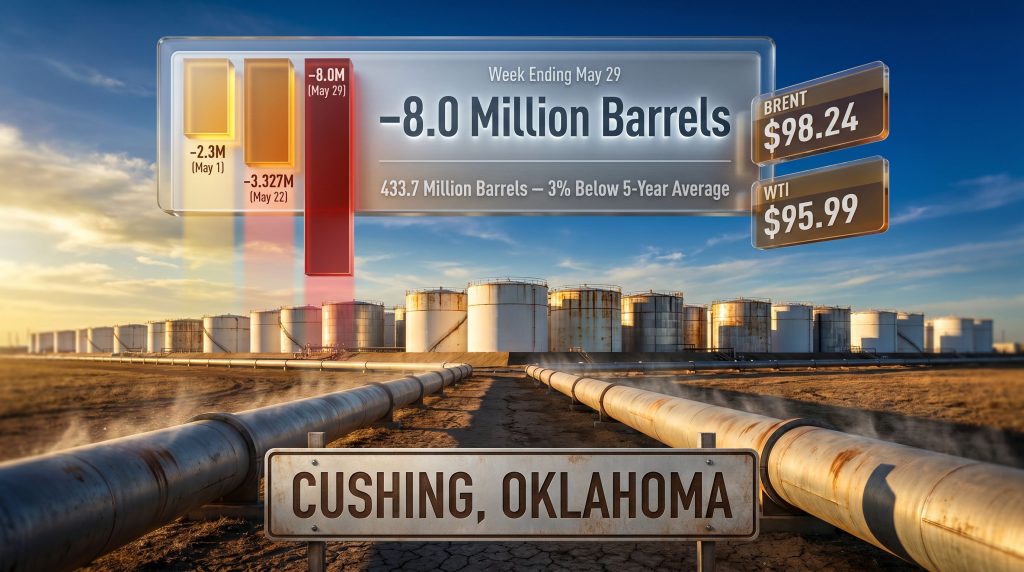
The week ending May 29 produced a draw of 8.0 million barrels, bringing total commercial crude stockpiles to 433.7 million barrels. This represents the largest single-week drawdown in the recent reporting series and marks a decisive shift from a position that was still slightly above the five-year seasonal average as recently as early May.
| Reporting Period | Estimated Weekly Draw | Cumulative Trend |
|---|---|---|
| Week ending May 1 | -2.3 million barrels | Inventories ~1% above 5-year avg |
| Week ending May 22 | -3.327 million barrels | Accelerating drawdown pace |
| Week ending May 29 | -8.0 million barrels (EIA) | 3% below 5-year average |
The trajectory is unambiguous. Over the course of a single month, the inventory position has shifted from a modest surplus to a meaningful deficit relative to seasonal norms, with the pace of drawdown accelerating rather than moderating. Monitoring oil price trends throughout this period has made the direction of travel unmistakeable.
Cushing, Oklahoma: The Delivery Hub That Signals Market Tightness
Cushing, Oklahoma functions as the designated delivery point for WTI crude oil futures contracts traded on the NYMEX. Inventory levels at Cushing are watched with particular intensity because they directly influence the settlement mechanics of WTI pricing. A 2.794 million barrel decline at Cushing in a single reporting week is a significant development that feeds directly into futures market pricing dynamics.
What makes the Cushing figure particularly important is its role as a pricing anchor. WTI futures are physically settled at Cushing, meaning that barrel availability at this specific location has an outsized influence on the WTI forward curve. When Cushing stocks fall sharply, the near-term WTI contracts tend to strengthen relative to longer-dated contracts — a condition known as backwardation that signals current tightness rather than anticipated future imbalance.
How Are Refined Product Inventories Responding to the Crude Draw?
Gasoline Inventories: A Temporary Build Amid Structural Tightness
Despite the significant crude drawdown, gasoline inventories posted a build of 3.4 million barrels in the latest reporting week, reversing a prior decline of 2.6 million barrels. This apparent contradiction deserves careful interpretation. A gasoline build during a crude drawdown typically reflects refinery activity — specifically the conversion of raw crude into finished products. However, average daily gasoline production declined to 9.4 million barrels per day, suggesting the build was not the result of production strength but rather a temporary demand softening.
Distillate Stocks: Supply Below Historical Norms Despite a Weekly Build
Middle distillates — encompassing diesel, heating oil, and jet fuel — recorded a weekly build of 1.5 million barrels with average daily production rising to 5.2 million barrels. Yet despite this positive weekly movement, distillate inventories remain 3% below the five-year seasonal average, a position that carries significant implications for freight, logistics, and industrial users who depend on diesel as a primary energy input.
| Product Category | Weekly Change | Production Rate | 5-Year Average Comparison |
|---|---|---|---|
| Crude Oil | -8.0 million barrels | N/A | 3% below average |
| Motor Gasoline | +3.4 million barrels | 9.4 mb/d | Recovering but fragile |
| Middle Distillates | +1.5 million barrels | 5.2 mb/d | 3% below average |
The simultaneous deficit in both crude and distillate inventories relative to historical norms is a structural condition, not a one-week anomaly. It points to a supply ecosystem that is running with less margin for error than markets have been accustomed to in recent years.
What Is U.S. Oil Demand Actually Doing Right Now?
Total Products Supplied: The Most Reliable Proxy for Real Consumption
The EIA measures real demand through a metric called total products supplied, which captures actual volumes delivered from refineries, blenders, and pipeline systems into end-use consumption. This figure is widely regarded as the most reliable indicator of genuine demand activity because it measures actual deliveries rather than survey-based consumption estimates.
When total products supplied rises year-over-year while inventories simultaneously decline, the compounding effect creates structural tightness rather than a temporary spike. Demand is pulling harder against a shrinking buffer, which is the precise condition that drives sustained price appreciation rather than short-lived market reactions.
For the four weeks ending May 29, total products supplied averaged 20.4 million barrels per day, representing a 3.0% increase year-over-year. This is a remarkably strong demand reading given the elevated price environment and suggests that consumer and industrial demand has not yet responded with significant behavioural adjustment to current price levels.
Demand Breakdown: Gasoline and Distillates Holding Firm
- Gasoline demand averaged 8.8 million barrels per day over the most recent four-week period, demonstrating resilience despite sustained price pressure at the retail pump.
- Distillate demand averaged 3.6 million barrels per day, up 1.2% year-over-year, reflecting continued strength in freight, agricultural, and industrial activity.
- These figures collectively confirm that demand-side factors are contributing meaningfully to the inventory drawdown, not merely supply-side constraints.
The next major ASX story will hit our subscribers first
Why Are Oil Prices Responding So Sharply to Inventory Data?
Brent Crude at $98.24 and WTI at $95.99: Reading the Price Signal
At the time of the data release, Brent crude was trading at $98.24 per barrel, up $2.21 (+2.30%) on the session, while WTI reached $95.99 per barrel, gaining $2.13 (+2.27%) intraday. These are not marginal movements. Price reactions of this magnitude in response to a single weekly inventory report indicate that the market was already positioned with considerable sensitivity to supply-side confirmation. Understanding the broader crude price drivers helps explain why inventory data triggers such outsised responses.
How Inventory Drawdowns Feed Directly Into Futures Pricing Mechanics
The relationship between inventory levels and futures pricing is not linear. Markets respond disproportionately to inventory changes when stockpiles are already below the five-year average because the risk premium embedded in prices scales with the perceived absence of a safety buffer. A 3% deficit below the seasonal average may sound modest in percentage terms, but in a market where millions of barrels per day flow through complex logistics networks, it represents a structural vulnerability that traders price aggressively.
The Geopolitical Overlay: How the Strait of Hormuz Situation Is Amplifying Market Sensitivity
The current inventory drawdown is unfolding against a backdrop of significant geopolitical disruption. Escalating tensions involving the Strait of Hormuz, one of the world's most critical chokepoints for oil transit, have sharply elevated the risk premium embedded in crude prices. Approximately 20% of global oil supply passes through this waterway. Any meaningful disruption would remove millions of barrels per day from global markets almost immediately.
Energy consultancy Rystad Energy has indicated that a re-escalation between the United States and Iran could push crude oil prices to levels approaching $180 per barrel by August. Goldman Sachs has separately flagged that the current refining environment is expected to generate strong processing margins through 2026, while also cautioning that sufficiently high oil prices could eventually trigger demand destruction. The IEA has warned that global oil stocks are tracking toward historical lows ahead of the summer demand peak.
Is Freefall the Right Term? Contextualising the Drawdown
What Constitutes a Statistically Significant Weekly Draw
Historical context matters when interpreting weekly inventory movements. In a typical year, weekly crude draws exceeding 5 million barrels are considered large. A single-week decline of 8.0 million barrels places the most recent reading in the upper range of historically significant drawdowns, but it should be evaluated within the seasonal context of rising refinery demand during the summer transition period.
The term describing US crude oil inventories in freefall EIA analysts have used reflects market psychology and price momentum more than it does a specific technical threshold. What the data actually shows is a consistent multi-week acceleration in drawdowns, from approximately 2.3 million barrels in early May to 8.0 million barrels by the final week of the month. That trajectory is sharp and meaningful, but it needs to be evaluated alongside the fact that inventories were still modestly above the five-year average as recently as early May.
The distinction matters for investors and analysts. A trend that has gone from surplus to deficit in under four weeks of accelerating drawdowns is concerning and market-moving, but it is not the same as a structural collapse. What it signals is a market that is tightening rapidly with limited near-term offset in sight.
What Happens When U.S. Inventories Fall Below the Five-Year Average?
The Threshold Effect: How Sub-Average Inventories Alter Trader Behaviour
Falling below the five-year seasonal average is not simply a statistical milestone. It triggers a meaningful shift in how professional traders and algorithmic systems approach the market. When inventories sit above the average, the market tends to price in a degree of supply flexibility. When stocks move below the average, that flexibility premium disappears and is replaced by a scarcity premium.
Historical periods during which U.S. commercial crude inventories sustained positions below the five-year average have generally corresponded with elevated and sustained oil prices. The mechanism is self-reinforcing: lower inventories reduce the market's tolerance for supply disruptions, which elevates the geopolitical risk premium, which in turn discourages demand growth that might otherwise release pressure on the supply side.
How Does the U.S. Inventory Picture Fit Into the Global Supply Framework?
Several global factors are shaping the context within which U.S. inventory data must be interpreted:
- OPEC+ production discipline has limited the volume of barrels available to international buyers, reducing import volumes that would otherwise replenish U.S. commercial stocks. Revised OPEC demand forecasts have further complicated the supply picture for near-term balancing.
- Iraq, the UAE, and Saudi Arabia have announced plans for significant output expansion, but these additions are not expected to materialise in meaningful volume until 2027, far too late to relieve the near-term tightness.
- Venezuela's export recovery has reached a seven-year high, but the marginal volumes involved are insufficient to materially shift global balances given the scale of the current deficit.
- China and India represent significant demand wildcards. China's partial reversal of its order to teapot refiners could either tighten or loosen global product markets. India faces the prospect of oil shock-driven inflation that could eventually suppress demand, but this transmission lag typically operates over quarters rather than weeks.
What Are the Downstream Price Implications for U.S. Consumers and Businesses?
Gasoline Prices: How Retail Costs Lag Crude Inventory Signals
Retail gasoline prices typically lag movements in crude oil by two to four weeks as the supply chain adjusts. When crude inventory drawdowns coincide with declining gasoline production rates — as is currently the case with output falling to 9.4 million barrels per day — the lag effect compresses and pump prices can move higher faster than consumers anticipate. In addition, the trade war oil impacts currently in play are adding a further layer of unpredictability to the retail price outlook.
The Industrial Cost Transmission Mechanism
For businesses dependent on distillate fuels, the implications extend beyond simple fuel cost increases. Diesel prices feed directly into freight costs, which then transmit through supply chains into the price of virtually every physical good. When distillate inventories are simultaneously 3% below the five-year average and demand remains above year-ago levels, the conditions for persistent cost inflation across industrial sectors are clearly present.
The Kansas City Federal Reserve has cautioned publicly that the current oil price shock may not prove to be transitory — a significant departure from the language that policymakers used during the post-pandemic inflation episode. Supply-driven price elevations tend to resolve only when new production capacity arrives or when prices reach a level that destroys enough consumption to rebalance the market. Both of those resolution mechanisms operate on timescales measured in quarters, not weeks.
A sustained crude inventory deficit, combined with elevated refinery throughput and year-over-year demand growth, creates the conditions for a prolonged price elevation cycle. Unlike corrections driven by demand destruction, supply-constrained tightness persists until either meaningful new production comes online or consumption responds to price signals. That process typically unfolds across multiple quarters.
Frequently Asked Questions: U.S. Crude Oil Inventories and the EIA Report
What is the EIA crude oil inventory report and when is it released?
The EIA Weekly Petroleum Status Report is published every Wednesday and provides a comprehensive snapshot of U.S. commercial crude oil inventories, refined product stocks, refinery utilisation rates, and demand proxies. It is considered the most authoritative weekly data release in U.S. energy markets.
What does it mean when U.S. crude inventories fall below the five-year average?
It signals that the market is tighter than historical seasonal norms would suggest. Professional traders interpret a below-average inventory position as a reduction in the market's supply buffer, which typically supports higher prices and elevates sensitivity to any additional supply disruptions.
How does a crude oil inventory drawdown affect oil prices?
Lower inventories reduce the visible supply cushion available to the market. When stocks decline faster than expected or move below seasonal averages, futures prices typically respond by moving higher as traders bid for a shrinking pool of available barrels. The effect is amplified when drawdowns occur at delivery hubs like Cushing, Oklahoma, because that location directly influences WTI futures settlement.
What is the difference between commercial crude stocks and the Strategic Petroleum Reserve?
Commercial crude stocks are privately held barrels stored at refineries, tank farms, and pipeline hubs available for immediate market use. The Strategic Petroleum Reserve is a government-controlled emergency stockpile stored in underground salt caverns, released only through formal government processes and not available for routine market balancing.
What is the Cushing, Oklahoma inventory level and why does it matter?
Cushing is the physical delivery point for WTI crude futures contracts. Inventory levels there directly influence the near-term pricing of WTI because futures contracts settling into physical delivery require barrels to be available at this specific location. Sharply lower Cushing inventories typically push the near-month WTI contract higher relative to deferred contracts.
How reliable is the API inventory estimate compared to the EIA official figure?
The API provides directional guidance and is released a day earlier, but it uses industry self-reporting rather than the EIA's broader government survey methodology. Discrepancies between the two figures are common. The EIA number is treated as the definitive reading by the majority of professional market participants.
What level of weekly draw is considered unusually large by historical standards?
Weekly crude draws exceeding 5 million barrels are generally considered large relative to historical norms. The most recent 8.0 million barrel draw falls well above that threshold and represents one of the more significant single-week declines in recent data history. The Reuters energy coverage of this release highlighted the degree to which the figure surprised consensus expectations.
Key Takeaways: What the EIA Inventory Data Signals for the Energy Market
- US crude oil inventories in freefall EIA reporting has confirmed a decline of 8.0 million barrels in the week ending May 29, reaching 433.7 million barrels, now 3% below the five-year seasonal average
- The drawdown pace accelerated sharply across May, from a 2.3 million barrel weekly draw in early May to the largest single-week decline in the recent series by month-end
- Cushing hub inventories fell by approximately 2.794 million barrels in a single week, directly influencing WTI futures pricing dynamics and forward curve structure
- Total U.S. oil demand measured by products supplied rose 3.0% year-over-year to 20.4 million barrels per day, confirming demand-side strength as a meaningful contributor
- Brent crude was trading above $98 per barrel while WTI approached $96 per barrel at the time of the data release, reflecting the market's forward-looking assessment of tightening supply buffers
- The IEA has separately flagged that global oil stocks are tracking toward historical lows ahead of the summer demand peak, providing an international dimension to the U.S.-specific drawdown story
- Energy analysts at Rystad have indicated that a re-escalation of U.S.-Iran tensions could drive crude toward $180 per barrel, while the Kansas City Federal Reserve has warned the current oil price shock may prove more persistent than initially expected
This article is intended for informational and educational purposes only and does not constitute financial or investment advice. Oil price forecasts and inventory projections involve inherent uncertainty and should not be relied upon as the basis for investment decisions. Past inventory trends and price relationships are not necessarily indicative of future outcomes.
Want to Stay Ahead of the Next Major Resource Discovery Driving This Energy Shift?
As oil market tightness reshapes commodity investment strategies, Discovery Alert's proprietary Discovery IQ model delivers real-time ASX mineral discovery alerts — cutting through the noise to surface actionable opportunities the moment they're announced. Explore how historic mineral discoveries have generated substantial returns and begin your 14-day free trial today to position yourself ahead of the broader market.