June 21, 2026
The Hidden Mechanics Behind Accelerating U.S. Petroleum Stock Depletion
Petroleum inventory cycles rarely move in straight lines. They pulse with the rhythm of refinery turnarounds, seasonal demand curves, import flows, and the invisible hand of geopolitical friction operating thousands of kilometres away. For most of any given year, these forces balance each other well enough that weekly inventory shifts pass without drama. But occasionally, multiple pressures converge simultaneously, and the data begins telling a different story entirely. That is precisely where U.S. energy markets find themselves right now, with US crude oil and gasoline inventories sinking fast across multiple product categories in a pattern that deserves considerably more analytical attention than a single headline can provide.
When big ASX news breaks, our subscribers know first
Understanding the EIA Weekly Petroleum Report: What It Measures and Why It Matters
How the U.S. Energy Information Administration Tracks Commercial Stockpiles
Every Wednesday morning, the U.S. Energy Information Administration releases its Weekly Petroleum Status Report, a comprehensive snapshot of domestic petroleum supply, storage, and demand conditions drawn from the prior week's data. This report sits at the centre of oil market intelligence because the United States remains both the world's largest petroleum consumer and one of its most transparent reporters of inventory data, giving these figures outsized influence on global price discovery.
The EIA collects this information from approximately 800 companies across the petroleum supply chain, including refiners, importers, pipeline operators, and commercial storage facilities. The data undergoes rigorous quality control before publication, producing regional breakdowns across five major U.S. zones: the East Coast, Midwest, Gulf Coast, Rocky Mountains, and West Coast. These regional figures aggregate into the national totals that traders and analysts monitor most closely when tracking U.S. crude oil inventories.
The Difference Between EIA and API Inventory Figures and Why Both Matter
A detail often overlooked by casual observers is that the oil market receives two separate inventory estimates each week, not one. The American Petroleum Institute releases its figures on Tuesday evening, approximately eighteen hours before the EIA's Wednesday publication. The API draws on voluntary submissions from a subset of industry participants, making its dataset somewhat narrower in scope than the EIA's mandatory reporting framework.
This methodological gap explains why the two figures frequently diverge in magnitude, even when they agree directionally. In the most recent reporting period, the API estimated a crude inventory draw of 9.1 million barrels, while the EIA subsequently confirmed a draw of 7.9 million barrels. Both figures point unmistakably toward significant stock depletion, and sophisticated market participants typically monitor both releases, using the API data as an early directional signal while reserving final analysis for the more comprehensive EIA report.
What Five-Year Average Benchmarking Reveals About Supply Conditions
The five-year seasonal average is not merely a statistical convenience. It represents the normalised baseline against which current supply adequacy is judged. Because petroleum demand and storage levels follow predictable seasonal patterns, raw inventory numbers without seasonal context can be misleading. A stockpile of 445 million barrels in May carries very different implications depending on whether that level is historically high, average, or deficient for that time of year.
When commercial crude stockpiles fall below the five-year seasonal average, the buffer between current supply and normal demand begins to erode. Historically, sustained deficits below this threshold have preceded periods of upward price pressure as market participants price in reduced flexibility to absorb unexpected supply disruptions.
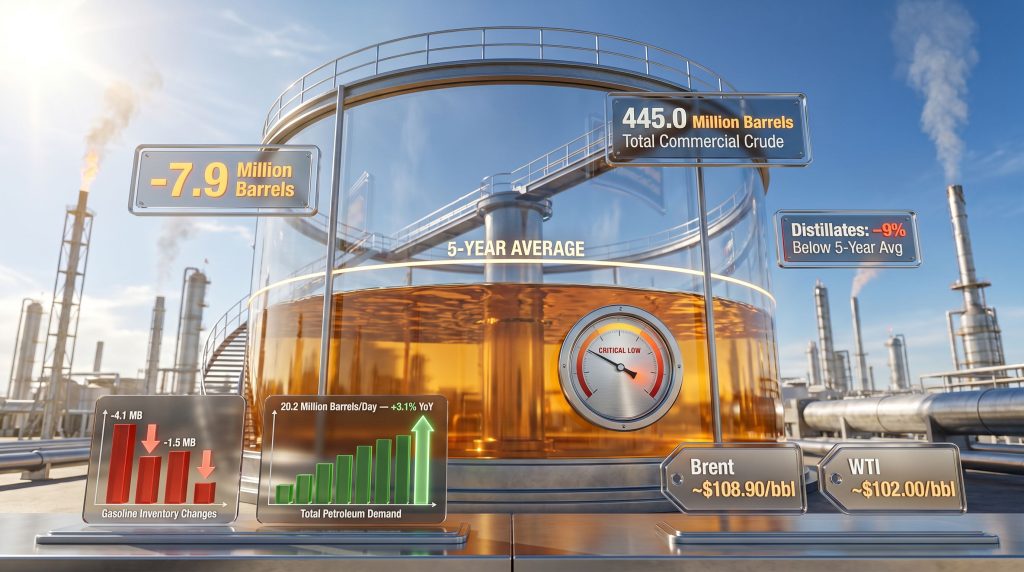
Current commercial crude stocks at 445.0 million barrels now sit 2% below the five-year seasonal benchmark, a deviation that alone might not trigger alarm but becomes considerably more significant when layered against concurrent gasoline and distillate deficits. Furthermore, monitoring crude oil price trends alongside inventory data provides a fuller picture of where markets may be heading.
How Deep Is the Current Drawdown? Breaking Down the Latest EIA Data
Crude Oil Inventories: A 7.9 Million Barrel Weekly Decline Explained
The week ending May 15, 2026, produced one of the more striking single-week crude inventory draws in recent memory. A 7.9 million barrel reduction in commercial stocks translates practically to a pace of drawdown running well above seasonal expectations, suggesting that refinery crude intake is outrunning the rate at which domestic production and imports are replenishing storage. According to Reuters reporting on the latest EIA data, this decline has drawn significant attention from energy market analysts.
| Metric | Latest Reported Figure |
|---|---|
| Weekly crude inventory draw (EIA) | -7.9 million barrels |
| Weekly crude inventory draw (API) | -9.1 million barrels |
| Total commercial crude stockpiles | 445.0 million barrels |
| Deviation from five-year seasonal average | -2% |
The convergence of the EIA and API figures on the same directional outcome adds credibility to the reading. When both independently confirm a large draw, the probability of measurement error as an explanation diminishes considerably.
Gasoline Stocks Under Pressure: Two Consecutive Weeks of Declines
Gasoline inventories have now registered back-to-back weekly declines, with the most recent period recording a 1.5 million barrel draw following a steeper 4.1 million barrel reduction the week prior. The cumulative two-week decline of approximately 5.6 million barrels in gasoline stocks is particularly notable because it is occurring as average daily gasoline production stands at just 9.3 million barrels per day, a level that indicates capacity is being stretched rather than comfortably surplus.
| Metric | Latest Reported Figure |
|---|---|
| Gasoline inventory change (current week) | -1.5 million barrels |
| Gasoline inventory change (prior week) | -4.1 million barrels |
| Average daily gasoline production | 9.3 million barrels/day |
The tightening in gasoline stocks is occurring precisely as seasonal demand begins its annual acceleration into the summer driving period, adding a temporal dimension to the supply concern.
Distillate Inventories: A Modest Build That Masks a Deeper Deficit
Middle distillates present a subtler but arguably more structurally concerning picture. While the latest reporting period showed a 400,000 barrel increase in distillate stocks with daily production averaging 5.0 million barrels, this modest build does nothing to address the underlying deficit that has accumulated over recent months.
-
Distillate inventories remain 9% below the five-year seasonal average, a deficit that dwarfs the weekly crude deviation
-
Daily distillate production averaged 5.0 million barrels per day during the reporting period
-
Four-week distillate demand averaged 3.6 million barrels per day, running 1.4% above the prior year equivalent
A one-week build in distillate stocks does not erase a 9% structural deficit relative to seasonal norms. Middle distillate undersupply of this magnitude has historically been associated with elevated diesel and heating oil prices, a condition with direct cost implications for freight, agriculture, and manufacturing sectors that rely on these fuels intensively.
What Is Total Products Supplied and What Does It Tell Us About U.S. Oil Demand?
Decoding the Four-Week Demand Proxy Used by Energy Analysts
Total products supplied is the petroleum industry's primary approximation of domestic consumption. Because actual end-user consumption is extremely difficult to measure in real time, the EIA calculates the volume of petroleum products delivered into the U.S. distribution network as the closest available proxy. The four-week rolling average smooths out short-term volatility to reveal the underlying demand trend.
The latest four-week average registers at 20.2 million barrels per day, a figure that represents a 3.1% year-over-year increase and confirms that U.S. petroleum consumption is genuinely expanding rather than holding steady.
-
Total products supplied: 20.2 million barrels per day (four-week average)
-
Year-over-year growth: +3.1% compared to the same period in the prior year
-
Gasoline demand: 8.9 million barrels per day over the four-week window
-
Distillate demand: 3.6 million barrels per day, up 1.4% year-over-year
Why Rising Demand Alongside Falling Inventories Creates a Tightening Feedback Loop
The interaction between growing consumption and declining stockpiles is not simply additive. It creates a compounding dynamic where each week of above-average demand accelerates the depletion of the inventory buffer, while the shrinking buffer reduces the market's tolerance for any supply disruption. As stocks fall, the risk premium embedded in futures prices tends to expand, which in turn affects refiner purchasing behaviour, import economics, and ultimately consumer prices at the pump.
This feedback mechanism is one reason that sustained multi-week inventory draws receive disproportionate market attention. A single anomalous week can reflect a temporary refinery turnaround or an import scheduling gap. However, multiple consecutive draws suggest a structural imbalance that refinery output or import volumes are not correcting quickly enough to offset.
What Happens to Oil Prices When Inventories Fall Below the Five-Year Average?
Historical Precedent and the Price Transmission Mechanism
The relationship between inventory deficits and price increases is well-documented but not mechanical. The transmission typically occurs through a specific sequence: declining stocks reduce the perceived supply cushion, traders adjust their risk assessments upward, futures curves shift, and physical crude prices follow. The speed and magnitude of the response depends heavily on the broader market context.
What is clear from historical episodes is that inventory deficits below the five-year average, particularly when they persist across multiple product categories simultaneously, tend to create conditions where price volatility increases markedly even if the directional move is not always immediately higher.
The WTI and Brent Price Response to Tightening U.S. Supply Conditions
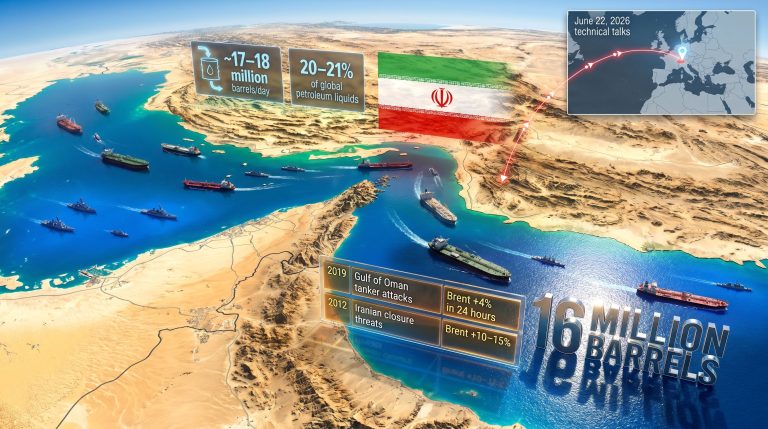
At the time of the EIA report's release on Wednesday, May 20, 2026, benchmark crude prices reflected the competing forces of tight domestic supply conditions and evolving geopolitical sentiment around U.S.-Iran diplomacy.
| Benchmark | Price at Time of Report | Week-Over-Week Change |
|---|---|---|
| Brent Crude | ~$108.90 per barrel | +~$1.00 |
| WTI Crude | ~$102.00 per barrel | -~$0.50 |
The intraday weakness on the day of the report partly reflected optimism around potential diplomatic developments, with markets weighing the inventory tightening signal against the possibility of Iranian supply re-entering global markets. This tension between fundamental supply data and geopolitical optionality is a recurring feature of current oil market dynamics, and understanding the trade war impact on oil adds further context to these price movements.
Why Geopolitical Factors Are Amplifying the Inventory Signal
Domestic inventory data does not operate in a geopolitical vacuum. The Strait of Hormuz, through which approximately 20% of global oil trade transits, has become a renewed source of supply uncertainty in the current environment, with reported disruptions affecting tanker movements and prompting the U.S. to redirect SPR cargoes toward Asian markets. Separately, ongoing drone attacks on Russian refining infrastructure have raised concerns about diesel supply from a country that has historically been a significant global exporter of middle distillates.
When geopolitical risk factors constrain import flexibility at precisely the same time that domestic inventories are drawing down, the market's ability to self-correct through increased supply becomes structurally impaired. Consequently, the complex interplay of oil trade and geopolitics gives the latest EIA data its particularly sharp market significance.
Is Gasoline Production Declining and What Does That Mean for Pump Prices?
Refinery Output Trends and the 9.3 Million Barrel Per Day Signal
Average daily gasoline production of 9.3 million barrels per day is a figure that warrants scrutiny in the context of demand running at 8.9 million barrels per day over the same four-week period. The apparent surplus of production over consumption might suggest stocks should be building, not declining. The reconciliation lies in the structure of refinery operations.
Refinery output is not perfectly continuous. Planned and unplanned maintenance events, crude quality variations, and operational configurations all create week-to-week variability in gasoline yields. When the production figure represents an average across the reporting week while demand is assessed over a four-week rolling window, the comparison does not necessarily reveal a simple surplus. Furthermore, the prior week's 4.1 million barrel draw suggests that production in that earlier period was considerably less sufficient relative to demand.
The Relationship Between Crude Drawdowns, Refinery Runs, and Retail Fuel Pricing
There is a relatively direct but time-lagged pathway between crude inventory tightness and retail gasoline prices. As crude stocks fall and refinery input costs rise on tighter spot markets, crack spreads (the margin between crude input costs and refined product values) come under pressure. Refiners facing higher input costs typically pass these through to wholesale prices, which cascade into retail pump prices within a timeframe of roughly two to four weeks depending on the regional market structure.
Consumers tend to notice fuel price increases more acutely than they register the supply data that precedes them. Understanding the inventory signal in advance provides meaningful lead time for both businesses managing fuel cost exposure and individual consumers evaluating spending decisions.
Seasonal Demand Patterns That Accelerate Summer Gasoline Drawdowns
The current drawdown pattern is occurring at the threshold of the peak summer driving season in the United States, a period historically characterised by gasoline demand surges above annual averages. The combination of declining production output, currently averaging 9.3 million barrels per day, and sustained consumer demand averaging 8.9 million barrels per day over the past four weeks creates conditions where supply replenishment is struggling to keep pace with consumption. As driving activity intensifies through June and July, the demand pressure on already-constrained gasoline stocks is likely to intensify rather than moderate.
The next major ASX story will hit our subscribers first
How Do Consecutive Weekly Draws Signal a Structural Shift in U.S. Oil Markets?
Single Draw vs. Multi-Week Trend: When Data Becomes a Market Signal
Experienced energy market analysts apply a critical distinction between isolated weekly inventory moves and developing multi-week trends. A single large draw frequently reflects a transient factor: a delayed import cargo, an unplanned refinery outage, or a statistical adjustment in the prior period's data. These events resolve themselves within one or two subsequent reporting cycles.
By contrast, consecutive weekly draws across multiple product categories, occurring simultaneously in crude oil, gasoline, and distillates (the latter remaining structurally below seasonal averages despite a modest single-week build), constitute a pattern that market participants treat as a genuine supply-demand signal rather than statistical noise. In addition, OPEC's influence on oil supply decisions can either compound or partially offset these domestic inventory pressures depending on their production posture.
What Analysts Watch After Back-to-Back Inventory Declines
Following sustained multi-week draws, analysts typically monitor several leading indicators to assess whether the trend is likely to persist or reverse:
-
Refinery utilisation rates: Higher utilisation would indicate refiners are responding to product demand by maximising output, potentially arresting gasoline stock declines
-
Import arrival schedules: A surge in expected crude imports would suggest the draw is temporary rather than structural
-
OPEC+ production signals: Any indication of output increases from major producers would affect the global crude supply baseline feeding into U.S. imports
-
SPR withdrawal pacing: Accelerated releases from the Strategic Petroleum Reserve can temporarily mask commercial stock declines while masking the full extent of underlying demand pressure
The Role of the Strategic Petroleum Reserve in Buffering Commercial Stock Deficits
The SPR plays a unique and sometimes misunderstood role in inventory dynamics. It is reported separately from commercial inventories in the EIA data, meaning that SPR releases do not show up as increases in commercial stockpiles unless that crude is actually drawn down and placed into commercial storage or delivered to refiners. When SPR oil is released and consumed directly by refiners, it effectively reduces the rate of commercial stock decline without appearing as a commercial inventory increase, making the underlying demand pressure less visible in the weekly figures.
The fact that the U.S. has been sending SPR cargoes to Asian markets in the current environment adds a further complication, as this deployment reduces the available domestic buffer without translating into domestic supply relief.
Scenario Analysis: What Comes Next If Inventory Draws Continue?
Scenario 1: Drawdowns Stabilise as Refinery Output Recovers
In the most constructive near-term outcome, seasonal refinery maintenance concludes on schedule through late May and early June, allowing utilisation rates to climb toward peak summer operating levels. Gasoline and crude stocks begin rebuilding as production output recovers and import volumes normalise. Price pressure moderates even against an elevated global benchmark backdrop, and the five-year average deficit narrows toward historical seasonal norms.
Scenario 2: Demand Acceleration Deepens the Deficit
If the summer driving season delivers demand volumes that sustain total products supplied above 20 million barrels per day through June and July, while refinery output remains constrained at current levels, crude inventories could fall materially further below the five-year average. In this scenario:
-
WTI and Brent face renewed upward price pressure from domestic tightening compounding global supply risks
-
Distillate deficits, already at 9% below seasonal norms, deepen as industrial and freight activity accelerates
-
Retail gasoline prices approach levels that begin generating demand destruction, the natural self-correcting mechanism that eventually rebalances the market
Scenario 3: Geopolitical Disruption Compounds Domestic Supply Stress
The most challenging scenario combines continued Strait of Hormuz-related trade disruptions, which limit U.S. import flexibility particularly for heavier Middle Eastern crude grades preferred by Gulf Coast refineries, with SPR releases proving insufficient to offset commercial stock depletion at meaningful scale. In this configuration:
-
Refinery margins widen as crude input costs rise against constrained supply availability
-
Diesel and heating oil prices face amplified upward pressure from both domestic deficits and global middle distillate tightness
-
The inventory signal becomes a self-reinforcing market narrative that attracts speculative positioning, potentially accelerating price moves beyond what fundamentals alone would justify
Disclaimer: The scenario analysis above represents analytical projections based on current market conditions and historical precedents. These scenarios are not predictions of future price outcomes. Actual market developments will depend on numerous variables including OPEC+ decisions, geopolitical developments, weather patterns, and macroeconomic conditions that cannot be reliably forecast.
FAQ: US Crude Oil and Gasoline Inventories
What does a 7.9 million barrel crude draw actually mean in practical terms?
A draw of this magnitude removes approximately 7.9 million barrels from the total pool of commercially available crude oil held in U.S. storage facilities. In a single week, this represents a rate of depletion roughly equivalent to the combined daily crude production of a mid-sized OPEC member nation. When it occurs alongside concurrent draws in gasoline and a structural deficit in distillates, it signals that refineries are consuming crude at a rate that incoming supply is not matching.
Why do EIA and API inventory figures sometimes differ?
The API releases its estimates based on voluntary reporting from a subset of industry participants, using a dataset that is narrower than the EIA's mandatory and standardised reporting framework. The EIA figure draws on a broader population of reporting entities and incorporates quality controls that the API estimate does not include. Both figures pointed to large crude draws in the most recent period, with the API reporting 9.1 million barrels and the EIA confirming 7.9 million barrels, reflecting methodological differences rather than contradictory real-world conditions.
How far below the five-year average are current distillate stocks?
Distillate inventories currently sit approximately 9% below the five-year seasonal average despite a modest 400,000-barrel build in the most recent week. This structural deficit is particularly relevant for diesel-dependent sectors including freight transportation, agriculture, and manufacturing, where fuel cost increases translate directly into operating cost pressures across extended supply chains.
Does a crude inventory draw always lead to higher oil prices?
Not automatically. Price outcomes depend on the broader market context including OPEC+ production policy, global demand trends, refinery utilisation rates, and geopolitical risk premiums. However, sustained multi-week draws that push stockpiles below seasonal averages do historically correlate with tighter market conditions. The current environment adds complexity because geopolitical factors around U.S.-Iran diplomacy are simultaneously creating downside price scenarios that partially offset the bullish inventory signal.
What is total products supplied and why is it used as a demand proxy?
Total products supplied measures the volume of petroleum products delivered into the U.S. distribution system over a given period. Because actual end-user consumption is difficult to measure in real time at the national scale, this delivery-into-distribution metric serves as the closest available approximation of actual demand. The four-week rolling average of 20.2 million barrels per day running 3.1% above the prior year equivalent confirms that U.S. petroleum consumption is in a genuine growth phase rather than holding at prior-year levels. OilPrice.com's analysis of inventory trends offers further detail on how this demand proxy is interpreted by market participants.
Key Takeaways: What the Accelerating Inventory Decline Tells Us About U.S. Energy Markets
The convergence of multiple inventory deficits across crude oil, gasoline, and distillates is not a coincidence. It reflects a period where US crude oil and gasoline inventories sinking fast signals that consumption growth is outrunning supply replenishment, geopolitical friction is limiting import flexibility, and the seasonal demand calendar is about to add further pressure. The most important summary points from the current data are:
-
U.S. commercial crude stockpiles have fallen to 445.0 million barrels, now 2% below the five-year seasonal benchmark, with both EIA and API data confirming the directional trend
-
Back-to-back gasoline inventory declines totalling approximately 5.6 million barrels over two weeks reflect a demand environment that production at 9.3 million barrels per day is struggling to replenish
-
Total U.S. petroleum demand at 20.2 million barrels per day is running 3.1% above the same period last year, a meaningful acceleration that amplifies the inventory signal
-
Distillate inventories remain structurally undersupplied at 9% below the five-year average, with direct cost implications for freight, agriculture, and industrial sectors
-
The geopolitical backdrop involving Strait of Hormuz uncertainty and evolving U.S.-Iran diplomacy creates a binary risk environment where supply scenarios range from moderate tightening to acute disruption, making the domestic inventory signal simultaneously more important and harder to act upon with confidence
For readers seeking additional context on U.S. petroleum supply and demand dynamics, the EIA publishes its Weekly Petroleum Status Report every Wednesday along with an extensive library of historical data tools available at eia.gov. In addition, Trading Economics provides historical crude oil stock data that offers valuable long-term context for interpreting the current drawdown cycle.
Want to Stay Ahead of the Next Major Resource Discovery Triggered by Shifting Energy Markets?
As tightening U.S. petroleum inventories and geopolitical pressures reshape global commodity dynamics, the ripple effects often surface first in ASX-listed resource stocks — and Discovery Alert's proprietary Discovery IQ model delivers real-time alerts the moment significant mineral discoveries are announced, ensuring subscribers can act on actionable opportunities before the broader market catches on. Explore how historic discoveries have translated into extraordinary returns on Discovery Alert's dedicated discoveries page, and begin your 14-day free trial today to position yourself ahead of the next major find.