
July 9, 2026
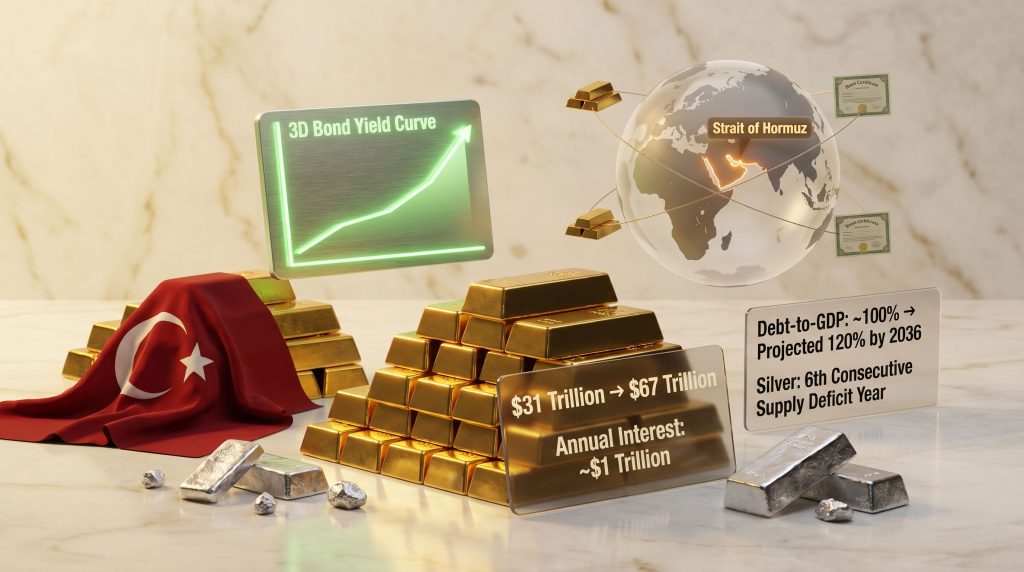
When the World's Savings Account Runs Dry
Every major financial system in history has carried within it the seeds of its own unravelling. Not through sudden collapse, but through the slow accumulation of structural imbalances that compound quietly until a single external shock makes the fragility impossible to ignore. The current US fiscal trajectory, shaped in part by US inflation and debt pressures, fits this pattern with uncomfortable precision, and recent events in global energy markets and sovereign reserve management have begun to make that fragility visible in real time.
Understanding why the US debt spiral and Turkey selling gold reserves in early 2026 matters to investors and policymakers worldwide requires stepping back from the immediate headlines and examining the deeper architecture of sovereign debt, reserve asset dynamics, and the long cycle of economic dominance that shapes how wealth is stored, transferred, and ultimately destroyed.
When big ASX news breaks, our subscribers know first
The Mechanics of a US Debt Spiral
How Borrowing Costs Outpace Economic Growth
A debt spiral does not announce itself loudly. It develops gradually through a structural mismatch between what a government earns and what it spends, and it accelerates when the cost of servicing existing debt begins to consume a growing share of future revenue. For the United States, that mismatch has been widening for decades.
The federal government currently runs an annual deficit of approximately $2 trillion, with total publicly held debt approaching levels that make even incremental interest rate increases consequential. Annual interest expense has now crossed $1 trillion per year, a figure that would have seemed extraordinary just a decade ago. According to Congressional Budget Office projections, this trajectory does not stabilise on its own.
| Metric | Current | Projected (2035-2036) |
|---|---|---|
| Publicly Held US Debt | ||
| Annual Interest Expense | ~$1 trillion | ~$2.1 trillion |
| Annual Deficit | ~$2 trillion | ~$2.7 trillion (9% GDP) |
| Interest Rate vs. GDP Growth | Near parity | Interest rate exceeds GDP growth |
The defining feature of a spiral is self-reinforcement. Higher borrowing costs require additional debt issuance to cover interest payments. Additional debt issuance increases the total stock of debt outstanding, which compounds future interest obligations. Each turn of the cycle starts from a higher base than the one before it. Furthermore, as Sprott's research on how the debt cycle favours gold illustrates, this structural dynamic has historically driven investors and sovereign entities alike toward hard assets.
The Treasury Auction Mechanism and What Happens When Demand Weakens
The US government finances its deficit by issuing Treasury bonds at regular auctions. Foreign governments, institutional investors, and central banks purchase these instruments, effectively lending money to Washington in exchange for a fixed interest payment over the life of the bond. This system functions smoothly as long as demand at those auctions remains robust.
When foreign holders of existing Treasuries need liquidity, they sell those bonds on the secondary market. If selling pressure is high, secondary market prices fall. A bond purchased at face value of $1,000 with a $50 annual coupon might trade at $800 in a stressed secondary market. The coupon payment remains $50, but the effective yield for the secondary buyer rises from 5% to 6.25%. This is why bond prices and yields move in opposite directions.
The cascade effect operates through the following sequence:
- Foreign demand for US Treasuries declines due to external financial stress
- Existing Treasury holders sell on the secondary market at discounted prices
- Discounted secondary bonds offer higher effective yields than newly issued Treasuries
- Auction buyers prefer cheaper secondary bonds over new government issuances
- The US government must raise coupon rates on new issuances to attract buyers
- Higher coupon rates compound the already substantial annual interest expense
- Greater borrowing is required to cover the expanded interest bill
- The cycle restarts at a larger scale with a higher cost base
The defining risk is not that a single auction fails dramatically. It is that demand gradually weakens, forcing incremental yield increases that compound across trillions of dollars in outstanding debt, accelerating the fiscal deterioration the market was already pricing in.
How Energy Shocks Destabilise Treasury Demand
The Strait of Hormuz as a Systemic Stress Test
The closure of the Strait of Hormuz in early 2026 functioned as precisely the kind of external shock capable of accelerating an existing debt vulnerability. When analysing the strait's importance, the commonly cited figure of approximately 20% of global oil supply understates the impact for oil-importing nations. Countries like Turkey, Japan, and India do not have access to oil produced and consumed domestically. Their relevant market is the global export market, and the Strait of Hormuz represents approximately 40% of that export market.
For these nations, a strait closure is not a 20% supply disruption. It is closer to a 40% disruption of their accessible supply, with price effects that can approximate a doubling of energy costs in a short period.
When Nations Must Liquidate Reserves
The financial logic that follows an energy shock for an oil-importing nation is straightforward and painful. If energy costs double but government revenue does not, the gap must be funded from somewhere. For countries that hold their foreign reserves primarily in US Treasuries, that somewhere is the Treasury portfolio.
| Country Profile | Characteristics | Vulnerability Level |
|---|---|---|
| Oil-importing emerging economies | 100% reliant on export markets, savings in US Treasuries | Extreme |
| Mid-tier emerging markets | Partial domestic production, mixed reserve assets | High |
| Advanced oil importers | Diversified reserves, stronger fiscal buffers | Moderate |
| Western Hemisphere producers | Net energy exporters, limited Treasury dependency | Low |
The consequence of simultaneous Treasury liquidation across a cluster of emerging economies is direct downward pressure on secondary market bond prices, which pushes effective yields higher. Consequently, this reduces the attractiveness of new Treasury auction issuances unless the government offers higher coupon rates to compensate. The energy shock and the debt spiral reinforce each other.
Turkey Selling Gold Reserves: What Actually Happened
The Scale of the Liquidation
Turkey represents a case study in how these dynamics play out in practice. As an emerging economy that imports the overwhelming majority of its oil and historically parked its foreign reserves in a combination of US Treasuries and gold, Turkey sat in one of the most exposed positions when energy markets were disrupted.
In the two-week period ending March 20, 2026, Turkey sold approximately 58 tonnes of gold, valued at over $8 billion, representing the largest two-week reserve drawdown in seven years. This came after Turkey had already liquidated approximately 90% of its US Treasury holdings, reducing its position from roughly $15 billion to approximately $1 billion.
The sequencing matters. Treasuries were sold first because they are the most standard reserve asset and the most liquid in normal conditions. Gold came second, not because gold was considered inferior, but because the Treasury position had been largely exhausted. This pattern is consistent with how analysts view central bank gold reserves functioning as a last-resort liquidity buffer.
Swaps, Collateral, and the Reality of Reserve Monetisation
A technical distinction worth understanding is that a portion of Turkey's gold monetisation occurred through collateralised borrowing rather than outright sale. Turkish authorities borrowed against gold holdings rather than selling them directly, a mechanism sometimes characterised as preserving the gold position.
Borrowing against an asset and retaining nominal title does not preserve economic control of that asset. An asset pledged as collateral is effectively encumbered, and the entity holding the collateral assumes the substantive economic position of ownership in the event of default. The distinction between a collateralised gold loan and an outright gold sale is narrower than it appears in practice.
This is a nuance that matters for investors monitoring central bank gold data, as reported holdings may not fully reflect the liquidity position of a nation's reserve portfolio when significant collateral arrangements are in place.
Why Turkey's Actions Signal Broader Systemic Risk
Turkey was not unique in its structural position. Dozens of other emerging economies share the same combination of oil import dependency, Treasury-heavy reserve portfolios, and limited domestic fiscal buffers. When Turkey moved to liquidate Treasuries and then gold, it transmitted a signal to every other country in a similar position: the exit is available, and the first movers get the better price.
The dynamic is similar to a bank run in structure. Once one large depositor signals distress and begins withdrawing, the rational response for others who hold the same underlying exposure is to move quickly rather than wait. The cascade is not driven by panic alone but by a logical first-mover calculus that becomes self-fulfilling.
Sri Lanka's experience in 2022 provides a historical reference point for what happens when reserve depletion reaches its terminal stage. After tourism revenues collapsed following pandemic lockdowns, Sri Lanka found itself unable to fund energy imports, experienced rolling blackouts, fuel shortages, and ultimately a political crisis severe enough that the president was forced to flee in the middle of the night. The lesson drawn by every reserve manager globally is that the consequences of waiting too long are catastrophic and largely irreversible.
Turkey's Reserve Rebuild
Following the acute liquidation phase, Turkey's central bank has been rebuilding its physical gold position, with holdings trending back toward the 730 tonne range as of April 2026. This pattern of liquidation followed by rebuilding is consistent with gold functioning as intended: a reserve asset that can be rapidly monetised in a crisis and then restored when conditions allow. For deeper context on how central banks and gold prices interact in these cycles, the relationship between sovereign reserve decisions and spot market dynamics is particularly instructive.
Gold's Long-Cycle Role and the Central Bank Rotation
Why Central Banks Are Choosing Gold Over Treasuries
The shift in central bank reserve preferences from US Treasuries toward gold did not begin with the 2026 energy crisis. It has been building for years as reserve managers recalibrate their portfolios in response to the long-term trajectory of US fiscal metrics. Gold has now become the number one reserve asset held by central banks globally on a value basis, a shift with substantial implications for how sovereign debt markets function.
The purchasing power argument underlying this shift is compelling when examined in concrete terms:
| Year | USD Price (Avg. US Home) | Gold Price per Oz | Cost in Gold Ounces |
|---|---|---|---|
| 1971 | ~$150,000 | ~$44/oz | ~3,400 oz |
| 2026 | ~$1,200,000 | ~$3,300/oz | ~287 oz |
Measured in US dollar terms, average home prices rose approximately 800% between 1971 and 2026. Measured in gold, the same home became roughly 92% cheaper over the same period. The purchasing power of the US dollar has declined by approximately 88% since 1971. Reserve managers applying this second unit of measurement are drawing rational conclusions about where long-term purchasing power is better preserved.
The Inflation vs. Default Choice
Governments facing the terminal stages of a debt accumulation cycle typically confront a binary choice: allow a Treasury auction to fail and absorb the immediate economic consequences of a hard default, or print money to purchase their own debt and distribute the cost through inflation over a longer time horizon.
Inflation carries a political advantage that default does not. It comes with plausible deniability. Rising housing costs can be attributed to supply constraints, immigration, or corporate pricing behaviour. A failed Treasury auction is unambiguous and immediate. For this structural reason, the historical pattern at the end of major debt cycles has consistently favoured the inflationary path, and central banks managing long-term reserve portfolios are pricing in that probability.
Gold Price Weakness: Liquidity Event, Not Structural Reversal
Why Precious Metals Sold Off Despite Geopolitical Escalation
One of the more counterintuitive features of the 2026 energy crisis was that gold prices declined even as geopolitical tensions escalated. For investors accustomed to thinking of gold as a safe haven that appreciates during conflict, this required explanation.
The mechanism is liquidity-driven rather than fundamental. When sovereign entities face emergency funding needs, they sell their most liquid assets first. Gold is exceptionally liquid. It trades continuously in deep global markets and can be converted to cash or used as collateral almost immediately. That liquidity is precisely why it functions as a reserve asset, and it is why it gets sold first when a genuine cash crunch arrives.
A decline in the gold price during a crisis does not indicate a loss of confidence in gold as a reserve asset. It indicates that gold is performing its core function: providing emergency liquidity to entities under financial stress. The selloff is a feature, not a failure.
The distinction between a liquidity-driven selloff and a structural deterioration in the gold thesis is critical for long-term investors. The former is temporary and crisis-specific. The latter would require a fundamental change in the supply and demand dynamics and the monetary role of the metal, neither of which has occurred.
The next major ASX story will hit our subscribers first
Silver's Structural Undervaluation and Industrial Scarcity
Six Consecutive Years of Supply Deficits
Silver entered 2026 in the sixth consecutive year of structural supply deficit. Unlike base metals where mine supply can be scaled relatively quickly in response to price signals, silver production faces structural constraints that are not easily resolved by higher prices alone. Indeed, silver supply deficits have been building across consecutive years, driven by both constrained mine output and expanding industrial consumption.
Approximately 70-80% of silver production occurs as a byproduct of mining other metals, primarily copper, lead, and zinc. This means that silver supply is largely determined by the economics of base metal mining rather than silver's own price. A surge in silver prices does not automatically trigger a surge in silver mine supply when most of that supply comes as an incidental output of operations focused on other commodities.
Industrial Demand Beyond Solar Panels
The industrial demand case for silver is frequently reduced in public discussion to solar panel manufacturing, which, while significant, represents only one component of a much broader demand profile. Silver is arguably the best electrical conductor of any element at standard temperatures, outperforming copper in conductivity by a measurable margin. In applications where performance requirements justify the cost, silver is irreplaceable.
Key industrial demand drivers include:
- Defence and Military Electronics: Silver is a critical material in advanced weapons guidance systems, radar components, and electronic warfare equipment. Expanding NATO defence budgets across North America and Europe represent a structural demand growth driver that is independent of economic cycles.
- Medical Applications: Silver's antimicrobial properties and electrical conductivity make it essential in medical device manufacturing, pharmaceutical production, and advanced wound care products.
- Precision Electronics: In applications where copper's conductivity limitations create performance problems, silver offers the only viable alternative at scale.
- Solar and Energy Infrastructure: Photovoltaic panel manufacturing remains a large and growing source of silver demand, with no current substitution pathway that preserves panel efficiency.
Evaluating Silver Miners: Leverage to the Structural Thesis
For investors seeking exposure to silver's structural supply-demand imbalance, the mining equities often offer more leverage to price moves than the physical metal itself, but with a more complex risk profile that requires careful segmentation.
| Company Stage | Risk Level | Upside Potential | Appropriate For |
|---|---|---|---|
| Cash-flowing producers | Lower | Moderate-High | Most investors |
| Late-stage developers | Medium | High | Experienced resource investors |
| Early-stage explorers | High | Very High | Speculative allocation only |
High-quality silver producers with established cash flows are positioned to generate exceptional margins at current silver prices. Furthermore, for a comprehensive view of how these dynamics are evolving, the gold-silver ratio insights available from recent market analysis highlight the degree to which silver remains historically undervalued relative to gold.
A price in the $60-70 per ounce range, while representing a significant correction from speculative highs, is still more profitable for established miners than almost any prior period in the industry's history. The important investor psychology point here is that a correction from a speculative spike does not invalidate the underlying thesis.
The Geopolitical Dimension: Energy Control as Strategic Outcome
How Disruption Benefits Domestic Producers
A nuanced observation about the strategic logic of energy market disruption is that direct control of a contested shipping corridor is not required for a major domestic energy producer to benefit from that corridor's instability. Even without achieving definitive control over the Strait of Hormuz, prolonged uncertainty about its safety and reliability redirects long-term energy contracting and capital investment toward more stable supply sources.
Infrastructure damaged during conflict takes years to rebuild. Trust broken between shipping companies and regional transit authorities takes longer. Risk premiums embedded in insurance and freight rates persist well beyond the cessation of active hostilities. Each of these effects benefits producers in the Western Hemisphere who can offer supply from routes that carry none of the same operational risk.
DOGE and the Limits of Fiscal Efficiency
The Department of Government Efficiency, which had been tasked with delivering $1 trillion in government savings by July 4th, 2026, was formally disbanded before reaching that target. The savings realised, while not publicly quantified in full, fell substantially short of the stated goal.
This outcome illustrates a structural reality about fiscal reform programmes: they can slow the rate of deficit accumulation at the margins, but they cannot reverse a debt trajectory driven by structural spending commitments, demographic obligations, and compounding interest costs. Efficiency programmes are discrete interventions operating against a continuously compounding mathematical process. However, the direction is not changed by cost-cutting initiatives of this scale alone.
Frequently Asked Questions
What is a US debt spiral and how does it start?
A US debt spiral begins when annual borrowing costs grow faster than economic output, forcing the government to issue new debt specifically to cover interest payments on existing debt. The cycle becomes self-reinforcing as higher yields attract less demand at Treasury auctions, requiring still higher yields to attract new buyers, which further increases the interest burden.
Why did Turkey sell its gold reserves in 2026?
Turkey sold gold reserves because it had largely exhausted its US Treasury holdings after an energy cost surge forced it to liquidate foreign reserves to fund domestic energy imports. Gold, as the next most liquid reserve asset, was monetised to meet emergency funding needs. The US debt spiral and Turkey selling gold reserves together illustrate how interconnected sovereign fiscal stress can rapidly become.
Does Turkey selling gold mean gold is a bad investment?
No. Turkey's gold liquidation demonstrates that gold performed exactly as intended: as a highly liquid reserve asset that can be rapidly converted to meet emergency funding requirements. The sale reflected currency and energy stress, not a loss of confidence in gold as a store of value.
How does the Strait of Hormuz closure affect US Treasury demand?
A Strait of Hormuz closure increases energy costs dramatically for oil-importing nations, forcing them to draw down foreign reserves to cover the funding gap. Those reserves are typically held in US Treasuries, so selling pressure on Treasuries increases, pushing secondary market prices down and effective yields up.
What is the difference between a Treasury yield and a Treasury price?
Treasury price and yield move inversely. When a Treasury bond is sold at a discount to face value on the secondary market, the fixed coupon payment represents a higher percentage of the lower purchase price, so the effective yield rises even though the nominal coupon is unchanged.
Why are central banks buying gold instead of US Treasuries?
Central banks are observing the long-term trajectory of US fiscal metrics, including rising deficits, compounding interest costs, and declining real purchasing power of dollar-denominated assets. Gold, which has preserved purchasing power over long periods while the dollar has lost approximately 88% of its purchasing power since 1971, is increasingly attractive as a reserve asset under this analytical framework.
Is silver undervalued compared to gold right now?
Silver has been in structural supply deficit for six consecutive years, with demand supported by both monetary and industrial applications across defence, medical, and technology sectors. High-quality silver producers are generating historically strong margins even at prices well below recent speculative peaks, suggesting the mining equities in particular may offer significant value relative to fundamentals.
What happens if a US Treasury auction fails?
A Treasury auction failure would mean insufficient demand at the offered yield, forcing the government to either offer higher rates (accelerating the debt spiral), cancel the auction (triggering a confidence crisis), or monetise the debt through central bank purchase (inflationary). Historical precedent suggests the inflationary option is the most politically sustainable.
How does inflation act as an alternative to sovereign default?
Inflation reduces the real value of outstanding debt over time, effectively transferring wealth from creditors to the debtor government. Unlike an explicit default, inflation distributes the adjustment gradually and provides political cover because its causes can be attributed to other factors. You can explore a detailed breakdown of this mechanism in this video analysis of sovereign debt dynamics.
Which countries are most at risk of being forced to sell US Treasuries?
Oil-importing emerging economies with limited domestic energy production, significant Treasury reserve portfolios, and weaker fiscal buffers are most exposed. Countries that depend on the global export oil market for 100% of their energy supply and hold their savings primarily in US dollar assets face the highest liquidation risk during energy market disruptions.
Key Indicators to Monitor
The Four Signals of Debt Spiral Acceleration
Investors and analysts tracking this theme should monitor Treasury auction bid-to-cover ratios for signs of weakening demand, the spread between secondary market yields and new issuance rates, the pace of central bank gold accumulation relative to Treasury holdings, and the pace of emerging market reserve drawdowns during energy or currency stress events.
| Risk Indicator | Current Status | Trend |
|---|---|---|
| US annual deficit | ~$2 trillion | Rising |
| Annual interest expense | ~$1 trillion | Accelerating |
| Debt-to-GDP ratio | ~100% | Projected 120% by 2036 |
| Central bank gold share of reserves | No. 1 by value | Increasing |
| Turkey gold reserves | Rebuilding (~730 tonnes, April 2026) | Recovering |
| Silver supply deficit | 6th consecutive year | Persistent |
| NATO defence budgets | Expanding | Upward pressure on silver demand |
Understanding the Long Cycle
Every dominant economic order in recorded history has eventually encountered the same structural constraint: the accumulation of debt obligations that exceed the capacity of the underlying economy to service them without either inflation or restructuring. Current US fiscal metrics are consistent with the intermediate stages of this pattern, where deficits are structural rather than cyclical, interest costs are compounding, and the foreign creditor base is beginning to diversify away from dollar-denominated assets.
Current events, whether energy crises, geopolitical conflicts, or fiscal reform programmes, may alter the pace of this trajectory. None of them change its direction. That distinction is the most important analytical framing for investors seeking to understand where we are in the cycle and what asset allocation it implies.
Disclaimer: This article is intended for informational and educational purposes only and does not constitute financial advice. All forward-looking projections, fiscal forecasts, and price references involve uncertainty and should not be relied upon as the basis for investment decisions. Readers should conduct their own research and consult qualified financial professionals before making any investment decisions. Past performance of any asset class is not indicative of future results.
Want to Track the Next Major Mineral Discovery Before the Market Does?
Discovery Alert's proprietary Discovery IQ model delivers real-time alerts on significant ASX mineral discoveries, turning complex geological and commodity data into actionable insights for investors at every experience level — start your 14-day free trial today and explore historic discoveries that have generated extraordinary returns to understand why being early to a major find can be transformative for a portfolio.