June 19, 2026
When Currency Becomes the Catalyst: Understanding the Dollar's Role in Global Markets
Most investors instinctively focus on earnings reports, interest rate decisions, or geopolitical headlines when trying to make sense of market moves. Yet one of the most powerful and least discussed drivers of asset prices sits quietly in the background: the directional trend of the US dollar. When the dollar shifts meaningfully, the ripple effects extend across equities, commodities, currencies, and fixed income simultaneously. In 2025, the US dollar impact on the ASX 200 and gold has become especially consequential, sitting at the centre of some of the most puzzling divergences seen in recent market history.
When big ASX news breaks, our subscribers know first
The DXY: One Index, Global Consequences
What the Dollar Index Actually Measures
The US Dollar Index, commonly referred to as the DXY, measures the greenback's value against a weighted basket of major global currencies. The euro carries the heaviest weighting, followed by the Japanese yen, British pound, Canadian dollar, Swedish krona, and Swiss franc. What makes the DXY particularly powerful as a macro signal is what it reveals about monetary policy divergence: when the central banks behind those currencies are cutting rates while the US Federal Reserve holds or tightens, the dollar strengthens mechanically as capital flows toward higher-yielding US assets.
In 2025, that divergence narrative has intensified. The Federal Reserve has signalled that the next rate move may be upward rather than downward, a position that stands in stark contrast to easing cycles underway or anticipated in several major economies. This policy gap is the structural fuel behind a potential explosive move in the DXY.
The Technical Setup That Has Analysts Paying Attention
From a purely technical perspective, the DXY has been consolidating for an extended period around a critical zone. The 101 level has functioned as both support and resistance for years, and the index is currently pressing up against that threshold alongside the 20-month moving average, a confluence that historically precedes significant directional moves.
Market analysts tracking range-based price behaviour note that the DXY has already tested its buy zone after a prolonged decline, formed a monthly buy pivot, and is now positioned at former resistance. In technical analysis, when a market revisits a level that previously acted as support and attempts to break through it, the potential for an accelerated move is considerably elevated. A sustained break above 101 would represent a meaningful shift with broad implications across the commodity and equity landscape.
A critical observation from market technicians: the DXY's point of control from its 2021–2022 major upswing sits just above current levels. A breakthrough of that zone could trigger a rapid repricing across gold, silver, oil, and risk assets globally.
How a Stronger Dollar Hits the ASX 200
The Commodity Price Transmission Channel
The ASX 200 is not a diversified index in the way that many global benchmarks are. It carries significant concentration in the materials and energy sectors, meaning commodity price movements translate directly into earnings revisions for a large portion of the index. Because commodities are priced globally in US dollars, a rising DXY compresses their USD-denominated prices, reducing revenues for miners and energy producers even if physical demand remains stable. Furthermore, understanding iron ore price trends is essential for gauging how these pressures flow through to ASX resource stocks.
- Commodities are globally priced in US dollars
- A rising dollar compresses commodity prices in USD terms
- The ASX 200 is heavily weighted toward materials and energy sectors
- Weaker commodity prices flow directly into earnings revisions for miners and energy companies
The AUD/USD Dynamic: A Double-Edged Sword
The Australian dollar's relationship with the US dollar adds a second layer of complexity. A weaker AUD means that Australian exporters receive more local currency for each unit of commodity sold, which partially cushions the blow for resource exporters. However, for domestically focused businesses, a weaker AUD raises input costs and compresses margins. According to analysis on how a lower USD affects Australian stocks, these currency dynamics can produce widely divergent outcomes across different segments of the local market.
| Market Segment | Impact of Stronger USD / Weaker AUD | Net Effect |
|---|---|---|
| ASX Resource Exporters | Higher AUD revenue per unit sold | Partially Positive |
| Domestic Retailers and Importers | Higher input costs, margin compression | Negative |
| Australian Banks | Tighter financial conditions, credit risk | Negative |
| Gold Miners (AUD-hedged) | Depends on spot gold vs. AUD move | Mixed |
| US-Dollar Earners on ASX | Revenue uplift in AUD terms | Positive |
Offshore Institutional Selling: The Hidden Mechanism
One of the more underappreciated dynamics behind recent ASX weakness is the role of offshore institutional selling. When the AUD weakens, foreign investors holding Australian equities see the USD value of their holdings decline even if Australian share prices remain stable. This creates an incentive to reduce Australian equity exposure, independent of any fundamental view on individual companies.
This mechanism helps explain a pattern that has emerged recently: US markets rallying strongly overnight while Australian futures sell off simultaneously. This kind of decoupling, where the ASX falls in a near straight line even as Wall Street surges multiple percentage points, is not typical of domestic-driven selling. It carries the hallmark of coordinated offshore liquidation, with futures markets used to establish short positions ahead of the regular session.
When the ASX drops sharply in overnight futures trading while US markets are simultaneously rising, it is often a signal worth investigating carefully. Offshore sellers operating with currency awareness can move the Australian market in ways that purely domestic analysis will fail to anticipate.
Why Does the ASX 200 Diverge Sharply From the S&P 500?
The ASX 200 and the S&P 500 share a general correlation over long periods, but that correlation can break down dramatically during episodes of currency dislocation, commodity price pressure, or domestic policy risk. In the current environment, all three factors are potentially in play simultaneously. Domestically, proposed changes to capital gains tax treatment have introduced uncertainty around property-related assets, lending activity, and bank credit growth, adding a layer of Australian-specific risk that foreign investors may be pricing in ahead of the broader market.
Gold and the Dollar: A Relationship Worth Understanding in Depth
The Inverse Correlation and Why It Exists
The inverse relationship between the US dollar and gold is one of the most consistently cited macro correlations in financial markets. Gold is priced globally in US dollars. When the dollar strengthens, the cost of buying gold rises for buyers holding other currencies, reducing international demand and exerting downward pressure on the price. This relationship has held across multiple market cycles and is a foundational consideration for any investor tracking the US dollar impact on the ASX 200 and gold. In addition, the broader gold-stock market relationship across secular cycles provides further context for how these dynamics compound over time.
- Gold is priced in US dollars globally
- A stronger dollar makes gold more expensive for non-US buyers
- Reduced international demand typically pushes the gold price lower
- The DXY and gold have maintained a well-documented inverse statistical relationship across decades
When Does the Inverse Relationship Break Down?
The correlation is real but not absolute. History offers several clear examples of both assets moving in the same direction simultaneously, and understanding why this happens is as important as understanding the baseline relationship.
| Scenario | Dollar Direction | Gold Direction | Why the Rule Breaks |
|---|---|---|---|
| Geopolitical Crisis / Safe Haven Flight | Rising | Rising | Both assets attract fear-driven capital |
| Central Bank Accumulation | Rising | Rising | Sovereign buying overrides currency effect |
| Falling Real Interest Rates | Falling | Rising | Real yield compression boosts gold's appeal |
| Stagflation Environment | Mixed | Rising | Inflation hedge demand dominates |
Real Yields: The Precision Driver Behind Gold's Price
While the DXY provides a useful headline signal, real yields offer a more precise lens for understanding gold's price behaviour. Real yields, calculated as nominal interest rates minus inflation expectations, determine the opportunity cost of holding gold. When real yields fall, the cost of holding a non-yielding asset like gold declines, making it relatively more attractive. When real yields rise alongside a strengthening dollar, gold faces a compounding headwind from two directions simultaneously.
US 10-year Treasury Inflation-Protected Securities (TIPS) yields are the most widely followed real yield indicator for this purpose. Investors tracking gold should monitor this figure alongside the DXY rather than relying on the nominal rate environment alone. The interplay between gold and bond markets in 2025 has reinforced just how critical real yields are as a pricing signal.
Key Price Levels and What a Dollar Spike Could Mean for Gold
Where Gold Stands Technically
Gold has experienced a significant multi-year bull run, creating a wide trading range with identifiable structural reference points. The $4,000 level represents a near-term threshold where failure to hold support could accelerate selling pressure. Below that, the $3,500 zone corresponds to the midpoint, or point of control, of the broader rally range, an area where sustained buying interest would be logically expected given the concentration of prior trading activity at that level.
From a range-based technical perspective, pullbacks to the midpoint of a major advance are common even within strong uptrends. The key distinction is whether a correction reflects genuine fundamental deterioration or is primarily a dollar-driven pricing compression. The former warrants reassessment of the bull thesis; the latter may represent an accumulation opportunity.
The Asymmetric Opportunity in Gold Equities During Corrections
Gold mining equities tend to amplify moves in the underlying metal. During sharp spot price declines, mining stocks frequently fall by a larger percentage than the metal itself, as investors price in margin compression, project viability uncertainty, and sector-wide sentiment deterioration. This overreaction dynamic, when it occurs in fundamentally sound producers, can create asymmetric entry points for disciplined investors.
An important nuance for ASX-listed gold miners is the currency effect. These companies generate revenue in US dollars but incur a significant portion of their costs in Australian dollars. Consequently, a weaker AUD during a period of dollar strength can partially, and in some cases fully, offset a declining USD gold price at the operating margin level. This built-in currency hedge makes Australian gold miners a structurally distinct investment proposition compared to gold producers reporting costs in USD.
Silver, Oil, and the Broader Commodities Complex Under Dollar Pressure
Silver's Compounded Vulnerability
Silver occupies a unique position in the commodities universe. Unlike gold, which derives the majority of its demand from investment and central bank activity, silver carries substantial industrial demand exposure. This dual identity means that during periods of dollar strength, silver faces simultaneous pressure from both its monetary and industrial components. The dynamics of silver versus gold during such cycles illustrate why silver tends to experience larger drawdowns than gold when the dollar strengthens meaningfully.
| Commodity | Primary Dollar Sensitivity | Secondary Risk Factor |
|---|---|---|
| Gold | High (inverse) | Real yields, central bank demand |
| Silver | High (inverse + industrial) | Manufacturing slowdown risk |
| Oil | Moderate (inverse) | OPEC+ supply policy, strategic reserves |
| Aluminium | Moderate | China demand, energy costs |
| Iron Ore | Moderate | China construction activity |
| Copper | High | Global growth expectations |
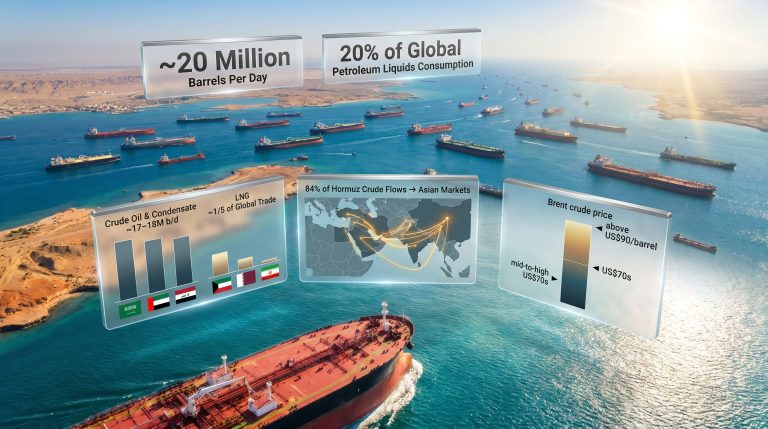
Oil: Why the Downside May Be More Limited Than It Appears
Oil has experienced a significant decline, but structural factors may provide a price floor that limits how far the market can fall. Strategic petroleum reserves globally were drawn down substantially during recent supply disruptions, and the process of rebuilding those reserves creates a baseline demand commitment that exists independently of economic growth. This refilling cycle is measured in months, not weeks, providing a sustained demand anchor beneath the market.
Beyond strategic reserves, countries that rationed oil consumption during peak supply stress may carry latent demand that normalises gradually as supply channels reopen. The combination of reserve rebuilding and demand recovery from previously constrained economies suggests a probable support range of approximately $70 to $90 per barrel over the near to medium term. This is a speculative projection and actual outcomes will depend on OPEC+ policy decisions, geopolitical developments, and global growth trajectories.
The next major ASX story will hit our subscribers first
Japan's Outsized Influence on Global Capital Flows
The Yen Carry Trade and Its Market-Wide Implications
Japan's monetary policy trajectory is a critical secondary variable that many commodity and equity investors underestimate. For decades, Japan maintained near-zero interest rates, making the yen an ideal funding currency for carry trades. Investors would borrow in yen at negligible cost and deploy that capital into higher-yielding assets globally, including Australian dollars, commodities, and equities.
When the Bank of Japan signals a policy shift, the consequences are rapid and far-reaching. Carry trade unwinds force simultaneous selling of the assets that were purchased with borrowed yen, creating sharp dislocations across multiple asset classes simultaneously. The AUD/JPY cross rate is particularly sensitive to this dynamic, making USD/JPY and AUD/JPY important leading indicators for ASX investors tracking commodity and equity risk.
A Coordinated Macro Dashboard for Currency-Aware Investors
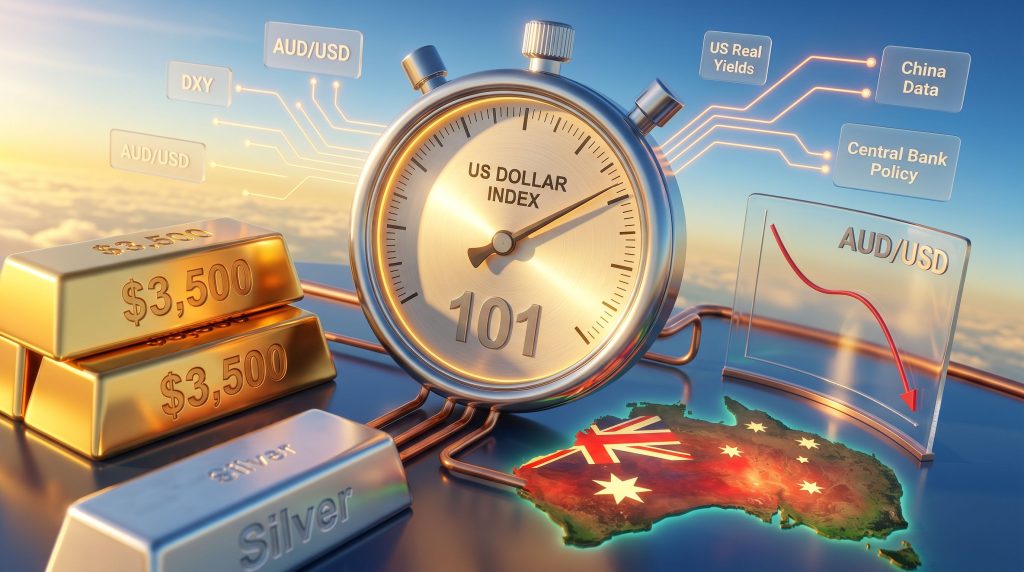
The Five Variables That Matter Most
No single indicator is sufficient to navigate the current macro environment. The interaction between the following variables, assessed together rather than in isolation, provides a more complete picture of directional risk:
- DXY trend and key breakout levels – the primary macro signal for commodity and risk asset direction
- AUD/USD exchange rate – the direct transmission mechanism for ASX equity exposure
- US real yields (10-year TIPS) – the most precise single driver of gold pricing
- China economic and manufacturing data – the dominant demand variable for Australian commodity exports, with the outlook for China steel and iron ore remaining a key indicator for the year ahead
- Global central bank policy divergence – the structural engine behind sustained dollar strength or weakness
Reading the Signals as a Combined Framework
- DXY breaking above resistance combined with rising real yields signals a headwind for gold and ASX materials sectors
- DXY weakening alongside falling real yields creates a tailwind for gold and AUD-denominated assets
- DXY rising with a falling AUD and declining commodity prices puts the ASX resource sector under coordinated pressure
- Central bank gold accumulation during a rising DXY period may signal the inverse correlation breaking down, a historically significant development
Portfolio Positioning During a Dollar Strengthening Cycle
For investors holding significant ASX equity exposure during a period of potential dollar strength, several practical considerations are worth examining:
- Partial portfolio hedging using inverse ASX exchange-traded funds can reduce downside exposure without requiring complete liquidation of long positions
- Monitoring the ratio of USD-earning ASX companies versus domestically focused names can help identify relative value within the index
- Evaluating gold miner valuations against spot prices during sharp corrections may reveal asymmetric entry opportunities when sentiment reaches extremes
- Defined risk parameters and position sizing discipline matter more than directional conviction during periods of elevated macro uncertainty
The ability to identify a thesis is only half the equation. Acting on it at the right price level, with appropriate sizing, is what separates disciplined investors from those who are right directionally but still lose money on the trade.
Frequently Asked Questions: US Dollar, ASX 200, and Gold
Does a stronger US dollar always push the ASX 200 lower?
Not universally, but it creates meaningful pressure on the resource-heavy components of the index. ASX companies with significant USD-denominated revenues can benefit from a weaker Australian dollar, partially offsetting broader index headwinds. The net impact depends on sector composition and the magnitude of the currency move.
Why does gold typically fall when the US dollar rises?
Gold is priced globally in US dollars. When the dollar strengthens, buyers using other currencies face a higher effective price for gold, which reduces demand and exerts downward price pressure. The relationship is well-established but not absolute, breaking down during geopolitical crises or periods of aggressive central bank accumulation.
What DXY level should investors watch most carefully in 2025?
The 101 level has historically acted as a significant inflection point on the DXY. A sustained break above this threshold, particularly if accompanied by a decisive move through the 20-month moving average, would represent a meaningful technical development with broad implications for commodities, the AUD, and risk assets globally.
How does the Australian dollar specifically affect ASX gold miners?
ASX-listed gold miners earn revenue in US dollars through the gold price but incur a large portion of operating costs in Australian dollars. A weaker AUD therefore improves operating margins even when the USD gold price declines, providing a natural partial hedge against dollar strength. This makes Australian gold producers structurally different from their international peers when assessing the net impact of dollar moves.
Is oil likely to collapse if the US dollar continues rising?
Dollar strength creates headwinds for oil, but structural demand factors, including strategic petroleum reserve rebuilding and latent demand recovery from previously supply-constrained economies, may limit the downside. A support range of approximately $70 to $90 per barrel appears plausible given these dynamics, though this remains a speculative projection subject to significant uncertainty depending on OPEC+ policy and global growth outcomes.
Key Takeaways
- The US dollar impact on the ASX 200 and gold is the single most important macro variable for understanding divergences between Australian and US equity markets in 2025
- Dollar strength transmits through three compounding channels: commodity price compression, AUD weakness, and offshore institutional selling of Australian equities
- Gold and the dollar maintain a well-documented inverse relationship, though this can break down under specific conditions including geopolitical stress and central bank gold accumulation
- Silver faces compounded risk during dollar strengthening cycles due to its dual sensitivity to both monetary and industrial demand dynamics
- Japan's monetary policy trajectory and the yen carry trade represent a critical secondary risk variable that extends well beyond Japanese assets
- Real yields, not nominal interest rates alone, are the most precise pricing driver for gold and should be monitored alongside the DXY
- Dollar-driven corrections in gold and gold equities have historically created asymmetric buying opportunities for patient, disciplined investors with defined risk parameters
This article contains forward-looking statements, technical analysis observations, and speculative projections regarding commodity prices, exchange rates, and equity market behaviour. These perspectives are provided for informational and educational purposes only and do not constitute financial advice. Past correlations between asset classes do not guarantee future outcomes. Investors should conduct their own research and consult a licensed financial adviser before making investment decisions.
Want to Capitalise on the Next Major ASX Mineral Discovery Before the Broader Market?
Discovery Alert's proprietary Discovery IQ model delivers real-time alerts on significant ASX mineral discoveries, instantly transforming complex mineral data into actionable insights for both short-term traders and long-term investors — explore historic examples of major discovery returns to understand the opportunity, then begin your 14-day free trial at Discovery Alert to position yourself ahead of the market.