July 14, 2026
When Geopolitical Shocks Invert Market Logic: Understanding the Metals Paradox
Most investors carry a simple mental model: conflict escalates, gold rises. It is a framework reinforced by decades of market commentary and superficially supported by historical data. Yet the US-Iran ceasefire collapse metals prices reaction on July 8, 2026 delivered a sharp lesson in why that model is dangerously incomplete. Rather than triggering a flight to safety, the breakdown set off a chain reaction that sent gold, silver, platinum, palladium, and copper all lower simultaneously, while a single base metal moved in the opposite direction for entirely different structural reasons.
Understanding why this happened, and what it signals for the months ahead, requires moving beyond the safe-haven narrative and into the mechanics of how oil shocks transmit through inflation expectations, central bank policy, and ultimately into metals pricing. For context, gold safe-haven dynamics have historically been far more nuanced than mainstream commentary suggests.
When big ASX news breaks, our subscribers know first
The Three-Variable Transmission Model That Overrides Safe-Haven Logic
The conventional wisdom that war drives precious metals higher is only accurate under a specific subset of conflict conditions, namely those where fear dominates without generating a significant energy price shock. When oil surges sharply, the transmission mechanism shifts entirely, and the chain that follows is both predictable and damaging for non-yielding assets.
The sequence operates through three interlocking variables:
-
Crude oil spikes on conflict risk — In this case, Brent crude surged more than 5% following the ceasefire collapse, driven by Iran's Revolutionary Guard striking US military installations in Bahrain and Kuwait and the subsequent withdrawal of Iran's crude export licence by Washington. The crude oil price trends leading into this event had already established a volatile baseline.
-
Inflation expectations re-accelerate — A sustained oil price rise feeds directly into headline consumer price index projections, which market participants immediately reprice into forward inflation curves.
-
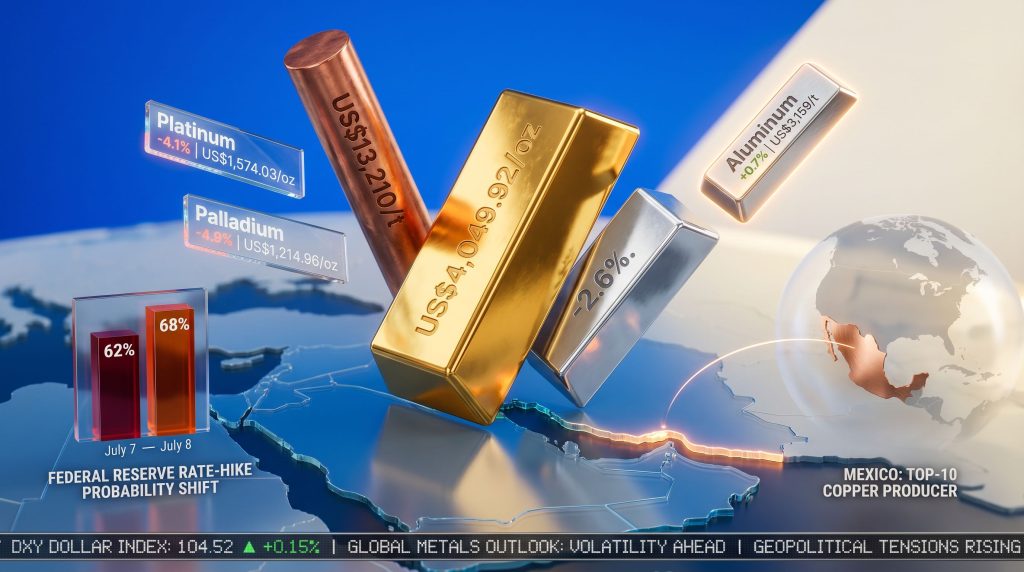
Federal Reserve rate-hike probability rises — As inflation expectations climb, traders reassign probability weights to upcoming Fed decisions. On July 8, the probability of a September rate hike moved from 62% to 68% in a single session, according to CME FedWatch data.
The net effect of this chain is a stronger US dollar and a higher real yield environment, both of which are structurally hostile to gold and silver. Since gold generates no income, every basis point increase in real yields raises the opportunity cost of holding it relative to Treasury instruments. The dollar's concurrent strength also compresses gold's price in international markets by making it more expensive for foreign buyers.
The counterintuitive outcome of the ceasefire collapse is not an anomaly. It is the predictable result of an oil-driven inflation shock activating the rate-hike transmission mechanism, which consistently overrides traditional safe-haven demand when the shock is large enough and sustained enough to alter Fed expectations.
Cross-Metal Price Reactions: July 8, 2026
The breadth of the selloff across the metals complex on July 8 was striking. The table below captures the full scope of price movements and their primary drivers.
| Metal | Exchange | Price Movement | Price Level | Key Driver |
|---|---|---|---|---|
| Gold (spot) | LBMA/Spot | -1.4% | US$4,049.92/oz | Rate hike expectations |
| Gold (futures) | COMEX | -2.3% | US$4,059.80/oz | Dollar strength |
| Silver (spot) | Spot | -2.6% | US$58.45/oz | Rate + industrial demand |
| Platinum | Spot | -4.1% | US$1,574.03/oz | Automotive demand concerns |
| Palladium | Spot | -4.9% | US$1,214.96/oz | Automotive sector risk-off |
| Copper (LME) | LME | -1.2% | US$13,210/t | Growth demand destruction |
| Copper (futures) | COMEX | -2.1% | US$6.10/lb | Policy + supply uncertainty |
| Aluminum (LME) | LME | +0.7% | US$3,159/t | Gulf smelter disruption risk |
| Zinc | LME | -1.0% | US$3,538/t | Risk-off sentiment |
| Tin | LME | -0.9% | US$52,890/t | Industrial demand proxy |
| Lead | LME | +0.3% | US$1,890/t | Defensive positioning |
| Nickel | LME | +0.3% | US$16,390/t | Supply constraint premium |
| Brent Crude | ICE | +5%+ | — | Direct conflict premium |
Why Silver Fell Nearly Twice as Hard as Gold
Silver's steeper decline relative to gold — 2.6% versus 1.4% — is not a pricing anomaly. It reflects the metal's dual identity as both a monetary asset and an industrial input. When a geopolitical shock simultaneously triggers rate-hike fears and growth-demand pessimism, silver absorbs pressure from both directions at once, creating an amplified response that gold does not experience to the same degree.
Furthermore, the magnitude of the reversal is illuminated by comparing where prices had been. According to reporting on gold and silver impacts, precious metals had already been navigating considerable macro headwinds. When the original ceasefire was announced, gold approached US$4,800 per ounce and silver climbed toward US$77 per ounce. The subsequent collapse unwound those war premiums with equal force in the opposite direction, confirming that markets had been pricing diplomatic outcomes in binary terms throughout the conflict cycle.
The Aluminum Anomaly: One Metal That Defied the Selloff
While virtually every other metal declined, aluminum on the LME rose 0.7% to US$3,159/t, with China's Shanghai Futures Exchange contract climbing a matching 0.7% to CNY23,075/t. The reason is structural rather than speculative.
The Gulf region accounts for approximately 9% of global aluminum smelting capacity. Renewed hostilities raise the probability of production disruption at those facilities, creating a supply-side premium that, for aluminum specifically, outweighs the demand-destruction concerns dragging other base metals lower.
This dynamic is further amplified by the context of aluminum's prior pricing: the metal shed 16% in June 2026, its worst monthly performance since the 2008 financial crisis, as ceasefire optimism caused traders to aggressively unwind the war premium. Consequently, the ceasefire collapse partially restored that premium in a single session.
Federal Reserve Policy and Its Role in the Metals Shock
The rate expectations mechanism is the critical variable that investors often underweight when modelling conflict scenarios. Giovanni Staunovo, analyst at UBS, has noted that while gold retains its identity as an inflation hedge over long time horizons, the deployment of higher interest rates as the policy tool to contain that inflation acts as a near-term structural headwind. The distinction matters enormously for position sizing and tactical allocation.
The scenario comparison below illustrates how different conflict environments produce different gold responses, depending on which market force is dominant.
| Conflict Scenario Type | Gold Response | Key Differentiator |
|---|---|---|
| Pure geopolitical fear, no oil shock | Rises | Safe-haven demand dominates |
| Oil-driven inflation shock | Falls | Rate-hike expectations dominate |
| Deflationary war shock | Rises | Real yield compression |
| Ceasefire or resolution | Falls initially, then stabilises | War premium unwinds |
| Ceasefire collapse with oil spike | Falls sharply | Inflation plus rate mechanism activated |
The July 8 event fits squarely into the fifth scenario. With Fed minutes scheduled for release later that session, markets were acutely sensitive to any signal that policymakers might accelerate tightening in response to an oil-driven inflation resurgence. That sensitivity amplified the intraday moves across the precious metals complex.
Featured Insight: Gold falls during oil-driven geopolitical shocks not because safety demand disappears, but because markets anticipate that central banks will raise rates to suppress the resulting inflation, increasing gold's opportunity cost and strengthening the dollar simultaneously. Both forces work against non-yielding assets in tandem.
Copper's Strategic Vulnerability: Supply Chains, Sulfuric Acid, and the Hormuz Risk
Copper's position within this conflict cycle is more complex than a simple demand-destruction story. The metal had already experienced extreme volatility throughout 2026, reaching a COMEX record of US$6.69 per pound in May, with LME copper trading near US$14,200/t, close to the all-time high of US$14,500/t set in January. By July 8, COMEX had retreated to US$6.10/lb and LME to US$13,210/t.
Goldman Sachs estimated copper's fair value at US$11,100/t, suggesting the metal was still trading at a meaningful premium even after the selloff. In addition, the copper market trends heading into this period had already flagged significant structural vulnerabilities. The bank's scenario framework for conflict duration provides the clearest pricing guide available for the remainder of 2026.
| Conflict Duration Scenario | Projected Price Range | Market Condition | Producer Margin Estimate |
|---|---|---|---|
| Rapid resolution | ~US$12,000/t | Modest supply deficit restored | ~70% (near 2025 levels) |
| Multi-month conflict | US$10,500–US$11,500/t | Market moves toward equilibrium | ~40% (compressed) |
| Prolonged or escalating | Below US$10,500/t | Demand destruction dominates | Sub-40% |
The Sulfuric Acid Supply Chain: A Lesser-Known Vulnerability
One of the less widely understood dimensions of copper's exposure to Middle East conflict involves processing chemistry rather than direct shipping routes. Approximately one-fifth of globally mined copper relies on sulfuric acid as a processing input, particularly in heap leach operations used extensively across Latin America.
The Gulf region plays a significant role in global sulfur shipment networks, meaning that any closure or sustained disruption to the Strait of Hormuz would affect copper producers' ability to source this critical reagent. The copper supply risks associated with geopolitical disruption had, in fact, been building well before the ceasefire collapse materialised.
Analysts have estimated that a Hormuz closure could place as much as 4.8 million tonnes of annual copper production at risk through this supply chain channel, a figure that represents a meaningful share of global refined copper output. Production cost escalation under conflict conditions is estimated at 10% to 20% per unit, with the burden falling disproportionately on smaller and less efficient producers operating closer to the cost curve.
The Two-Sided Trade: Why Copper Positioning Is Structurally Volatile
Investors face a genuinely difficult analytical challenge with copper in a prolonged conflict environment. Supply disruption from Hormuz closure is price-supportive. Demand destruction from slowing global industrial activity is price-negative.
Historical multi-quarter conflict cycles suggest that demand destruction has typically won when the conflict extends beyond six months, but the sulfuric acid supply chain risk introduces an asymmetric upside scenario that is not present in most other base metal markets.
Ole Hansen, Head of Commodity Strategy at Saxo Bank, has identified the central market question as distinguishing between geopolitical rhetoric and genuine supply-chain escalation. Markets were pricing an intermediate scenario on July 8, neither full escalation nor rapid resolution, which explains the measured rather than catastrophic price moves observed across the industrial metals complex.
Mexico's Mining Sector: Earnings at a Crossroads
Mexico's position as one of the world's top ten copper producers by volume means that the conflict's ultimate resolution will carry direct financial consequences for the country's mining industry. The baseline for comparison is a strong one: Mexico's largest copper producer reported net earnings of US$1.43 billion in Q4 2025, supported by a 22% increase in copper prices alongside gains across silver and gold.
The earnings sensitivity arithmetic under Goldman Sachs's conflict scenarios is sobering. At 2025 margin levels of approximately 70%, a 10% production cost increase compresses margins to roughly 60%. Under the multi-month conflict scenario with prices at US$10,500/t to US$11,500/t combined with a 20% cost increase, margins could fall to approximately 40%, representing a near-halving of profitability from the prior year's high-water mark.
Margin Compression Risk: For copper producers whose operations sit near the industry cost curve, a simultaneous decline in copper prices and a rise in energy-linked input costs represents the most damaging possible scenario. Producers with hedging programmes, vertically integrated acid supply, or diversified revenue streams across multiple metals are structurally better positioned to absorb extended conflict periods.
The next major ASX story will hit our subscribers first
Five Indicators to Monitor as the US-Iran Conflict Evolves
For investors seeking to track the metals market implications of the US-Iran situation, these five leading indicators provide the most actionable signal set:
- CME FedWatch September Rate Probability — Crossing the 70% threshold would signal accelerating headwinds for gold and silver specifically.
- Brent Crude Daily Settlement — Sustained prices above US$90 per barrel amplify the inflation transmission mechanism and extend pressure on industrial metals demand.
- DXY (US Dollar Index) — Dollar strength above key technical resistance levels compounds the pricing pressure on all dollar-denominated metals through the international purchasing power channel.
- Strait of Hormuz Shipping Reports — Any confirmed disruption to tanker or bulk carrier traffic would trigger immediate supply-side repricing across aluminum, copper, and energy-linked metals.
- LME Aluminum Inventory Levels — Declining exchange stocks combined with ongoing Gulf smelter risk would validate and extend the aluminum supply premium observed on July 8.
Resolution Scenarios: Which Metals Recover Fastest?
The resolution pathway matters as much as the conflict itself for portfolio positioning. A confirmed and durable peace agreement would produce differentiated outcomes across the metals complex:
- Aluminum would experience the sharpest immediate reversal, as Gulf smelters returning to full operation would rapidly eliminate the supply disruption premium that drove the metal's July 8 advance.
- Gold and silver would benefit from the removal of rate-hike pressure if oil retreats meaningfully, though the recovery magnitude depends critically on whether the Federal Reserve has already moved rates higher during the conflict period.
- Copper would likely see the strongest structural recovery over the medium term, as both the supply disruption premium and the demand-destruction discount would simultaneously unwind, potentially returning prices toward the US$12,000/t range modelled under Goldman Sachs's rapid-resolution scenario.
- Platinum and palladium recoveries would be tied primarily to automotive sector confidence returning, given that industrial demand from vehicle catalytic converter manufacturing is the dominant price driver for both metals.
Summary Risk Matrix: Key Metals in a Conflict-Extended Environment
| Metal | Conflict-Extension Risk | Resolution Upside | Primary Sensitivity |
|---|---|---|---|
| Gold | Moderate downside | Strong upside | Fed rate trajectory |
| Silver | High downside | Strong upside | Rate + industrial demand |
| Copper | High downside | Strong upside | Growth + Hormuz supply |
| Aluminum | Moderate upside | Sharp downside | Gulf smelter capacity |
| Platinum | High downside | Moderate upside | Automotive demand |
| Palladium | Very high downside | Moderate upside | Automotive + rate sensitivity |
| Nickel | Slight upside | Neutral | Supply constraint premium |
The US-Iran ceasefire collapse and metals prices story is ultimately a lesson in transmission mechanisms rather than simple conflict logic. However, investors who understand the oil-inflation-rate chain will be better positioned to distinguish between scenarios where conflict drives metals higher and those where it does the opposite. Precious metals fell sharply on July 8 in precisely the manner this framework predicts, reinforcing that in 2026, the rate-hike transmission model has repeatedly proven to be the more relevant analytical lens.
Disclaimer: This article contains forward-looking analysis, scenario modelling, and financial projections drawn from third-party research. These do not constitute investment advice. All price data and probability figures referenced reflect market conditions as reported on July 8, 2026. Past market behaviour during geopolitical events is not a reliable indicator of future outcomes. Readers should conduct their own due diligence before making any investment decisions.
Want to Stay Ahead of ASX Mineral Discoveries Before the Broader Market Reacts?
While understanding geopolitical transmission mechanisms is critical for metals investors, Discovery Alert's proprietary Discovery IQ model delivers real-time alerts on significant ASX mineral discoveries — cutting through macro complexity to surface actionable opportunities the moment they emerge. Explore how historic mineral discoveries have generated substantial returns and begin your 14-day free trial today to position yourself ahead of the market.