June 28, 2026
Commodity Markets at a Crossroads: How Diplomatic Shifts Reshape the Metals Landscape
Geopolitical inflection points rarely deliver clean outcomes for commodity investors. History shows that when major conflicts de-escalate, the instinct to apply a uniform bullish or bearish lens across the entire metals complex almost always proves costly. Different metals carry different risk architectures, different supply chain vulnerabilities, and different sensitivities to the macroeconomic variables that geopolitical events either amplify or suppress. Understanding this asymmetry is not just academically interesting — it is the foundation of navigating the US-Iran deal impact on metals complex dynamics with any degree of precision.
The memorandum of understanding digitally signed between the United States and Iran on June 17, 2026 represents exactly this kind of structurally ambiguous moment. It is neither a clean resolution nor a continuation of open conflict. It sits in a probabilistic middle ground that forces each commodity to be evaluated on its own merits, rather than through the simple lens of risk-on or risk-off.
When big ASX news breaks, our subscribers know first
The Architecture of Asymmetric Metal Responses
Why Peace Does Not Uniformly Lift Commodity Prices
To understand why the metals complex is fracturing rather than moving in a single direction, it helps to distinguish between two fundamentally different types of price support: geopolitical risk premiums and genuine demand-side or supply-side fundamentals.
Geopolitical risk premiums are essentially insurance embedded in prices. When conflict threatens supply routes or production capacity, buyers and traders price in the possibility of disruption. When that threat recedes, so does the premium, regardless of underlying demand. Metals that accumulated significant conflict-related premiums are now unwinding those gains as diplomatic progress registers in the market.
Demand-side fundamentals, by contrast, are driven by industrial activity, economic growth expectations, and structural consumption trends. These do not reset when a peace deal is signed. They respond to GDP trajectories, manufacturing indices, energy transition spending, and monetary policy. This is precisely why the current environment is producing divergent outcomes across aluminium, copper, gold, silver, and rare earths.
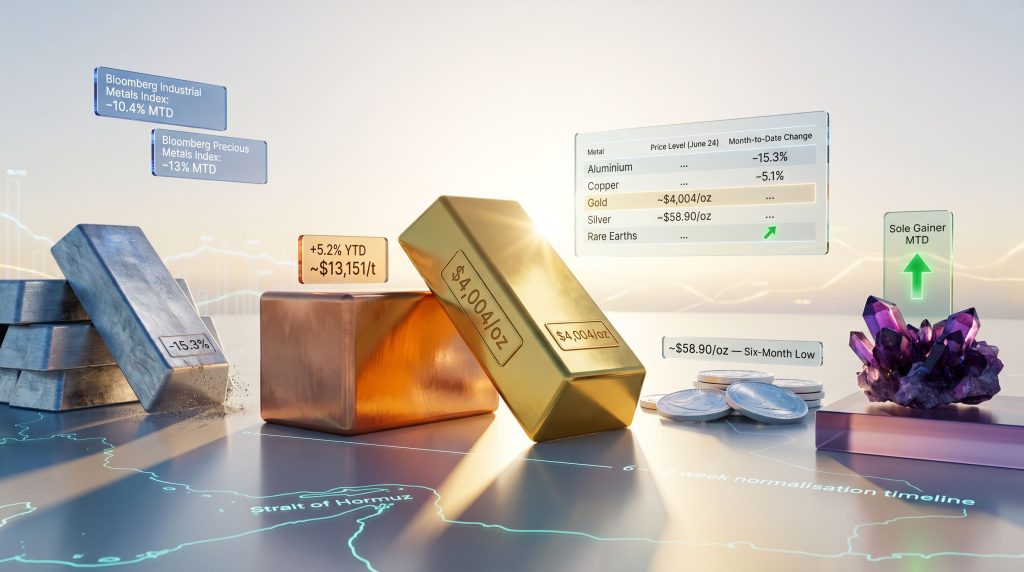
The Bloomberg Industrial Metals Index captured this tension clearly, falling 10.4% month-to-date as of June 24, 2026, and sitting 1.4% lower than it was in late February. Furthermore, the Bloomberg Precious Metals Index experienced an even sharper correction, declining 13% month-to-date and 27.2% since the onset of the conflict. These are not the numbers of a market celebrating peace. They reflect a complex repricing in which risk premiums are being stripped out faster than underlying fundamentals can compensate. Tariffs and commodity markets are adding another layer of complexity to this already fragmented repricing environment.
The Strait of Hormuz: Chokepoint Economics
No single variable governs the pace of commodity market adjustment more directly than the timeline for normalising shipping through the Strait of Hormuz. This narrow waterway, roughly 33 kilometres wide at its narrowest navigable point, handles an estimated 20% of global oil and a significant share of industrial commodity flows transiting between the Persian Gulf and global markets.
The expectation embedded in current market pricing is that shipping flows could take 6 to 12 weeks to return to pre-conflict levels following the MoU. This lag matters enormously. It means that deal optimism is running ahead of physical supply relief, creating a window in which prices can overshoot to the downside before actual supply improvements materialise.
What makes this particularly treacherous is the state of global inventories. Years of supply chain stress and conflict-related disruptions have left inventory buffers across multiple commodity categories at depleted levels. A faster-than-expected third-quarter supply uplift would paradoxically increase market vulnerability to any future disruptions by removing the buffer that would otherwise absorb a demand shock or a renewed supply interruption.
Probability-Weighted Geopolitical Scenarios
Fitch Solutions unit BMI has structured its outlook around three distinct geopolitical pathways, each carrying different implications for the metals complex:
| Scenario | Probability | Key Features | Metals Implication |
|---|---|---|---|
| Smooth Implementation | ~45% | Hormuz normalises in 6-12 weeks; deal progresses to final status | Aluminium stabilises; copper targets $14,500-$15,000/t; gold recovers toward $4,600/oz |
| Messy Negotiations | ~40% | MoU violations occur; talks continue in degraded form | Supply normalisation stalls; aluminium partially recovers conflict premiums; rare earths outperform |
| Full Breakdown | ~15% | Talks collapse; conflict re-emerges | Aluminium surges; gold and silver recover sharply; oil spikes; Fed positioning complicated |
The 40% probability assigned to the Messy Negotiations scenario is the figure that commodity traders should be treating as their primary risk management benchmark. It is high enough to prevent any single directional bet from being made with high confidence, and it explains why markets are not simply selling off uniformly or rallying uniformly, but instead producing the fragmented, metal-specific price action currently visible. According to Bloomberg, base metals briefly advanced as the US touted progress toward the peace deal, illustrating just how sensitive markets have been to even incremental diplomatic signals.
Metal-by-Metal Performance Analysis
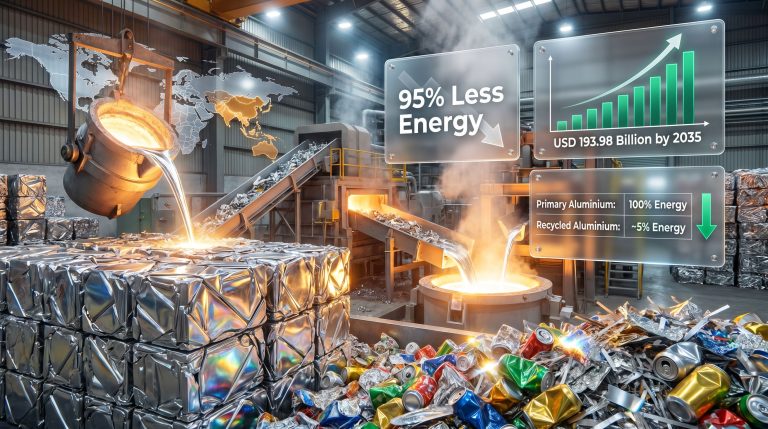
Aluminium: The Most Exposed Industrial Metal
No metal in the complex has a more direct line of exposure to the US-Iran agreement than aluminium. The conflict had previously removed an estimated 2.3 million tonnes of production capacity from global markets, equivalent to 3.2% of total global output, through disruptions to Gulf smelting operations. The Middle East accounts for roughly 9% of global aluminium smelting capacity, a share large enough to materially tighten global supply balances when taken offline.
By June 24, 2026, aluminium had retreated 15.3% month-to-date, trading around $3,161 per tonne, having largely surrendered the war-induced price gains it had accumulated. The market is effectively pricing in the expectation of supply recovery before that recovery has physically occurred.
The critical nuance here is the restoration timeline. BMI had already flagged, prior to the deal announcement, that offline Gulf smelting capacity was unlikely to normalise before H2 2027 at the earliest. Restarting an aluminium smelter is not a simple process. The technology involved — specifically the Hall-Heroult electrolytic reduction cells used to produce primary aluminium — degrades when taken offline. Cathode blocks and potlining materials can suffer irreversible damage during cold shutdowns, sometimes requiring complete relining before production can resume.
Despite the headline price correction, BMI expects an aluminium supply deficit to persist through 2026, which places a structural floor under prices even as the conflict premium deflates.
Key Risk: If negotiations deteriorate into the Messy Negotiations scenario (40% probability), aluminium could rapidly reclaim a portion of its lost ground as supply restoration expectations unwind.
Copper: Structural Tightness Persists Through Macro Headwinds
Copper's performance through June 2026 has been more resilient than aluminium, though not immune to the broader correction. The metal traded in the $13,400 to $13,500 per tonne range in early June before retreating to approximately $13,151 per tonne by June 24, a 5.1% month-to-date decline. On a year-to-date basis, copper remains 5.2% higher, reflecting underlying supply tightness that predates and persists beyond the geopolitical disruption.
A less widely discussed driver of copper's price support is the sulphuric acid supply chain dynamic. Sulphuric acid is a critical byproduct of copper smelting and is simultaneously essential to various copper ore processing operations, particularly for oxide ores processed through heap leaching and solvent extraction-electrowinning (SX-EW) circuits. When smelting operations are disrupted, sulphuric acid availability tightens, creating a cascading effect on downstream copper processing capacity.
The medium-term bullish case, with LME copper price targets of $14,500 to $15,000 per tonne cited by some analysts, remains conditional on a meaningful improvement in global growth sentiment. Understanding the crude oil price drivers at play is equally important, as energy costs feed directly into copper's processing economics.
Gold: From Conflict Hedge to Fed Policy Battleground
Gold's price trajectory through June 2026 illustrates the transition from geopolitical asset to monetary policy barometer. The metal built steady upward momentum from June 11 before reversing sharply from June 16, retreating to approximately $4,004 per ounce by June 24.
Two forces are acting simultaneously on the gold price:
- Conflict risk premium deflation — as the MoU reduces the probability of sustained Middle East conflict, the inflation risk and supply shock premium that had supported gold begins to unwind
- Federal Reserve tightening expectations — rising rate-hike bets and a strengthening US dollar create headwinds independent of the geopolitical backdrop
BMI's base case is that the US Federal Reserve will maintain a prolonged hold through 2026, with no rate movements anticipated this year. As conflict-related inflation pressures fade following the US-Iran agreement, this prolonged hold scenario becomes the dominant pricing framework for gold. The broader gold price forecast context reinforces why many analysts see the pullback toward $4,004 per ounce as temporary within a structurally supported longer-term trend.
BMI maintains its full-year 2026 average gold forecast at $4,600 per ounce, with some analysts projecting gold reaching $5,000 per ounce by year-end under favourable macro conditions.
Silver: Navigating a Dual Identity
Silver fell to a six-month low of approximately $58.90 per ounce by June 24, tracking gold's decline under the weight of the same macro headwinds. The Bloomberg Precious Metals Index confirmed the broader precious metals weakness, down 13% month-to-date and 27.2% since the start of the conflict.
What makes silver's situation analytically distinctive is silver's dual role as both a monetary metal and an industrial commodity. Unlike gold, which derives the majority of its demand from investment and central bank purchasing, silver has significant industrial consumption across:
- Solar photovoltaic panels, where silver paste is used in cell manufacturing
- Electric vehicle components, including battery management systems and charging infrastructure
- Consumer electronics, including semiconductors and printed circuit boards
- Medical applications, leveraging silver's antimicrobial properties
This industrial dimension means silver has a potential recovery pathway that gold does not share in quite the same way. Bullish analyst projections for silver range between $80 and $95 per ounce by year-end under favourable macro scenarios.
Rare Earths: The Outlier That Defies the Sell-Off
Praseodymium-neodymium (PrNd) oxide represents the most analytically distinctive corner of the metals complex in June 2026. While every other major metal tracked by BMI recorded month-to-date losses, PrNd oxide prices rose throughout the month, making rare earths the sole positive performer within the complex on a month-to-date basis.
Understanding this divergence requires appreciating the unique pricing logic that governs rare earth elements. Unlike copper or aluminium, where prices are primarily driven by industrial supply and demand balances, rare earth pricing is deeply intertwined with their role as instruments of geopolitical leverage. China's rare earth restrictions have fundamentally altered the pricing framework for these materials, creating a dynamic where strategic value can support prices independently of near-term industrial demand fluctuations.
PrNd oxide is the critical input for neodymium-iron-boron (NdFeB) permanent magnets, which are integral to the high-torque motors used in electric vehicles, the generators used in wind turbines, and precision-guided weapons systems. China controls an estimated 85–90% of global rare earth processing capacity, a concentration that creates structural supply vulnerability for consuming nations that no single diplomatic agreement can resolve.
Oil Prices and the Energy-Commodity Feedback Loop
Why Energy Costs Are Central to the Metals Equation
As of June 25, 2026, Brent futures front-month contracts traded at approximately $72.50 per barrel, while Dated Brent was at approximately $85.50 per barrel, both significantly below where BMI had expected prices to sit at this stage of the US-Iran peace process.
BMI's current annual average forecasts stand at $81.50 per barrel for Brent futures and $88 per barrel for Dated Brent for 2026, with revisions anticipated following June's price action.
The energy-metals feedback loop operates through several channels:
- Lower energy costs reduce smelting and processing expenses across the metals complex, particularly for aluminium, which is among the most energy-intensive metals to produce
- However, depressed oil prices also signal reduced expectations for global economic activity, which is a bearish signal for industrial metals demand
- Lower oil prices reduce inflationary pressure, which in turn reduces the urgency of Federal Reserve rate increases, potentially softening the US dollar over the medium term
- A softer dollar provides a supporting tailwind for gold, silver, and other commodities priced in US dollars
The net effect of these competing forces is far from straightforward. BMI warns that with global inventories heavily depleted, a stronger-than-expected third-quarter supply uplift through the Strait of Hormuz would leave markets acutely exposed to any future supply disruptions, potentially amplifying price volatility rather than dampening it.
Five Structural Risks Facing the Metals Complex in H2 2026
Investors navigating the post-MoU environment should be tracking the following risk factors with particular attention:
- Negotiation Fragility: The 40% probability assigned to the Messy Negotiations scenario means deal-related optimism cannot be treated as a bankable assumption for commodity market positioning
- Inventory Vulnerability: Depleted global inventories across multiple commodity categories mean that any renewed supply disruption, even a minor one, could trigger outsized and rapid price spikes
- Federal Reserve Policy Uncertainty: Despite BMI's base case of a prolonged hold, any surprise rate movement would materially reprice gold, silver, and risk assets broadly
- Tariff Escalation Risk: Ongoing tariff tensions, particularly those affecting copper, represent an independent source of market volatility that the US-Iran agreement does not address
- Capacity Restoration Lag: Gulf aluminium smelting capacity is not expected to fully normalise until H2 2027, meaning supply tightness persists even under the most optimistic diplomatic scenario
Mining Weekly's analysis of the BMI report further underscores that the US-Iran deal impact on metals complex outcomes will vary considerably depending on which commodity and which supply chain dimension is being evaluated.
Frequently Asked Questions
What metals are most directly affected by the US-Iran agreement?
Aluminium carries the most direct supply-side exposure, having lost an estimated 2.3 million tonnes of production capacity, representing 3.2% of global output, through Gulf smelting disruptions. Gold and silver face immediate pressure from the deflation of conflict-related risk premiums. Rare earths are the notable exception, continuing to appreciate due to structural supply tightness and their strategic geopolitical utility.
Is the current gold correction a buying opportunity?
BMI's full-year 2026 average forecast of $4,600 per ounce sits meaningfully above the June 24 level of approximately $4,004 per ounce, implying the current pullback is viewed as cyclical rather than structural. The trajectory from here will be governed primarily by Federal Reserve signalling rather than geopolitical developments. Note: This does not constitute financial advice. Investors should conduct independent research before making investment decisions.
How long before metals markets fully reprice the deal?
The 6 to 12 week Strait of Hormuz normalisation timeline provides the most concrete guide to the pace of physical supply adjustment. Full market repricing will depend on whether the MoU advances toward a final-status agreement, with the 40% Messy Negotiations probability keeping uncertainty elevated through at least Q3 2026.
Why do rare earths continue rising while other metals sell off?
Rare earth pricing is governed by a different logic to industrial metals. The strategic value of PrNd oxide and related materials in EV motors, wind turbines, and defence systems creates a floor that is reinforced by geopolitical leverage dynamics rather than simply supply and demand balances. China's dominant position in rare earth processing, controlling an estimated 85–90% of global capacity, means that supply security concerns persist independently of any bilateral diplomatic development.
The next major ASX story will hit our subscribers first
Navigating the Divergence: Key Takeaways
The US-Iran deal impact on metals complex dynamics is best understood not as a single directional force but as a structural catalyst for divergence. Each metal is responding to a distinct combination of supply relief, risk premium deflation, macroeconomic sensitivity, and strategic positioning.
| Metal | Current Level (June 24) | MTD Change | Key Driver | Primary Risk |
|---|---|---|---|---|
| Aluminium | ~$3,161/t | -15.3% | Gulf supply restoration expectations | Negotiation breakdown reclaims premiums |
| Copper | ~$13,151/t | -5.1% | Structural tightness, sulphuric acid constraints | Tariff escalation, macro headwinds |
| Gold | ~$4,004/oz | Sharp reversal from June 16 | Fed tightening bets, USD strength | Prolonged hold delays recovery |
| Silver | ~$58.90/oz | Six-month low | Macro headwinds dominate | Dual identity creates volatile swings |
| Rare Earths (PrNd) | Rising | Sole MTD gainer | Geopolitical weaponisation, structural tightness | China policy shifts |
- Aluminium retains a supply-deficit floor despite its headline correction; full capacity restoration remains a 2027 story
- Copper holds structural support from sulphuric acid dynamics and supply tightness; tariff risks dominate the near-term
- Gold is in a Federal Reserve-driven repricing phase; the $4,600 per ounce annual average forecast implies recovery from current levels
- Silver offers a potentially rewarding medium-term setup if industrial demand tailwinds from energy transition spending materialise
- Rare earths remain the standout performer, driven by forces that transcend the bilateral US-Iran narrative entirely
- Oil's trajectory through the Strait of Hormuz remains the master variable governing the pace of the broader commodity complex recovery
Disclaimer: This article is intended for informational purposes only and does not constitute financial or investment advice. All forecasts and price targets referenced represent analyst estimates and carry inherent uncertainty. Readers should conduct independent research and seek professional financial advice before making any investment decisions. Forward-looking statements involve risks and assumptions that may not materialise as expected.
Want to Stay Ahead of the Next Major Mineral Discovery Before the Market Catches On?
While geopolitical shifts reshape commodity prices across aluminium, copper, gold, silver, and rare earths, Discovery Alert's proprietary Discovery IQ model continuously scans ASX announcements in real time, instantly identifying significant mineral discoveries and translating complex data into actionable investment insights — explore historic discoveries and their remarkable returns, then begin your 14-day free trial at Discovery Alert to position yourself ahead of the broader market.