August 11, 2026
The Architecture of a Global Oil Shock: Understanding the Hormuz Risk Premium
When geopolitical fault lines fracture along energy transit corridors, the consequences rarely stay contained within the conflict zone. The mechanics of how US-Iran strikes Strait of Hormuz oil prices move in tandem reveal a deeply interconnected system — one where a narrow waterway carries consequences far outweighing its physical dimensions. Understanding how that transmission mechanism works is increasingly essential for investors, energy traders, and policymakers navigating one of the most volatile commodity environments in recent memory.
When big ASX news breaks, our subscribers know first
Why 33 Kilometres Can Move Global Markets
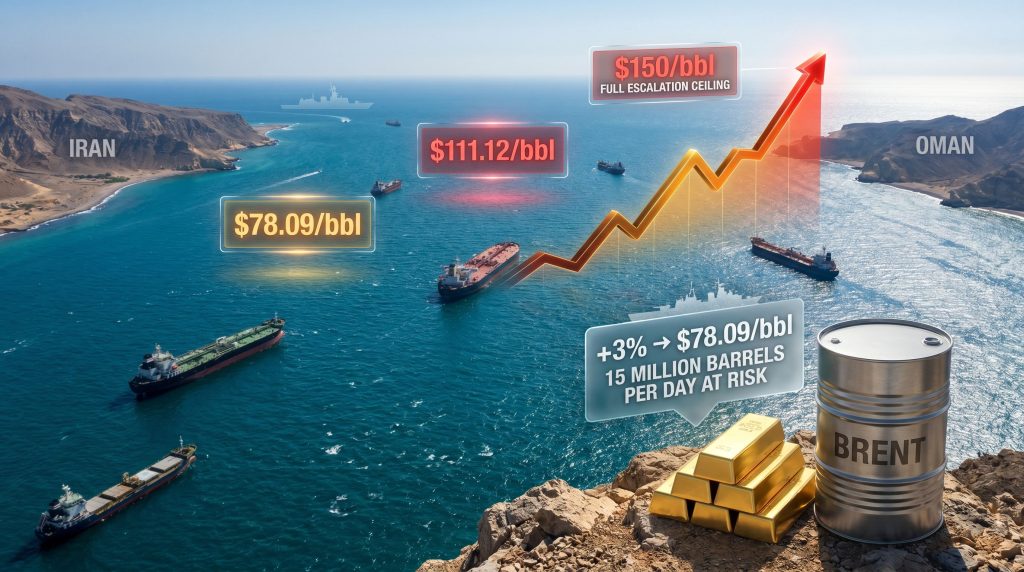
The Strait of Hormuz occupies a unique position in global energy infrastructure. Measuring roughly 33 kilometres at its narrowest navigable point, this passage between Iran and Oman carries approximately 20% of all globally traded oil, equivalent to around 15 million barrels per day. No comparable alternative exists for Persian Gulf producers. Unlike land-based pipeline networks, which can theoretically be expanded or rerouted over time, maritime chokepoints cannot be engineered around on short notice.
The physics of alternative routing compound the problem significantly. Redirecting tankers via the Cape of Good Hope adds several weeks to delivery timelines and substantially increases freight costs — effects that flow directly through to end-user pricing even before considering insurance adjustments or supply uncertainty premiums.
What makes the Hormuz situation structurally distinct from most other geopolitical risks is the absence of a credible bypass at scale. While Saudi Arabia maintains the East-West Pipeline capable of carrying around 5 million barrels per day to the Red Sea, and the UAE operates the Abu Dhabi Crude Oil Pipeline with capacity of roughly 1.5 million barrels per day, these combined alternatives cover less than half the normal Hormuz throughput. In a full disruption scenario, the arithmetic of global supply rapidly deteriorates.
The geopolitical oil price drivers at play here are not new, but the current cycle has intensified their impact to a degree not seen in recent years.
Mapping the Escalation Cycle: Price Volatility Through the Conflict Timeline
The pattern of US-Iran military exchanges throughout 2025 and 2026 has produced a distinctive oil price oscillation, with each escalation inserting a fresh war premium and each diplomatic signal temporarily unwinding it. The following table illustrates how Brent crude has responded across key conflict milestones:
| Period | Trigger Event | Brent Crude Response |
|---|---|---|
| May 2026 | US strikes on Iranian facilities threatening shipping | +2.0% to approximately $96.28/bbl |
| June 2026 | Continued exchanges; doubts over strait reopening | +0.9% to approximately $73.21/bbl |
| Late June 2026 | Conditional ceasefire; partial strait reopening | -13.0% to approximately $94.80/bbl |
| Early July 2026 | Iran claims missile strike on US Navy vessel | +2.82% to approximately $111.12/bbl |
| July 13, 2026 | Fresh US-Iran strikes; conflicting statements on strait status | +3.0% to approximately $78.09/bbl |
The price corridor between ceasefire-driven relief and active-conflict peaks — spanning roughly $73 to $111 per barrel across this cycle — quantifies the scale of the war premium currently embedded in global crude benchmarks.
As of July 13, 2026, oil market disruption risks were fully reflected in benchmark pricing, with Brent crude trading at approximately $78.09 per barrel, up close to 3%, while West Texas Intermediate was around $73.31 per barrel, up roughly 2.8%, according to market data reported by ET EnergyWorld. The previous week had already seen Brent gain 5.4%, with the instrument briefly trading above $79 per barrel before the fresh round of strike activity reintroduced pricing uncertainty.
The War Premium Mechanics That Most Coverage Misses
A war premium is not a fixed surcharge applied uniformly across conflict periods. It is a dynamic, probability-weighted calculation reflecting traders' real-time assessment of disruption risk. Furthermore, several technical dimensions of how this premium operates are frequently overlooked:
- Asymmetric pricing behaviour: Markets price in disruption risk faster than they price out resolution. This means a ceasefire can remove a war premium over several days, but a new exchange of strikes can reinstate it within hours.
- Liquidity conditions amplify swings: During periods of binary uncertainty, bid-ask spreads widen and institutional traders reduce position sizes, making the market more susceptible to outsized moves on relatively thin volume.
- Conflicting official statements create compounding uncertainty: When US and Iranian authorities issue contradictory assessments of whether the strait remains open to commercial shipping, traders cannot efficiently price partial closure. Any ambiguity around passage safety triggers precautionary buying that can overshoot the true supply risk.
- Historical war premium range: During prior US-Iran escalation cycles, the geopolitical premium has historically ranged between $5 and $25 per barrel, depending on the credibility of the disruption threat and the availability of strategic petroleum reserve buffers.
According to analysis from domestic brokerage firm Nirmal Bang, the uncertainty generated by conflicting statements from both sides is reinserting a war premium into crude prices that had previously been erased following the interim ceasefire agreement.
The Shadow Closure: How Tanker Insurance Amplifies Price Shocks
One of the least-discussed mechanisms through which Hormuz risk transmits into global oil prices operates not through barrels blocked, but through economics made prohibitive. War-risk insurance premiums for tankers transiting the strait have surged to more than ten times their normal baseline rates during the July 2026 escalation period.
This creates what analysts sometimes refer to as a shadow closure. The strait may remain physically navigable, but when insurance costs make the voyage economically unviable for operators, the effective outcome for global supply is nearly identical to a formal blockade. Cargo owners, charterers, and tanker operators all face the same calculus: the cost of transit exceeds the margin available from delivery.
When tanker insurance markets seize up, the strait's physical accessibility becomes largely irrelevant. Commercial shipping responds to economics before it responds to diplomatic communiques.
This dynamic also explains why price responses sometimes appear disproportionate to actual physical disruption. A small reduction in tanker traffic, combined with elevated uncertainty, can trigger supply tightening in futures markets well before any crude actually fails to reach its destination.
Cross-Asset Contagion: Gold, Base Metals, and the Rate Feedback Loop
The US-Iran strikes Strait of Hormuz oil prices story does not stop at crude oil. The transmission into other asset classes follows a logic that is worth tracing carefully, particularly for investors managing diversified portfolios.
Gold and Silver: When Safe-Haven Logic Breaks Down
Conventional investor intuition positions gold as a primary beneficiary during geopolitical conflict. However, the current cycle challenges that assumption through a powerful countervailing mechanism. Higher energy prices driven by Hormuz disruption feed directly into headline consumer price inflation, which in turn raises market expectations that the US Federal Reserve will maintain or extend its rate-hiking cycle.
Since gold and silver generate no yield, rising interest rates make yield-bearing alternatives comparatively more attractive, suppressing precious metals prices even as conflict intensity increases. The gold safe-haven dynamics that normally support precious metals during conflict are, consequently, being overridden by monetary policy expectations. Gold was heading for a weekly loss as investors assessed the dual impact of renewed fighting in West Asia and the broader implications for monetary policy.
The key insight here is that the inflation-rate channel is currently overriding the safe-haven demand channel for precious metals. This is not a permanent condition, but it represents the dominant pricing dynamic as long as the Federal Reserve's response function remains inflation-focused.
Base Metals: Infrastructure Recovery and Copper's Resilience
The base metals complex has shown more nuanced behaviour. Aluminium dropped approximately 1.9% to settle at $3,139.50 per tonne on the London Metal Exchange following the announcement by Emirates Global Aluminium that it had restarted a key alumina processing facility in Abu Dhabi. This is a direct illustration of how infrastructure recovery events can rapidly reverse commodity price spikes driven by supply-side disruption.
In addition, copper market trends have shown notable resilience, with the metal recording a second consecutive weekly advance despite the broader headwinds facing industrial commodities. This reflects a market weighing longer-term structural demand fundamentals, particularly around electrification and grid infrastructure investment, against near-term geopolitical risk. However, Nirmal Bang's analysis includes a specific warning: a return to full-scale conflict and extended Hormuz disruption would curb global economic growth, ultimately compressing industrial demand and threatening copper's recent outperformance.
The next major ASX story will hit our subscribers first
Scenario Analysis: Three Pathways for Oil Prices
Scenario 1: Negotiated Resolution and Strait Reopening
Under a credible diplomatic resolution, Brent crude would be expected to retreat toward the $70 to $75 per barrel range as the war premium dissipates. However, market normalisation would require months rather than weeks. Infrastructure damage, accumulated production disruption, and the need to rebuild tanker operator confidence mean that even a formal reopening would not immediately restore pre-conflict supply economics.
Scenario 2: Sustained Ceasefire With Intermittent Violations
This represents the most probable near-term path, with Brent likely consolidating between $78 and $95 per barrel. Each military incident triggers short-term spikes while each diplomatic signal produces partial retreats. Elevated volatility in this scenario creates significant hedging demand and supports derivatives market activity, benefiting energy traders while creating planning challenges for fuel-dependent industries.
Scenario 3: Full-Scale Escalation and Extended Strait Closure
Analyst projections place the price ceiling in this scenario at approximately $150 per barrel. The downstream consequences extend well beyond energy costs:
- Global recession risk increases materially as energy-intensive industries absorb severe cost shocks
- Central banks face a stagflationary dilemma between tightening to combat energy-driven inflation and easing to support deteriorating growth
- Strategic petroleum reserve capacity across IEA member nations would face material depletion within an estimated 60 to 90 days of full strait closure
- Copper and other industrial metals would eventually reverse recent gains as demand destruction offsets supply-side support
The Fed as the Secondary Market Driver
The Fed inflation outlook functions as the second most important variable in the current commodity pricing environment, after the conflict itself. Energy price shocks transmit directly into headline CPI, creating pressure on central banks even as rate hikes risk dampening the economic activity that sustains commodity demand.
Market participants are closely monitoring US macroeconomic data releases as the primary near-term signal for the Fed's policy direction, with energy price trajectory feeding directly into that calculus. Until clarity emerges, crude oil is expected to retain geopolitical support as a price floor, while gold remains under pressure from rate expectations.
This creates a distinctive investment environment: energy assets are supported by geopolitical risk premium, while precious metals face a structural headwind from the same geopolitical risk through its inflationary transmission into monetary policy.
Downstream Exposure: Fuel Retailers and Administered Pricing Markets
An underappreciated dimension of sustained crude price elevation involves downstream energy retailers operating within price-regulated markets. Across several Asian economies, retail fuel prices are partially administered, meaning the gap between market-rate crude and regulated pump prices creates structural losses that accumulate on retailer balance sheets.
At sustained crude prices above $90 to $95 per barrel, these losses become material enough to require either government-mandated price adjustments or explicit fiscal intervention. Furthermore, the current conflict cycle is bringing this pressure to a head across multiple markets simultaneously, with fuel retailers effectively absorbing a subsidy cost designed for a lower-oil-price environment.
Frequently Asked Questions
What happens to oil prices if the Strait of Hormuz closes?
A full strait closure would remove approximately 15 million barrels per day from accessible global supply. Analyst projections point to prices potentially reaching $150 per barrel under a sustained blockade, with significant secondary effects on inflation, interest rates, and global economic growth. Strategic petroleum reserves represent the primary short-term buffer, though their finite capacity constrains the duration of any effective price suppression.
Why did oil prices drop sharply after the June 2026 ceasefire?
The conditional ceasefire announcement in late June 2026 reduced the immediate geopolitical risk premium embedded in crude benchmarks, triggering a decline of approximately 13% to around $94.80 per barrel. Market participants unwound precautionary long positions as shipping lanes were partially reopened and the probability of imminent full disruption receded.
Why is gold underperforming during an active military conflict?
While conflict typically supports gold through safe-haven demand, higher energy prices are simultaneously increasing inflation expectations and raising the probability of Federal Reserve rate hikes. Since gold generates no yield, rising rates reduce its relative attractiveness compared to yield-bearing instruments, and that headwind is currently the dominant pricing force for the precious metal.
How long would oil markets take to normalise after a strait reopening?
Even after a formal reopening, analysts expect normalisation to require months rather than weeks, given accumulated infrastructure damage, halted production restart timelines, and the need for tanker insurance markets to return to commercially viable rates before operators restore normal transit volumes. The dynamics around US-Iran strikes Strait of Hormuz oil prices suggest that market confidence rebuilds far more slowly than it deteriorates.
This article is for informational purposes only and does not constitute financial or investment advice. Commodity price projections and scenario analyses involve significant uncertainty. Past price behaviour during geopolitical events does not guarantee future outcomes. Readers should conduct independent research and consult qualified financial advisers before making investment decisions.
Want to Stay Ahead of the Next Major Commodity Market Shift?
Discovery Alert's proprietary Discovery IQ model scans ASX announcements in real time, delivering instant alerts on significant mineral discoveries across more than 30 commodities — turning complex market signals into clear, actionable opportunities for both short-term traders and long-term investors. Explore how major discoveries have historically generated substantial returns on Discovery Alert's dedicated discoveries page, and begin your 14-day free trial today to position yourself ahead of the market.