June 15, 2026
The Geopolitical Risk Premium: Why Oil Markets Price in War Before It Happens
Commodity markets do not wait for confirmed events. They price probabilities, scenarios, and expectations long before any official announcement lands. Nowhere is this dynamic more visible than in crude oil, where the concept of the geopolitical risk premium sits at the core of how energy assets are valued during periods of international conflict.
When a major oil-producing region faces genuine supply disruption risk, traders build a buffer into crude benchmarks that reflects the probability-weighted cost of that disruption materialising. This premium can persist for months, quietly embedded in prices even when physical supply remains uninterrupted. The unwinding of that premium, when diplomatic resolution becomes credible, can be just as violent as its original insertion.
That is precisely what global energy markets experienced following the announcement of a U.S.-Iran peace framework in mid-June 2026. The U.S.-Iran peace deal and oil prices became inseparable narratives almost immediately, with crude benchmarks reacting sharply to diplomatic headlines.
When big ASX news breaks, our subscribers know first
What Drove the Sudden Drop in Oil Prices
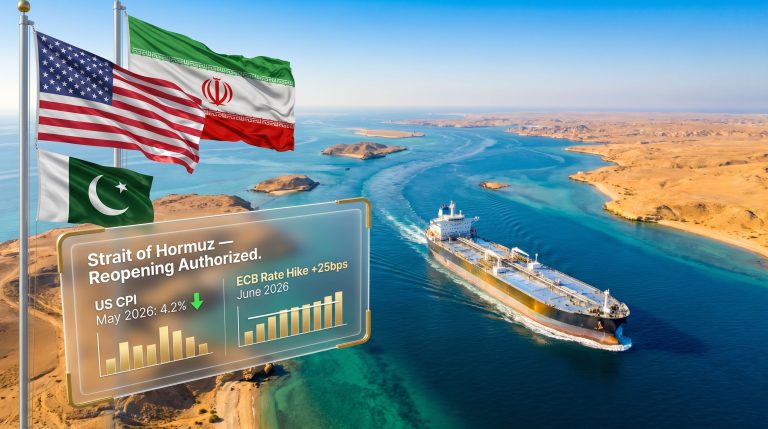
The Strait of Hormuz and the Architecture of Global Supply Risk
To understand why a diplomatic headline produced a 4-5% single-session price move in crude oil, it is necessary to understand what was actually at stake throughout the approximately four-month U.S.-Iran conflict. The geopolitical oil price drivers at play here were among the most consequential in recent energy market history.
The Strait of Hormuz is the world's most consequential maritime chokepoint for energy trade. Estimates from the U.S. Energy Information Administration consistently place daily transit volumes at between 17 and 21 million barrels of crude oil and petroleum products, representing roughly 20% of global petroleum liquids moving through a corridor just 33 kilometres wide at its narrowest navigable point.
When that corridor faces credible disruption risk from naval conflict, mining operations, or blockade, the entire global oil supply chain reprices. Saudi Arabia, the UAE, Iraq, Kuwait, and Iran itself all depend on Strait transit to varying degrees. A sustained closure would represent an immediate, unambiguous supply shock with no short-term substitute route capable of absorbing full volume.
The confirmation that the Strait would reopen and the U.S. naval blockade would be lifted triggered an immediate and rational repricing of that risk away from crude benchmarks.
The Numbers Behind the Market Reaction
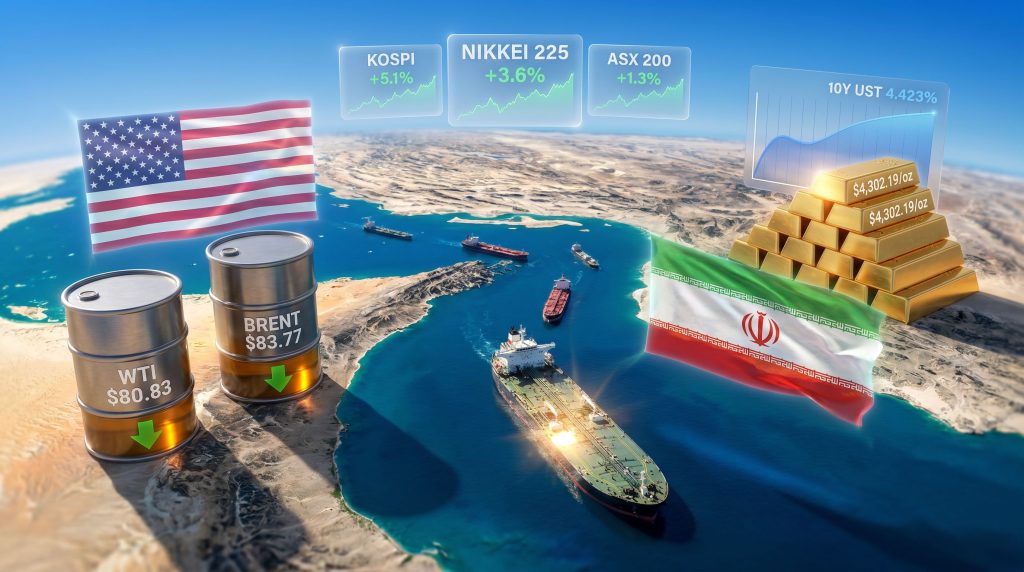
The price moves were sharp and decisive:
- WTI crude (July delivery) fell 4.77% to settle near $80.83 per barrel
- Brent crude (August delivery), the internationally dominant benchmark, dropped approximately 4% to $83.77 per barrel
- The U.S. dollar index weakened 0.32% to 99.483
- The 10-year U.S. Treasury yield fell 5 basis points to 4.423%
- Spot gold rose approximately 2% to $4,302.19 per ounce
Key Insight: The oil price decline is not driven by a change in physical supply. It reflects a repricing of expected supply risk. This distinction matters enormously for investors assessing whether the price move is durable or whether it represents premature optimism that could reverse sharply.
Is the U.S.-Iran Peace Deal Actually Finalised?
The Gap Between Announcement and Implementation
One of the most important nuances in this market event is the difference between a peace framework being announced and being signed, ratified, and implemented. As of mid-June 2026, the agreement remained unsigned, with formal signing anticipated around June 19. According to Al Jazeera, markets moved aggressively on expectation rather than confirmation, a historically dangerous position for energy assets.
Investment strategists at Global X ETFs observed that the most immediate implication of the announcement was a repricing of the inflation risk premium that markets had been carrying since the Strait's closure, with oil serving as the sharpest mover but the bond market providing the more structurally informative signal.
The remaining implementation uncertainties include several genuinely complex issues:
- Sanctions relief scope and timeline: The breadth of U.S. sanctions removal on Iranian oil exports, and how quickly relief flows through to actual barrel production and shipping, remains unresolved.
- Frozen asset negotiations: Access to Iranian sovereign funds held in foreign jurisdictions is a politically sensitive component of the deal framework that could stall ratification.
- Nuclear program constraints: Limits on uranium enrichment capacity were flagged as a precondition for full normalisation, adding technical complexity to an already fragile diplomatic process.
- Infrastructure damage assessment: Physical damage to Iranian refining and port infrastructure means even a signed deal does not produce immediate supply restoration.
Risk Warning: Analysts have cautioned that thin deal details and implementation uncertainty leave energy markets exposed to rapid reversals. A breakdown in ratification could push Brent back above $90 per barrel within sessions, rapidly reversing the risk premium unwind.
Historical Precedent: When Oil Markets Got Ahead of Diplomacy
This dynamic, where oil prices move sharply on geopolitical resolution expectations before implementation is confirmed, has precedent across multiple cycles. Furthermore, the global trade war impact of recent years has similarly conditioned markets to reprice aggressively on headline announcements before details are confirmed.
| Event | Initial Price Spike | Reversal Trigger | Approximate Timeframe |
|---|---|---|---|
| Gulf War I (1990-91) | +100% | Ceasefire confirmation | ~7 months |
| Iran Nuclear Deal (2015) | -20% | Phased sanctions relief | ~12 months |
| Russia-Ukraine (2022) | +40% | Demand destruction | ~6 months |
| U.S.-Iran Conflict (2026) | Estimated premium | Peace framework | Ongoing |
The 2015 Iran nuclear deal is particularly instructive. Oil prices fell significantly on the framework announcement, but the phased nature of sanctions relief meant the full supply impact took over a year to materialise. Investors who treated the announcement as equivalent to physical supply restoration experienced a more complex price trajectory than initial reactions suggested.
How the Strait of Hormuz Recovery Timeline Works
Why Reopening Is Not the Same as Normalising
A common misconception in media coverage of strait closures is that reopening equals immediate flow restoration. The physical reality is considerably more complex, and this gap has direct implications for how quickly the oil price decline can be sustained.
Analysts at Commonwealth Bank of Australia project Brent settling near $80 per barrel by year-end, but this forecast is explicitly conditional on several factors progressing without further disruption:
- The Strait remaining open and free from naval contestation
- Iranian export volumes recovering to approximately 60-70% of pre-conflict levels
- Refining infrastructure repairs advancing at a meaningful pace
- Sea mine clearance operations completing without incident
The sea mine dimension is particularly underappreciated in mainstream market commentary. Modern naval mines can remain active and dangerous for extended periods after conflict cessation. Clearance operations require specialised vessels, take considerable time, and create ongoing shipping insurance complications even in areas declared partially safe.
Tanker insurance premiums, which escalated dramatically during the conflict period, will not normalise immediately upon a peace announcement. Underwriters require sustained evidence of safe transit before repricing war risk insurance, meaning tanker operators face elevated operating costs even if the Strait is technically reopened.
CBA Research Assessment: Markets may not need full supply restoration to price in a surplus. A recovery to 60-70% of pre-war Iranian export capacity could be sufficient to shift the global supply-demand balance back into surplus territory, providing the foundation for sustained lower crude prices through the second half of 2026.
What Cheaper Oil Means for Inflation and Central Banks
The Transmission Mechanism from Crude to Consumer Prices
Oil's influence on consumer price inflation operates through multiple simultaneous channels, which is why energy price movements attract such concentrated attention from monetary policymakers.
Energy costs are embedded in transportation, agriculture, manufacturing, and utilities. A sustained 4-5% decline in crude prices typically flows through to retail fuel prices within 4-8 weeks, reducing headline CPI pressure directly. Beyond direct fuel costs, lower crude prices reduce the input cost burden for manufacturers, logistics operators, and agricultural producers, applying secondary downward pressure on producer price indices.
For central banks navigating policy decisions in mid-2026, the timing of the oil price decline carried particular significance. Major monetary authorities were entering a concentrated cycle of policy meetings, and the prospect of easing energy prices reduced the probability of additional restrictive guidance or rate increases.
The bond market reaction confirmed this interpretation. A 5 basis point decline in the 10-year U.S. Treasury yield to 4.423% alongside equity gains is a configuration that signals reduced inflation expectations, not just improved risk sentiment. When both bonds and equities rally simultaneously on the same news, the market is communicating that it views the development as disinflationary rather than merely risk-positive.
Strategic Framing: The bond market's reaction is arguably more informative than the oil price move itself. Falling yields alongside rising equities confirm that institutional investors were not pricing in a permanent inflationary regime change. They were unwinding a temporary geopolitical hedge, treating the energy shock throughout the conflict as transitory rather than structural.
How Global Equity Markets Responded to the Peace Framework
Asian Markets Led the Risk-On Repricing
Asian equity markets produced the strongest initial reactions, reflecting the region's structural sensitivity to oil import costs.
| Index | Single-Session Move |
|---|---|
| South Korea Kospi | +5.1% |
| Japan Nikkei 225 | +3.6% |
| Japan Topix | +2.6% |
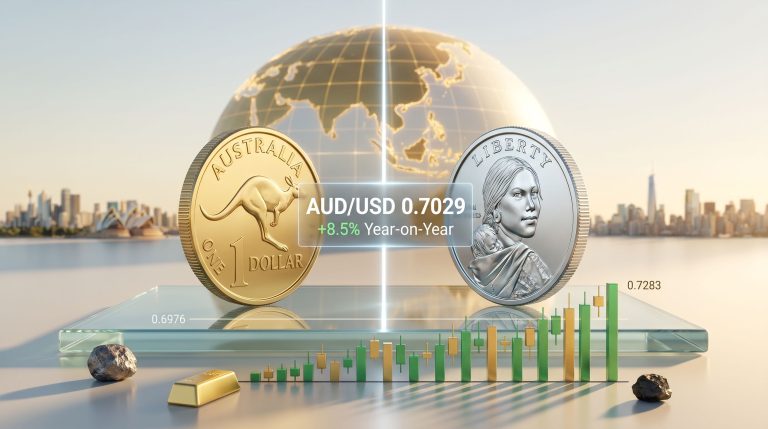
| Australia S&P/ASX 200 | +1.3% |
Japan, South Korea, and Australia are among the world's largest net crude importers. Energy cost relief directly improves their current account dynamics, reduces import bills, and lifts corporate margins in energy-intensive manufacturing and export industries. The magnitude of the Kospi move, in particular, reflects South Korea's concentrated exposure through its petrochemical and refining industries, which had faced severe margin compression during the conflict period.
Sector-Level Winners and Losers
Not all sectors benefit equally from a crude price decline driven by geopolitical resolution. Understanding the directional asymmetry across sectors is critical for portfolio repositioning.
| Sector | Expected Directional Impact | Core Rationale |
|---|---|---|
| Upstream Oil and Gas | Negative | Revenue compression on lower realised prices |
| Airlines and Transport | Positive | Fuel cost reduction improves operating margins |
| Consumer Discretionary | Positive | Household energy savings redirect to spending |
| Defence and Aerospace | Mixed/Negative | Reduced conflict-driven procurement cycle |
| Industrials | Positive | Lower input costs improve margin structure |
| Gold and Precious Metals | Uncertain | Partial geopolitical premium retention |
The next major ASX story will hit our subscribers first
Why Gold Is Holding Firm Despite a Risk-On Environment
The $4,300 Signal: What It Reveals About Market Confidence
Spot gold rising approximately 2% to $4,302.19 per ounce on the same session that risk assets rallied strongly is not consistent with a textbook risk-on environment. In a clean geopolitical resolution, gold typically sells off as the safe-haven premium unwinds and capital rotates into equities and risk assets. However, the gold safe-haven demand dynamic appears more entrenched than simple risk-on rotation would suggest.
Gold's resilience alongside rising equities and falling bond yields creates what technical analysts describe as a split-signal market structure. Historically, this configuration appears when institutional investors are running a hedged position across two competing scenarios simultaneously. In addition, the broader gold and bond volatility environment of recent years has trained sophisticated allocators to maintain defensive positions even during apparent risk-on episodes.
Investment strategists at Global X ETFs noted that gold holding near $4,300 while equities rallied strongly suggested the market was not fully trusting the durability of the peace deal. Rather than a straightforward risk-on rotation, sophisticated institutional money appeared to be running a barbell strategy: allocating to equities on deal optimism while retaining gold and Treasuries as insurance against deal failure or implementation breakdown.
This is a sophisticated but rational market response given the implementation risks outlined above. The asymmetry of outcomes justifies a hedged approach.
Scenario Modelling: Three Paths for Crude in H2 2026
Scenario 1: Full Implementation (Base Case)
The Strait reopens fully, Iranian exports recover toward 70% of pre-war levels, and sanctions negotiations proceed without major setbacks. Under this trajectory, Brent is expected to settle in the $78-$85 per barrel range by Q4 2026. Central banks gain meaningful flexibility to hold or ease policy. Equity markets extend gains across energy-importing economies.
Scenario 2: Partial Implementation or Stalled Ratification
The June 19 signing is delayed, or sanctions negotiations collapse on scope disagreements. Brent rebounds to the $88-$95 per barrel range, the inflation risk premium re-emerges, and bond yields climb. The equity rally partially reverses as central bank flexibility narrows.
Scenario 3: Deal Collapse and Renewed Conflict
Ratification fails entirely and the Strait of Hormuz closure is reimposed. Brent spikes above $100 per barrel, triggering emergency OPEC market influence response mechanisms. Global recession risk re-enters central bank forecasting models and inflation expectations reset sharply higher.
Investor Takeaway: The asymmetry here is significant. Full implementation delivers a moderate benefit: lower oil, stable equities, and policy flexibility. Deal failure delivers a severe penalty: oil spike, inflation re-acceleration, and extended restrictive monetary conditions. This asymmetry justifies the hedged positioning visible in gold and Treasury markets even as equities rallied.
Key Indicators to Monitor Through the Resolution Process
Investors tracking the durability of the U.S.-Iran peace deal and oil prices impact should focus on the following leading indicators:
- June 19, 2026: The anticipated formal signing date. A failure to sign on or around this date would likely trigger rapid oil price reversal.
- Strait of Hormuz weekly tanker flow data: Published by maritime tracking services, this is the most reliable real-time indicator of physical supply normalisation progress.
- Iranian export recovery rate: Markets need to see exports recover toward 60-70% of pre-conflict levels to sustain the current crude price decline. Below this threshold, surplus expectations dissolve.
- Tanker war risk insurance premium levels: A lagging but reliable indicator of whether the shipping industry has genuinely accepted the security environment as normalised.
- Central bank forward guidance: Any shift in language at upcoming policy meetings toward acknowledging energy disinflation would confirm the bond market's transitory interpretation and support equities.
- Gold price trajectory: Sustained gold weakness below $4,200 per ounce would confirm growing institutional confidence in the deal's durability. Gold holding above this level signals continued hedging against failure scenarios.
Frequently Asked Questions: U.S.-Iran Peace Deal and Oil Prices
Why did oil prices fall so sharply on the peace deal announcement?
The sharp decline reflects the unwinding of a geopolitical risk premium that had been embedded in crude benchmarks for approximately four months. When the probability of sustained Strait of Hormuz disruption declines materially, the supply-risk buffer built into forward prices is no longer justified, producing rapid repricing lower even without any immediate change in physical supply volumes.
How significant were the oil price moves?
WTI crude fell 4.77% to approximately $80.83 per barrel, while Brent crude dropped approximately 4% to $83.77 per barrel in the immediate aftermath of the peace framework announcement. These are large single-session moves for a major commodity. As reported by Time, the volatility surrounding these negotiations has been extraordinary by historical standards.
Is the agreement fully confirmed?
As of mid-June 2026, the framework had been announced but not formally signed. Signing was anticipated around June 19, 2026, with several key implementation details including sanctions relief scope, frozen asset access, and nuclear program constraints still under active negotiation.
What happens to crude prices if the deal falls apart?
Analysts expect Brent to rebound sharply toward or above $95-$100 per barrel if negotiations collapse or ratification stalls, as the full geopolitical risk premium would likely re-enter pricing rapidly.
What does a sustained oil price decline mean for monetary policy?
Lower crude prices reduce headline inflation, easing pressure on central banks to maintain restrictive policy stances. This increases the probability of rate holds or eventual cuts, which supports both equity valuations and bond prices simultaneously.
Disclaimer: This article contains forward-looking statements, market forecasts, and scenario projections based on information available at the time of writing. Commodity markets, geopolitical developments, and central bank policy decisions are subject to rapid change. Nothing in this article constitutes financial advice. Readers should conduct their own due diligence and consult a qualified financial professional before making investment decisions.
Want To Stay Ahead of Market-Moving Commodity Discoveries in Real Time?
While geopolitical events reshape energy markets overnight, significant mineral discoveries on the ASX can deliver equally dramatic price movements — and Discovery Alert's proprietary Discovery IQ model ensures subscribers receive instant notifications the moment those opportunities emerge, turning complex data across 30+ commodities into clear, actionable insights. Explore historic discovery returns on Discovery Alert's dedicated discoveries page and begin your 14-day free trial today to position yourself ahead of the broader market.