June 21, 2026
Why Political Agreements and Physical Oil Flows Are Two Very Different Things
Energy markets have a long history of pricing hope before it materialises. Diplomatic breakthroughs, ceasefire announcements, and framework agreements routinely trigger sharp moves in crude futures, only for prices to stabilise as traders reckon with the gap between what has been signed and what has actually changed on the water. That tension is precisely where global oil markets find themselves in mid-June 2026, as the US-Iran peace deal and Strait of Hormuz oil prices become the two most scrutinised variables in the energy complex.
Understanding why Brent crude has not collapsed despite a landmark diplomatic development requires moving beyond headline supply-demand mechanics into the layered world of risk premiums, transit chokepoint economics, and the operational realities of restoring a disrupted maritime corridor. For a broader crude market overview, the current environment represents one of the most complex pricing periods in recent memory.
When big ASX news breaks, our subscribers know first
The MOU Framework: What Has Actually Been Agreed
The agreement taking shape between Washington and Tehran is structured as a 60-day memorandum of understanding (MOU), functioning as an extension of a fragile ceasefire first established in April 2026. Critically, this is not a binding treaty, and its full text had not been made public as of June 17, 2026, meaning market participants are still trading on partial information rather than confirmed terms.
Several provisions have been confirmed through diplomatic channels:
- Iran has committed to a non-nuclear weapons posture as a central condition of the framework
- Upon formal signing, Iran would be authorised to resume oil export activity
- The US would lift its naval blockade of Iranian ports as a reciprocal measure
- Tehran would permit commercial tanker traffic through the Strait of Hormuz to resume
- Demining operations and the removal of naval restrictions are listed as implementation steps
What the MOU does not resolve is equally significant. Israel has publicly distanced itself from both the April ceasefire and the current framework, introducing a genuine wildcard into the stability calculus. No permanent truce has been agreed upon; the 60-day window is explicitly designed as a negotiating runway rather than a resolution. Israeli drone strikes continued targeting positions in southern Lebanon on June 17, adding a layer of operational uncertainty that markets cannot ignore.
The absence of a public document means traders are pricing probability rather than certainty. A framework that exists but cannot be verified functions more like a rumour than a policy, and markets are treating it accordingly.
Furthermore, the geopolitical tensions surrounding this agreement extend well beyond the Iran-US bilateral relationship, with regional actors actively shaping the diplomatic calculus in ways that introduce persistent uncertainty.
The Strait of Hormuz: A Chokepoint Unlike Any Other
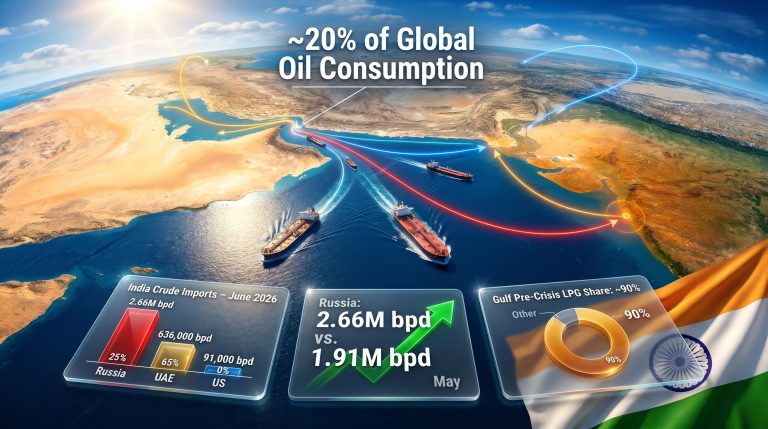
To appreciate why the US-Iran peace deal and Strait of Hormuz oil prices are so tightly linked, it helps to understand the strait's structural role in global energy architecture. Before conflict escalation in late February 2026, roughly one-fifth of all global crude oil and liquefied natural gas supplies passed through this narrow passage connecting the Persian Gulf to the Gulf of Oman every single day.
No other single geographic point carries equivalent energy transit exposure. The strait serves as the sole maritime exit for energy exports from Saudi Arabia, Iraq, Kuwait, the United Arab Emirates, and Iran itself. When it effectively closed following US and Israeli strikes on February 28, 2026, the consequences rippled across every linked market simultaneously:
- Tanker routing shifted to longer, more expensive alternatives
- War risk insurance premiums for Gulf shipping spiked sharply
- Spot LNG prices in Asia and Europe reacted to supply uncertainty
- Refinery feedstock planning across Asia was disrupted as delivery windows stretched
The LNG dimension is often underappreciated in coverage focused on crude oil. Qatar, one of the world's largest LNG exporters, relies on the Strait of Hormuz as its primary shipping corridor to Asian buyers. Extended disruption has already accelerated procurement diversification, and the impact on global LNG supply chains may persist long after the strait reopens.
Key Events and Price Timeline
| Event | Date | Market Impact |
|---|---|---|
| US and Israeli strikes trigger conflict escalation | February 28, 2026 | Strait effectively blocked |
| Initial ceasefire agreement reached | April 2026 | Temporary de-escalation |
| Oil benchmarks hit three-month lows | Mid-June 2026 | ~5% decline across two sessions |
| MOU framework announced | June 17, 2026 | Brent at $78.81/barrel |
| API crude inventory draw reported | Week ending June 12, 2026 | 8.3 million barrels vs 4.6 million expected |
Why Oil Prices Are Moving Cautiously, Not Collapsing
The question most investors are asking is straightforward: if a peace deal has been announced, why haven't oil prices fallen sharply? The answer involves several interacting forces operating simultaneously.
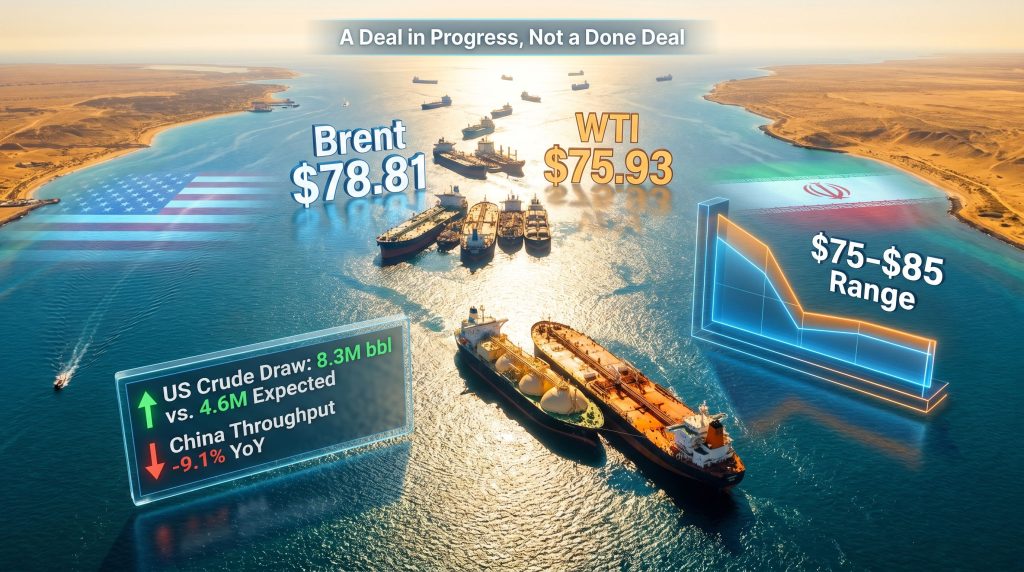
On June 17, 2026, Brent crude futures declined approximately 0.2% to $78.81 per barrel, while WTI fell 12 cents to $75.93 per barrel. These were modest moves following two consecutive sessions where both benchmarks dropped roughly 5% each, bringing them to three-month lows. Much of the diplomatic optimism had already been partially priced in before the formal MOU announcement.
Priyanka Sachdeva, senior market analyst at Phillip Nova, noted that markets were broadly removing the embedded geopolitical risk premium from oil prices, while simultaneously cautioning that the path toward normalisation remains far from straightforward given that physical tanker traffic through the Strait had yet to fully recover (Arab News, June 17, 2026).
This distinction between political and physical normalisation is the critical analytical frame. A signed document does not reopen a minefield. It does not instantly recalibrate war risk insurance underwriting models. It does not automatically restore tanker scheduling, port operational capacity, or refinery supply chains that have been reorganised over months of disruption. Industry officials have stated plainly that a full return to pre-conflict production and refining levels could take weeks, months, or even years depending on infrastructure condition and the durability of the peace framework.
Hiroyuki Kikukawa, chief strategist at Nissan Securities Investment, assessed that WTI would likely remain volatile within a $10 band above or below $80 per barrel as markets absorb implementation uncertainty (Arab News, June 17, 2026). According to Fox Business, the deal's potential to fully reopen the strait remains a key variable in how aggressively traders will unwind their risk positions.
Three Scenarios for Crude Markets Over the Next 60 Days
Given the binary nature of diplomatic outcomes and the complexity of physical restoration, scenario analysis is more useful than point forecasts for understanding where oil prices may move from here. In addition, the oil price volatility already embedded in market positioning means that even positive news carries a measured response.
Scenario 1: Full Normalisation
The strait reopens within 30 to 60 days, Iranian exports resume at meaningful volumes, and insurance markets recalibrate quickly. Under this pathway, Brent would likely retreat toward the low-to-mid $70s, with WTI tracking proportionally lower. This scenario is contingent on Israeli non-interference and formal MOU ratification, making it a moderate-probability outcome rather than a baseline.
Scenario 2: Partial Reopening (Baseline)
The strait opens for commercial passage under managed conditions, Iranian volumes return gradually, and supply-side relief is slow enough that prices remain range-bound between $75 and $85 per barrel. This reflects current market consensus and is the highest-probability scenario based on available information.
Scenario 3: Diplomatic Breakdown
Israeli military action or MOU collapse triggers renewed restrictions. The strait reverts to a restricted or closed posture, and the geopolitical risk premium reprices sharply upward. Brent could spike back above $90 per barrel under this scenario. Lower probability, but non-trivial given Israel's stated non-participation in the agreement.
The asymmetry embedded in these scenarios explains the market's measured behaviour. Selling aggressively into a peace deal carries real tail risk if diplomatic progress reverses, and traders appear to be sizing positions accordingly.
What Inventory Data and Demand Signals Reveal
Beneath the geopolitical headline sits a set of fundamental data points that provide important context for where prices might anchor regardless of diplomatic outcomes.
The American Petroleum Institute reported a US crude stock draw of 8.3 million barrels for the week ending June 12, 2026, significantly exceeding analyst expectations of a 4.6 million barrel draw. That is an approximately 80% beat against consensus, suggesting stronger-than-anticipated underlying demand or meaningful supply tightness persisting in the US market. Official confirmation from the Energy Information Administration was pending at the time of reporting.
On the demand side, a countervailing bearish signal emerged from China. Chinese crude oil throughput fell 9.1% year-on-year in May 2026, reaching its lowest level in nearly four years. This decline signals that Chinese refiners were drawing down stockpiles accumulated during the conflict period rather than purchasing new imports at elevated prices. Given that China remains the world's largest crude importer, demand compression of this magnitude acts as a structural ceiling on any price recovery even if Hormuz reopens fully.
| Signal | Direction | Market Implication |
|---|---|---|
| US crude inventory draw (8.3M barrels) | Bullish | Supports price floor on WTI |
| China throughput down 9.1% year-on-year | Bearish | Caps upside recovery potential |
| Strait of Hormuz still restricted | Bullish | Maintains supply risk premium |
| MOU framework announced | Bearish | Reduces embedded geopolitical premium |
| Israel non-participation in deal | Bullish | Sustains uncertainty discount |
The next major ASX story will hit our subscribers first
The OPEC+ Supply Chess Match
One dimension receiving insufficient attention in mainstream coverage is the strategic tension the Iran deal creates within the OPEC+ alliance. Iran's return to full export capacity would introduce a substantial volume of additional barrels into an already complex supply management environment. The OPEC+ production decisions that follow any formal deal ratification will function as a secondary pricing signal that energy investors should monitor closely alongside the diplomatic timeline.
Saudi Arabia and other Gulf producers face a genuine strategic tension here. A stable and open Strait of Hormuz is economically necessary for their own exports, yet unconstrained Iranian supply expansion directly competes with their market share. Consequently, how the alliance responds to a recovering Iran will be just as important as the peace deal itself in shaping the medium-term price trajectory.
A subtler but equally important consideration involves the broader economic architecture of the peace framework. Separate reporting indicates the deal includes a $300 billion economic reconstruction and normalisation fund, with more than half of that commitment reportedly already secured from participating parties. Economic incentives of this scale are designed to create durable compliance motivations, not just short-term de-escalation, which may lend the framework greater longevity than similar agreements have historically achieved in the region.
What Energy Investors Should Be Watching
For those with exposure to energy equities, crude futures, or LNG infrastructure, the following indicators provide the most actionable leading signals in the current environment:
- Vessel tracking data from the Strait of Hormuz – Physical tanker traffic is the most reliable real-time indicator of actual normalisation, preceding any official announcement
- EIA weekly inventory reports – US crude stock data will continue to provide the clearest demand-side signal while supply remains uncertain
- MOU ratification progress – Whether the 60-day window produces substantive movement toward a permanent truce structure is the central diplomatic variable
- Israeli military posture – Any escalation in Lebanon, or direct action against Iranian assets, could rapidly reverse diplomatic progress and reprice crude risk premiums
- OPEC+ production decisions – Supply management choices in the Gulf will significantly shape the price trajectory once Hormuz reopens
Energy sector equities may face near-term headwinds as the geopolitical risk premium compresses, while volatility in crude futures is likely to remain elevated given the binary nature of potential diplomatic outcomes. As DW reports, questions around the precise timeline for oil market recovery remain central to how analysts and traders are positioning themselves heading into the second half of 2026.
Frequently Asked Questions
What is the Strait of Hormuz and why does it matter for oil prices?
The Strait of Hormuz is a narrow maritime passage connecting the Persian Gulf to the Gulf of Oman. Before the conflict escalation in early 2026, approximately 20% of the world's crude oil and LNG supply transited it daily. Any restriction to that passage directly tightens global energy supply and places upward pressure on prices worldwide.
Has the US-Iran peace deal officially reopened the Strait of Hormuz?
As of June 17, 2026, the strait had not fully reopened. The MOU framework provides a pathway toward normalised commercial shipping, but physical tanker traffic had not yet recovered to pre-conflict levels at the time of reporting. The US-Iran peace deal and Strait of Hormuz oil prices therefore remain closely intertwined as the 60-day window progresses.
Why did oil prices only fall modestly after the peace deal announcement?
Markets had already partially priced in diplomatic progress across the two prior trading sessions, during which Brent and WTI each fell approximately 5%. The June 17 session reflected residual uncertainty about implementation timelines, Israeli non-participation, and the operational gap between political agreements and restored physical supply flows.
How long could it take for Iranian oil production to return to normal?
Industry officials suggest a full recovery of Iranian production and refining capacity could take anywhere from several weeks to multiple years, depending on infrastructure condition, the pace of sanctions unwinding, and the durability of the peace framework over its 60-day negotiating window and beyond.
Want to Track the Next Major Commodity Shift Before the Market Moves?
Discovery Alert's proprietary Discovery IQ model scans ASX announcements in real time, delivering instant alerts on significant mineral discoveries so investors can identify actionable opportunities ahead of the broader market — explore historic discovery returns that demonstrate what early positioning can achieve, and begin your 14-day free trial at Discovery Alert to secure your market-leading edge.