June 23, 2026
The Hidden Architecture of Global Oil Flow: Why One Narrow Strait Controls Energy Markets
Few investors fully appreciate just how concentrated the world's oil supply infrastructure really is. While headlines focus on OPEC+ production quotas, shale drilling rig counts, and demand forecasts from Beijing, the physical movement of crude oil remains dependent on a handful of narrow maritime passages that have no modern equivalent in terms of strategic vulnerability. When one of those passages becomes contested territory, the entire pricing architecture of global energy shifts almost overnight.
That is precisely what unfolded in the weeks leading up to mid-June 2026, as the US-Iran peace deal and Strait of Hormuz oil supply became the defining issue in the most significant energy supply disruption in recent memory. The subsequent peace agreement, announced as a preliminary memorandum of understanding, triggered one of the more counterintuitive market reactions observers had seen in years: oil prices fell sharply, and kept falling.
Understanding why requires a framework that goes well beyond headline diplomacy.
When big ASX news breaks, our subscribers know first
Why the Strait of Hormuz Is Structurally Irreplaceable
The Strait of Hormuz sits between the Omani coastline and the southern tip of Iran, forming a navigational bottleneck just 33 kilometres wide at its narrowest navigable point. Despite its modest geography, it serves as the primary export corridor for crude produced across the Persian Gulf basin, including volumes from Saudi Arabia, Iraq, the UAE, Kuwait, Qatar, and Iran itself.
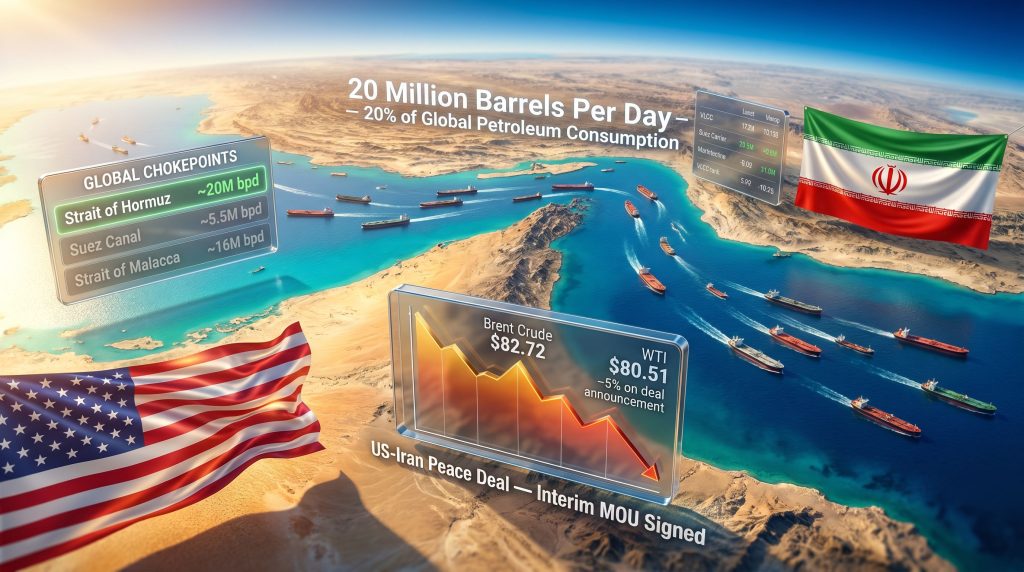
According to the U.S. Energy Information Administration, approximately 20 million barrels per day of petroleum liquids transited the strait in 2024, representing roughly 20% of total global petroleum consumption. No other single passage comes close to that concentration of supply dependency.
| Chokepoint | Daily Oil Flow | % of Global Supply | Viable Bypass? |
|---|---|---|---|
| Strait of Hormuz | ~20 million bpd | ~20% | Partial only |
| Strait of Malacca | ~16 million bpd | ~16% | Limited |
| Bab el-Mandeb | ~6 million bpd | ~6% | Partial |
| Suez Canal | ~5.5 million bpd | ~5% | Yes (Cape route) |
The Strait of Hormuz carries more than three times the oil volume of the Suez Canal, and unlike the Suez, it has no fully viable bypass route capable of absorbing a complete closure scenario. Saudi Arabia operates the East-West Pipeline, which can move roughly 5 million barrels per day to Red Sea terminals, and the UAE has the Abu Dhabi Crude Oil Pipeline connecting to Fujairah. However, these alternatives, even combined, cannot replace the volume that ordinarily flows through the strait itself.
During the active phase of the US-Iran conflict, the disruption to net oil flows was estimated at approximately 11 million barrels per day, even after partial offsetting measures were applied. That figure alone contextualises why a single diplomatic agreement was capable of moving global energy prices by nearly 5% in a single trading session. Furthermore, understanding these geopolitical oil price drivers is essential for any investor tracking energy markets in 2026.
What the US-Iran Peace Agreement Actually Contains
Media coverage of the announcement framed it as a peace deal, but the precise nature of the arrangement matters significantly for anyone trying to assess its medium-term market implications.
What was signed in mid-June 2026 is more accurately described as a preliminary memorandum of understanding, not a final treaty or comprehensive peace settlement. The confirmed elements of the agreement include:
- A 60-day ceasefire extension creating a negotiation window for deeper issues
- Reopening of the Strait of Hormuz to commercial maritime traffic
- A phased lifting of the U.S. naval blockade on Iranian ports and vessels
- Iran's commitment to freeze nuclear enrichment activity and suspend expansion of nuclear facilities for the duration of the negotiation period
What the agreement does not resolve is equally important. Iran's long-term nuclear programme remains an open question. Sanctions relief architecture, scope, and sequencing have not been agreed. Regional proxy conflict arrangements are unaddressed. And permanent ceasefire verification mechanisms do not yet exist. For broader context, the Straits Times provides a detailed analysis of what this deal means for the strait's future.
Iranian President Masoud Pezeshkian characterised the agreement as a meaningful step toward halting hostilities while cautioning that a durable and final settlement had not yet been reached. A senior Iranian official separately confirmed that Iran would halt uranium enrichment and refrain from expanding nuclear facilities pending a final resolution.
The Two-Phase Problem at the Heart of the Deal
Energy market analysts at DBS Bank have outlined a structural distinction between the two phases of this agreement that has significant implications for physical oil market normalisation.
The first phase, which involved the Geneva signing of the ceasefire extension, was described by DBS Bank energy research as relatively straightforward, designed primarily to buy negotiating time while deferring the most technically and politically complex questions. It is the second phase that markets are watching most closely: the actual, physical reopening of the Strait of Hormuz and the unwinding of the U.S. naval blockade on Iranian ports and vessels.
The critical variable identified by DBS Bank energy research is whether the reopening of the strait and the withdrawal of the naval blockade occur simultaneously and cleanly. Any deviation from a coordinated, simultaneous unlock is expected to produce renewed oil price volatility. Given the significant trust deficit that has accumulated between the parties throughout the conflict, the mechanics of execution carry as much market weight as the diplomatic announcement itself.
The Counterintuitive Market Response: Why Peace Pushed Prices Down
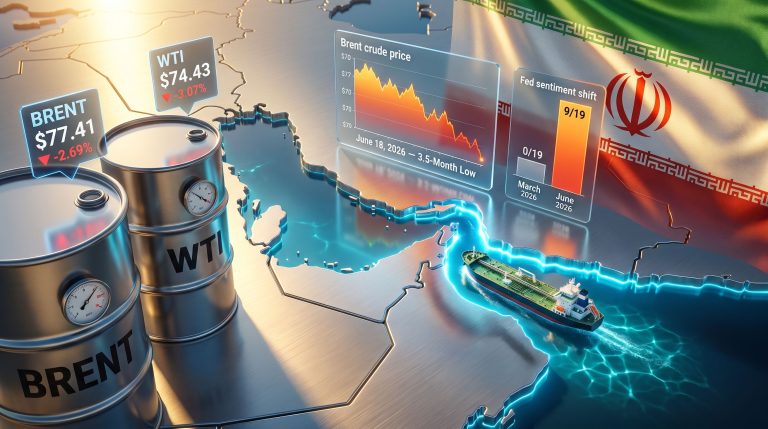
For investors who approach commodity markets through a geopolitical risk premium framework, the immediate price reaction to the US-Iran peace deal and Strait of Hormuz oil supply resolution appears paradoxical. Oil prices fell nearly 5% on the day of the announcement, reaching their lowest closing level since early March 2026.
By 09:31 a.m. Saudi time on June 16, Brent crude futures were trading at $82.72 per barrel, down $0.45 (0.5%), while WTI crude stood at $80.51 per barrel, down $0.24 (0.3%). Far from celebrating a stability premium, markets were actively repricing supply restoration. Consequently, tracking current crude oil prices has become increasingly important for investors navigating this volatile environment.
This is a textbook expression of what traders refer to as the "buy the rumour, sell the news" dynamic. Once a supply disruption is resolved or is credibly expected to be resolved, the geopolitical premium that had been supporting prices evaporates. In this case, however, the price decline was amplified by a second, structurally independent force: pre-existing weakness in physical oil demand that had been building for weeks before the diplomatic announcement.
Two Forces Converging on Price
Supply restoration expectations were the immediate catalyst. Morgan Stanley analysts estimated that more than 85 million barrels of oil stranded in Gulf region storage could be released into global markets as the blockade unwinds. Their projected recovery timeline provides a useful framework:
- Tanker flow restoration: several weeks from deal signing
- Pre-conflict production: ~50% restored by September 2026
- Pre-conflict production: ~80% restored by December 2026
Pre-existing physical market weakness was the structural amplifier. Independent of any geopolitical development, a broad range of indicators had been signalling softness in physical oil markets for weeks prior to the deal announcement. Morgan Stanley analysts identified elevated U.S. crude export volumes and declining Chinese import volumes as the key drivers, noting that neither trend appeared likely to reverse in the short term.
China's crude imports fell 29% year-on-year in May 2026, their lowest level in eight years. That figure extended what was already a dramatic and sustained decline for the world's largest oil importer. Chinese liftings of Saudi Arabian crude were additionally expected to decline further in July 2026, compounding the demand signal.
The May 2026 Chinese import figure is particularly significant because it is not solely a conflict-related effect. Structural changes in Chinese energy consumption, including accelerating electric vehicle penetration suppressing gasoline demand growth and slowing industrial output affecting diesel consumption, suggest that a full demand recovery from China is not guaranteed even once supply channels normalise.
Oil Supply Recovery: A Phase-by-Phase Realistic Assessment
Immediate Term (Weeks 1-4 Post-Deal)
The physical reopening of a major maritime chokepoint after a conflict period does not happen overnight. In the immediate weeks following the deal, several friction points are expected to slow throughput:
- Shipping insurance premiums will remain elevated; war-risk surcharges do not disappear on the day a ceasefire is announced
- Security verification protocols will slow commercial tanker movements through the strait
- Tanker operators and charterers will exercise caution until the political situation demonstrates stability
- Price volatility will remain elevated due to uncertainty around Phase 2 negotiations
Near Term (1-3 Months Post-Deal)
As the strait proves passable and insurance markets begin adjusting their risk assessments, the pace of normalisation is expected to accelerate:
- Gradual normalisation of tanker routing and insurance pricing
- Approximately 50% of pre-conflict production flows restored by September 2026 (Morgan Stanley projection)
- Stranded crude inventories begin releasing into Asian and European markets
- OPEC+ production coordination dynamics re-emerge as an active pricing variable
In addition, OPEC's market influence will play a central role in determining how swiftly these volumes are absorbed without destabilising broader price levels.
Medium Term (3-6 Months Post-Deal)
Full market equilibrium depends heavily on the outcome of Phase 2 negotiations:
- Up to 80% of pre-conflict supply flows restored if Phase 2 proceeds without breakdown
- Shipping, routing, and security infrastructure normalises
- Iran's nuclear and sanctions questions, if resolved, allow complete removal of geopolitical risk premium
Scenario Framework: Three Pathways for Oil Prices
| Scenario | Key Condition | Brent Crude Trajectory | Probability |
|---|---|---|---|
| Clean Deal Execution | Phase 2 succeeds; full reopening on schedule | Downward toward mid-to-low $70s | Moderate |
| Partial/Stalled Implementation | Phase 2 extends; partial reopening only | Range-bound $78-$86, elevated volatility | High |
| Deal Collapse | Negotiations fail; Hormuz re-closes | Spike toward $95-$105+ | Lower but non-negligible |
The base case, reflecting the complexity of unresolved issues and the documented trust deficit between the parties, is a partial or stalled implementation scenario. A clean, rapid resolution remains possible but requires sustained diplomatic momentum across issues that have historically proven resistant to agreement.
A deal collapse scenario, while considered a tail risk by most analysts, carries historical precedent. The track record of Iran-related diplomatic frameworks, including the 2015 JCPOA and its subsequent unravelling, serves as a reminder that even signed agreements can reverse quickly when domestic political pressures or verification disputes emerge. Furthermore, oil price movements in the preceding months demonstrate just how sensitive energy markets have become to geopolitical signals.
The next major ASX story will hit our subscribers first
The OPEC+ Recalibration Challenge
One dimension of this situation that receives insufficient attention in mainstream coverage is the strategic dilemma it creates for OPEC+ as a whole. Iran's return to anything approaching full export capacity, if achieved, would represent a substantial supply addition to markets that are already exhibiting structural softness on the demand side.
Saudi Arabia, as the cartel's de facto swing producer, faces a familiar but acute tension: how to accommodate Iranian volume recovery without triggering a sustained price collapse that undermines the fiscal positions of all member states. The trajectory of Saudi crude allocations to Chinese refiners in the second half of 2026 will function as a key leading indicator of how Riyadh is managing this transition.
The interaction between the US-Iran peace deal and Strait of Hormuz oil supply dynamics, combined with OPEC+ strategy, adds a further layer of complexity to the already-crowded field of variables affecting oil prices. Investors should resist the temptation to treat the diplomatic announcement as a binary resolution event. What it actually represents is the beginning of a prolonged recalibration across supply, demand, geopolitical risk, and cartel management dynamics simultaneously. In this context, the US-China trade war oil prices dynamic adds yet another dimension of demand-side pressure that cannot be ignored.
Frequently Asked Questions: US-Iran Peace Deal and Oil Supply
How much oil flows through the Strait of Hormuz each day?
Approximately 20 million barrels per day of petroleum liquids transited the Strait of Hormuz in 2024, according to the U.S. Energy Information Administration, representing roughly 20% of global petroleum consumption. During the US-Iran conflict, net oil flows through the strait were disrupted by an estimated 11 million barrels per day.
What does the US-Iran peace deal actually include?
The agreement is an interim memorandum of understanding, not a final treaty. Confirmed elements include a 60-day ceasefire extension, reopening of the Strait of Hormuz, a phased lifting of the U.S. naval blockade, and Iran's temporary freeze on nuclear enrichment. Long-term nuclear, sanctions, and regional security issues remain unresolved and will be the subject of Phase 2 negotiations.
Why did oil prices fall when the peace deal was announced?
Oil prices declined as markets began pricing in the return of supply previously blocked by the Hormuz closure. This effect was compounded by pre-existing weakness in physical demand, particularly a 29% collapse in Chinese crude imports in May 2026 and elevated U.S. crude export volumes. Both forces converged on the same direction simultaneously. Yahoo Finance's coverage of the oil slide provides further market data on this price reaction.
How long will it take for oil supply to fully normalise?
Morgan Stanley projects a phased recovery: approximately 50% of pre-conflict production flows restored by September 2026 and 80% by December 2026. Full normalisation depends on shipping insurance markets, security verification, and the outcome of Phase 2 diplomatic negotiations.
What is the biggest risk to oil market stability?
The primary risk identified by energy analysts is a non-simultaneous or conditional reopening of the strait and naval blockade. Any deviation from a clean, coordinated unlock is expected to trigger renewed price volatility, with the trust deficit between the U.S. and Iran representing the key execution risk.
Disclaimer: This article is for informational purposes only and does not constitute financial advice. All price projections, scenario analyses, and recovery timelines represent analyst forecasts and are subject to change based on evolving geopolitical and macroeconomic conditions. Investors should conduct their own due diligence before making any investment decisions related to energy markets or oil-linked securities.
Want to Stay Ahead of the Next Major Market-Moving Discovery?
While geopolitical shifts in oil markets dominate headlines, significant mineral discoveries on the ASX can generate equally dramatic returns — and timing is everything. Discovery Alert's proprietary Discovery IQ model delivers real-time alerts the moment high-potential ASX mineral discoveries are announced, transforming complex data across 30+ commodities into clear, actionable insights — explore the historic returns major discoveries have generated and begin your 14-day free trial today to position yourself ahead of the broader market.