June 22, 2026
The Hidden Architecture of Oil Price Volatility: Why Diplomacy Now Drives Markets More Than Drilling
Few forces reshape energy markets as rapidly and unpredictably as diplomatic pivots between major oil-producing nations and their adversaries. While supply-demand fundamentals set the long-term floor and ceiling for crude prices, it is the short-term geopolitical risk premium that explains the violent price swings traders experience in real time. Understanding how that premium is built, sustained, and dismantled is essential for anyone trying to interpret why US-Iran talks oil prices move in directions that sometimes defy conventional supply logic.
When big ASX news breaks, our subscribers know first
The Geopolitical Risk Premium: What It Is and Why It Persists
Every barrel of crude traded on global exchanges carries more than just a production cost. It carries a probability-weighted fear of disruption. When geopolitical tension elevates the perceived likelihood that supply routes may be restricted, traders bid prices above the level that pure fundamentals would justify. This surplus above equilibrium is the geopolitical risk premium, and it is one of the most misunderstood components of energy pricing.
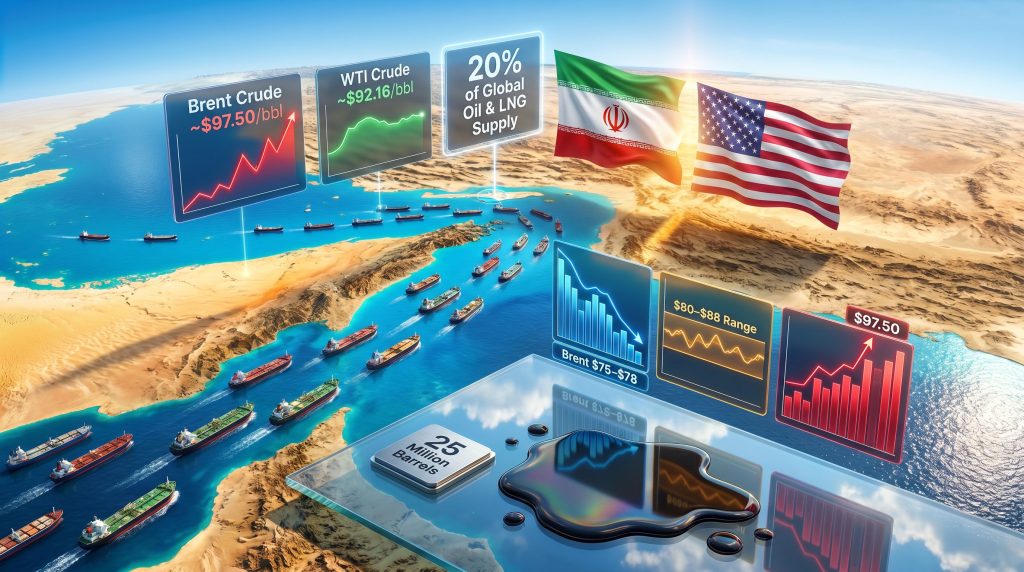
What makes the current US-Iran negotiation track particularly powerful as a price-moving variable is its direct relationship to the Strait of Hormuz, the narrow waterway separating Iran from Oman. Approximately 20% of the world's combined oil and LNG supplies transit this chokepoint annually. No other geographic feature on Earth concentrates so much energy supply risk in such a confined space. The geopolitical oil price drivers at play here extend well beyond any single diplomatic session.
The Strait of Hormuz is not simply a shipping lane. It functions as a pressure valve for global energy markets. When it faces credible closure risk, the premium embedded in crude prices rises sharply, irrespective of whether a single additional barrel has actually been taken offline.
Even communication gaps between Washington and Tehran, rather than actual military events, have historically been sufficient to trigger measurable crude price movement. This is the structural reality that makes US-Iran diplomacy the single most watched geopolitical variable in oil trading rooms globally.
What Emerged from the Switzerland Talks and How Markets Interpreted It
High-ranking US and Iranian officials completed their first formal negotiating round in Switzerland in late June 2026, with the discussions conducted under the terms of a memorandum of understanding that extended an April ceasefire by a minimum of 60 days. Iran's foreign minister confirmed the country had secured three significant concessions:
- Export waivers covering oil and petrochemical shipments
- The release of a portion of previously frozen sovereign assets
- A framework commitment to a reconstruction and development plan
Markets responded in two distinct and opposing phases. Brent crude opened the trading session at $82.30 per barrel after US President Donald Trump threatened to restart military action against Iran, combined with Tehran's announcement of renewed Strait of Hormuz restrictions. As diplomatic progress became clearer through the day, prices pulled back sharply to close at $79.96 per barrel, a decline of $2.34 from the opening level.
| Benchmark | Reference Level | Closing Level | Movement |
|---|---|---|---|
| Brent Crude (opening) | $82.30/bbl | $79.96/bbl | -$2.34 intraday |
| WTI (front month) | Prior session | $77.20/bbl | +$0.60 |
| WTI August Contract | Prior session | $76.04/bbl | +$0.19 |
UBS analyst Giovanni Staunovo identified diplomatic progress in Switzerland as the primary downward pressure on crude that session. He noted that Iranian oil exports that had been blocked by a US naval blockade earlier in June 2026 had begun resuming, with the returning barrels representing additional supply entering an already adjusting market.
Why Volatility Persisted Despite Positive Signals
One of the more instructive features of this trading session was the persistence of price oscillation even as talks appeared to progress constructively. Iranian-linked media reported a suspension of negotiations at one point during the day, while both the US administration and Iran's foreign ministry simultaneously signalled that dialogue remained active.
This contradiction between competing credible sources created a pricing environment where traders were not expressing a single view on outcomes but rather assigning probabilities across a distribution of scenarios. This distinction matters enormously for understanding crude price behaviour during geopolitically charged periods. Markets were not trending; they were oscillating around uncertainty. Furthermore, these oil price movements are consistent with patterns seen during previous rounds of diplomatic tension in the region.
Consequently, OPEC's market influence during such periods becomes a secondary but still meaningful variable, as member states adjust their own signalling in response to diplomatic developments between Washington and Tehran.
Quantifying the Supply Re-Entry: More Complexity Than Headlines Suggest
The headline figure circulating after the Switzerland talks was significant: the head of the National Iranian Oil Company stated on state television that more than 25 million barrels of Iranian crude had passed through the virtual naval blockade perimeter since the diplomatic breakthrough. That number sounds large, but context is essential.
Twenty-five million barrels represents roughly 25 days of Iran's pre-blockade export capacity at moderate production levels. It does not represent 25 days of global supply. More importantly, the origin of those early returning barrels matters structurally. The first wave of re-entering supply is not coming from freshly drilled or recently activated wells. It is coming from stored crude and tankers that were already loaded prior to or during the blockade period.
This distinction is critical and is often missed in mainstream energy coverage. ANZ Research framed it clearly: early supply recovery will be driven by logistics and shipping normalisation rather than upstream production increases. The more demanding phase of recovery, which involves restarting upstream field operations and restoring refinery capacity, involves a fundamentally different timeline.
ANZ's Phased Recovery Framework
ANZ Research outlined a three-phase model for assessing the trajectory of Iranian and regional supply restoration:
Phase 1: Weeks 1 to 4
- Estimated recovery: 2 to 3 million barrels per day
- Driver: Shipping logistics normalisation, tanker availability, insurance coverage
- Constraint: Port access and the availability of vessels willing to operate in post-conflict waters
Phase 2: Q3 2026 (Conditional)
- Additional potential recovery: 2 to 3.5 million barrels per day
- Precondition: Sustained ceasefire and verifiable infrastructure integrity
- Risk: Any renewal of hostilities immediately reverses Phase 2 gains
Phase 3: Structural Loss Assessment
- Estimated permanent or semi-permanent supply loss: 1 to 2 million barrels per day
- Cause: Infrastructure damage, upstream field degradation, and refinery destruction that cannot be reversed within a fiscal year
- ANZ conclusion: Full supply restoration within 2026 is not achievable
What this phased model reveals is something most retail investors overlook: the pace of supply recovery is governed by industrial logistics and physical infrastructure, not political announcements. A peace deal signed today does not translate into barrels flowing tomorrow at full capacity.
Regional Producers and the Supply Gap Response
While Iranian supply was restricted, neighbouring producers moved quickly to service displaced demand. The United Arab Emirates, Kuwait, and Iraq each offered incremental supply increases to their customers during the preceding week. Iraq's deputy oil minister for upstream affairs publicly confirmed plans to gradually restore crude production to a range of 4.2 to 4.3 million barrels per day, a meaningful increase from disruption-period output levels.
This regional supply response creates a structural complication that will unfold over the coming months. These producers made bilateral supply commitments to customers during the crisis period. Unwinding those commitments as Iranian barrels return is not a simple administrative exercise. It involves contract renegotiation, shipping reallocation, and in some cases, competing OPEC+ quota obligations.
Three Scenarios for Crude Price Trajectory Through the Rest of 2026
The uncertainty embedded in current oil markets can be usefully organised into three outcome scenarios, each with distinct implications for price direction and volatility. The interplay between crude and geopolitics remains the defining variable across all three:
Scenario A: Full Diplomatic Resolution
- The 60-day ceasefire extension converts into a durable framework
- Iranian export waivers become permanent and supply recovery accelerates through Phase 2
- Brent crude faces sustained downward pressure toward the $75 to $78 per barrel range as surplus risk re-emerges
- OPEC+ faces renewed pressure to manage collective production ceilings
Scenario B: Partial Recovery with Persistent Uncertainty
- Negotiations produce incremental agreements rather than a comprehensive settlement
- Supply recovers 3 to 4 million bpd but structural losses of 1 to 2 million bpd remain offline
- Brent consolidates in a $80 to $88 per barrel range with the geopolitical premium maintained at a reduced level
- Each new diplomatic development triggers repricing events
Scenario C: Diplomatic Collapse or Renewed Conflict
- The ceasefire breaks down and Strait of Hormuz faces credible closure threat again
- Twenty percent of global oil and LNG supply faces simultaneous disruption risk
- Brent crude retests or exceeds the $97.50 intraday high recorded at peak uncertainty
- Demand destruction begins to offset supply shock at sustained elevated price levels
The next major ASX story will hit our subscribers first
How US-Iran Talks Transmit to Consumer Energy Prices
The connection between geopolitical negotiations and retail fuel prices is not abstract. Crude oil constitutes 50 to 60% of retail gasoline pricing in the United States. A sustained increase of $10 per barrel in Brent crude translates to approximately $0.23 to $0.25 per gallon added to US pump prices within two to four weeks of the crude price shift.
European consumers carry additional vulnerability due to natural gas linkages. Disruptions to global LNG supply through the Strait of Hormuz affect European spot gas prices, creating a dual exposure that pure crude benchmarks do not fully capture.
| Region | Primary Exposure | Transmission Speed | Key Vulnerability |
|---|---|---|---|
| United States | WTI crude, gasoline | 2 to 4 weeks | Refinery margin compression |
| Europe | Brent crude, LNG | 1 to 3 weeks | Combined crude and gas exposure |
| Asia (India, China, Japan) | Middle East crude imports | Near immediate | 60 to 70% of crude sourced from Gulf |
| Emerging Markets | Dollar-denominated oil | Near immediate | Currency depreciation amplifies cost burden |
Asia represents a particularly acute exposure zone. India, China, and Japan collectively source the majority of their crude from the Gulf region, meaning any sustained Strait of Hormuz disruption creates immediate feedstock risk for refineries serving billions of energy consumers. This is why diplomatic oil price movements that may appear distant from Asian markets can trigger rapid repricing across Asian energy benchmarks within hours of news breaking.
The OPEC+ Coordination Challenge Nobody Is Talking About
Beyond the immediate supply re-entry dynamics, there is a medium-term structural issue that has received insufficient analytical attention: the OPEC+ coordination problem created by this crisis.
When Iranian supply was blocked, several Gulf members expanded output to fill the gap and maintain customer relationships. Iraq committed to restoring production toward the 4.2 to 4.3 million bpd range. UAE and Kuwait made incremental supply offers to customers who needed guaranteed volumes. These decisions were commercially rational during the disruption period.
The difficulty arises now. As Iranian barrels return to the market, the aggregate supply picture shifts from shortage to potential surplus. OPEC+ members who expanded output face a choice: absorb reduced revenue at lower prices, wind back bilateral commitments to customers, or push for coordinated quota reductions across the group.
Historical precedent within OPEC+ suggests that coordination becomes significantly harder when individual members have made direct supply promises to customers outside the formal quota framework. The next ministerial meeting will be a critical indicator of whether the group manages this transition proactively or allows market oversupply to force a reactive price correction.
Frequently Asked Questions: US-Iran Talks and Oil Prices
Why did Brent crude fall after talks that were broadly described as positive?
When traders price in a geopolitical risk premium ahead of uncertainty and that uncertainty then resolves partially, the premium deflates. Diplomatic progress signalling resumed Iranian exports reduces perceived scarcity, triggering automatic risk-premium removal. Reports confirm that even partial diplomatic signals were sufficient to move markets meaningfully in this instance.
How reliable is the 25 million barrel figure for returned Iranian supply?
This figure was sourced from the head of the National Iranian Oil Company via state television and represents barrels that have moved through the blockade perimeter, not necessarily barrels that have been delivered to end refineries. Logistical delays mean the actual market impact lags the headline number.
What makes the Strait of Hormuz irreplaceable as a supply route?
There is no fully capable alternative route that can absorb 20% of global oil and LNG supply at short notice. Saudi Arabia's East-West pipeline and the UAE's Abu Dhabi Crude Oil Pipeline provide partial bypass capacity, but their combined throughput cannot replace Hormuz volume in a rapid disruption scenario.
Is full Iranian supply recovery possible in 2026?
According to ANZ Research's assessment, full restoration within 2026 is unlikely. Structural losses of 1 to 2 million barrels per day may prove permanent or semi-permanent due to the scale of infrastructure damage requiring capital-intensive repairs measured in years, not months.
What should energy investors watch as leading indicators?
The most reliable leading indicators for near-term crude price direction include:
- The status of the 60-day ceasefire extension
- Tanker movement data through the Strait of Hormuz
- OPEC+ ministerial statements on quota adjustments
- Any signals of renewed hostilities in Lebanon or Iran
Disclaimer: This article contains forward-looking scenarios and analysis based on available data as of June 2026. Price projections and supply recovery estimates represent analytical frameworks rather than investment advice. Energy markets are subject to rapid change driven by geopolitical, logistical, and macroeconomic factors beyond any single forecast model's capacity to capture. Readers should consult qualified financial advisers before making investment decisions based on commodity price outlooks.
Want to Know Which ASX Resource Stocks Could Benefit From Energy Market Shifts?
Discovery Alert's proprietary Discovery IQ model scans ASX announcements in real time, instantly identifying significant mineral discoveries and actionable investment opportunities across more than 30 commodities — so subscribers can position themselves ahead of the broader market. Start your 14-day free trial at Discovery Alert today, or explore how historic discoveries have generated substantial returns on the dedicated discoveries page.