
June 26, 2026
Immediate Market Dynamics During Regional Military Escalation
Global energy markets face unprecedented complexity as geopolitical tensions reshape traditional supply-demand calculations. The US Iran war oil impact extends far beyond immediate supply disruptions, creating cascading effects through interconnected economic systems. Understanding these mechanisms requires analysing multiple timeframes, from hourly trading patterns to multi-decade structural shifts in energy security frameworks.
Furthermore, the intricate relationship between regional conflicts and petroleum pricing demonstrates how OPEC meeting impact influences market stability during crisis periods. However, current tensions involve factors beyond traditional production quotas.
Historical Volatility Framework Analysis
Energy markets demonstrate consistent patterns during military conflicts, though the magnitude varies significantly based on strategic infrastructure involvement. The 1991 Gulf War produced crude oil price increases of approximately 90% from pre-invasion levels, reaching $40 per barrel from roughly $21 previously.
This dramatic surge reflected concerns over Kuwait's 2 million barrel per day production capacity and potential Saudi Arabian facility targeting. Consequently, market participants learned valuable lessons about infrastructure vulnerability during regional conflicts.
The 2003 Iraq invasion generated a more measured 56% price appreciation, with WTI crude advancing from $32 to peaks above $50 per barrel. This relatively contained response reflected improved strategic reserve coordination among consuming nations and clearer military objectives limiting infrastructure damage.
Market participants had greater confidence in conflict duration and scope compared to earlier Persian Gulf engagements. In addition, oil price trade dynamics played crucial roles in shaping investor expectations.
Recent precedents demonstrate evolving market sensitivity. Following the September 2019 Abqaiq and Khurais facility attacks, Brent crude surged 19.5% in a single session, advancing from $60.26 to $71.95 per barrel. This reaction occurred despite Saudi Arabia's rapid production restoration capabilities and significant global spare capacity buffers.
Trading volume amplification during geopolitical events typically ranges between 150-300% above baseline levels, according to CME Group historical data. Futures markets experience particular stress during initial conflict announcements, with institutional and algorithmic trading systems responding to news flow within microseconds.
Economic Transmission Pathways
Energy price shocks propagate through economic systems via multiple channels, creating both direct and indirect inflationary pressures. Direct transmission occurs through gasoline, heating fuel, and electricity cost increases affecting approximately 7-8% of consumer price indices immediately.
However, secondary effects encompass transportation margins, manufacturing input costs, and agricultural production expenses. For instance, the US inflation dynamics reveal how energy costs amplify broader price pressures across economic sectors.
Transportation sectors face immediate margin compression during crude price spikes. Airlines typically experience 15-30% operating cost increases when crude oil advances $10-15 per barrel, forcing route optimisation and capacity adjustments. Shipping companies encounter similar pressures, particularly affecting just-in-time manufacturing supply chains dependent on predictable logistics costs.
Central bank policy responses become increasingly complex during supply-driven inflation episodes. Federal Reserve and European Central Bank communications during the 2019 energy price surge emphasised distinguishing between temporary supply disruptions and persistent demand-driven price pressures.
When big ASX news breaks, our subscribers know first
Strategic Infrastructure Vulnerabilities
What Makes the Strait of Hormuz Critical to Global Energy Security?
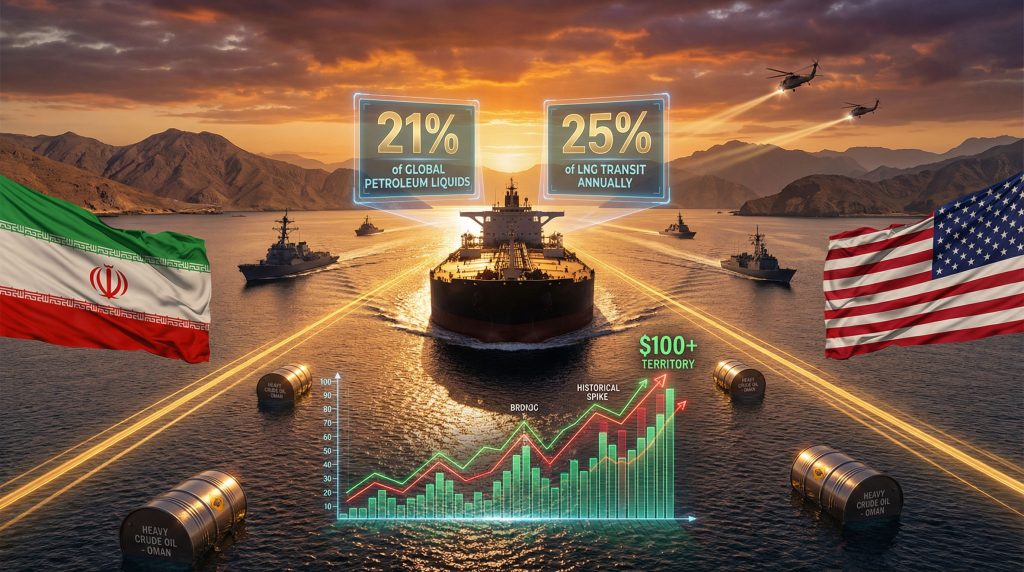
The Strait of Hormuz represents the world's most critical energy transit bottleneck, handling approximately 20-21% of globally traded crude oil and 20-25% of liquefied natural gas flows. This narrow waterway, measuring just 21 miles at its narrowest point, channels the energy exports of Saudi Arabia, UAE, Kuwait, Iraq, and Iran to Asian and European markets.
| Daily Transit Analysis | Volume | Global Share | Primary Origins |
|---|---|---|---|
| Crude Oil | 17.4 million barrels | 20.7% | Saudi Arabia, UAE |
| Natural Gas | 3.7 billion cubic feet | 25.2% | Qatar, Iran |
| Refined Products | 2.8 million barrels | 18.3% | Regional refineries |
Alternative routing scenarios impose significant cost and time penalties on global energy flows. The Cape of Good Hope diversion adds approximately 7,000-8,000 nautical miles to Middle East-Asia crude shipments, requiring an additional 24-30 days transit time at typical tanker speeds. This extended journey increases transportation costs by $2-3 per barrel and creates potential port congestion at alternative terminals.
Existing pipeline alternatives provide limited relief during Strait closures. Saudi Arabia's East-West pipeline system can transport approximately 5.5 million barrels daily to Red Sea terminals, while Egypt's Sumed pipeline handles 2.5 million barrels daily. However, these combined capacities represent less than 50% of normal Strait throughput, highlighting infrastructure bottlenecks in crisis scenarios.
Insurance market responses during geopolitical tensions demonstrate the financial amplification effects of perceived risk. War risk insurance premiums increased 100-300% during 2019 Gulf tensions, depending on vessel type and flag state. Lloyd's of London data indicates average premium increases of 0.25-0.50% of vessel value per transit during elevated threat periods.
Maritime Security Protocols
Naval response capabilities play crucial roles in maintaining energy flow continuity during regional conflicts. Operation Sentinel, established by the United States during 2019 tensions, provided escort services for commercial vessels transiting the Strait of Hormuz. This coalition framework reduced insurance premiums by 15-25% and maintained approximately 100 vessel daily transits during peak tension periods.
Vessel detention scenarios create cascading delays throughout global energy supply chains. Complete Strait closure would force extensive rerouting via Cape of Good Hope, adding 30-45 days to delivery schedules when including port queuing and alternative terminal congestion. Partial disruptions through selective vessel targeting could reduce throughput by 40-60%, based on historical precedent analysis.
Economic Modelling and Price Projections
Supply Disruption Scenario Framework
Current market conditions provide the foundation for analysing potential price trajectories during escalating US Iran war oil impact scenarios. With WTI crude trading near $70.59 per barrel as of recent sessions, technical analysis identifies key resistance levels around $77.65 that previously capped price advances in earlier cycles.
Baseline disruption scenarios anticipate 5-15% price appreciation assuming minimal infrastructure damage and maintained Strait navigation. This conservative estimate reflects current OPEC spare capacity buffers and strategic petroleum reserve availability across consuming nations. Market participants view this range as manageable within existing policy frameworks.
Moderate escalation scenarios target $76-84 per barrel ranges, representing 7.5%-18.9% appreciation from current levels. This projection assumes partial Strait restrictions affecting 30-45% of normal throughput, forcing alternative routing and creating temporary supply tightness. Historical precedent suggests markets can absorb such disruptions over 3-6 month timeframes with appropriate policy coordination.
Severe disruption modelling incorporates Iranian production losses of 3.2-3.8 million barrels daily, representing approximately 4% of global supply. Economic elasticity models developed by the International Energy Agency suggest such supply removal could drive prices toward $100+ territory, particularly if spare capacity deployment faces technical or political constraints.
Extreme scenario projections, while receiving attention from Iranian officials suggesting $200 per barrel potential, lack credible analytical foundation in peer-reviewed energy economics. No major modelling institution projects such outcomes for described conflict scenarios, indicating these represent negotiating positions rather than economic forecasts.
Demand Response Mechanisms
Consumer behaviour during energy price shocks follows predictable patterns established through decades of crisis analysis. Historical data indicates fuel demand reduction of 5-12% during sustained price increases above $80 per barrel, achieved through reduced discretionary travel, improved efficiency practices, and substitution toward alternative transportation modes.
Strategic petroleum reserve releases provide governments with short-term supply augmentation tools. IEA member nations collectively maintain approximately 120-180 million barrels available for coordinated emergency releases, representing 60-90 days of forward consumption buffer. The effectiveness of such releases depends on timing, scale, and market communication strategies.
Industrial demand adjustments occur more gradually but demonstrate significant long-term elasticity. Manufacturing sectors can substitute away from petroleum-based inputs over 6-18 month periods, while power generation facilities may increase coal utilisation during sustained crude price elevation.
Broader Economic Reverberations
Currency and Financial Market Interactions
Energy price volatility creates complex interactions across global financial markets, affecting currency valuations, commodity correlations, and capital flow patterns. Oil-exporting nations experience current account improvements during price spikes, strengthening their currencies and increasing sovereign wealth fund investment capabilities.
Conversely, major importing economies face balance of payments pressures requiring policy responses. Moreover, gold safe haven insights become particularly relevant during energy crisis periods when investors seek portfolio diversification.
Safe haven asset flows during geopolitical tensions typically favour gold, Swiss francs, and US Treasury securities. The 2019 Saudi Aramco attacks triggered $25 billion in equity market outflows within 48 hours, with corresponding inflows to perceived stability assets. These patterns reflect institutional risk management protocols during uncertainty periods.
Emerging market vulnerabilities become pronounced during energy price shocks, particularly for oil-importing developing economies. Current account deficits widen rapidly, forcing central bank intervention to prevent currency depreciation and imported inflation acceleration. Historical analysis indicates emerging markets require 12-24 months to fully adjust to sustained energy price increases.
How Do Different Sectors Respond to Energy Price Shocks?
Transportation industries face immediate margin compression during crude price escalation. Airlines experience disproportionate impacts, with fuel costs representing 20-30% of operating expenses. Route profitability calculations require constant adjustment, affecting capacity planning and pricing strategies.
Long-haul international routes become particularly vulnerable to sustained energy cost increases. Furthermore, the energy transition to renewables may accelerate during periods of oil price volatility.
Chemical and petrochemical sectors encounter feedstock cost volatility affecting production economics. Integrated refiners with both crude processing and chemical manufacturing benefit from improved crack spreads, while pure-play chemical producers face margin pressure. These dynamics influence global manufacturing competitiveness and trade flow patterns.
Agricultural commodity markets experience delayed but significant impacts through fertiliser and transportation cost channels. Nitrogen fertiliser production requires substantial natural gas inputs, while distribution networks depend on diesel fuel for logistics. Food price inflation typically manifests 6-12 months after initial energy price increases.
Government Policy Response Frameworks
Strategic Reserve Coordination
International Energy Agency protocols provide structured frameworks for coordinated emergency response during supply disruptions. Member nations can collectively release 120-180 million barrels from strategic reserves, representing significant market intervention capacity. Historical effectiveness varies based on release timing, market communication, and follow-through commitments.
The United States Strategic Petroleum Reserve maintains approximately 714 million barrels as of recent assessments, providing substantial intervention capability during crisis periods. Release mechanisms can deliver 4.4 million barrels daily for 90-day periods, though sustained drawdowns require congressional authorisation for extended operations.
Regional cooperation frameworks demonstrate varying effectiveness during energy security crises. Asian consumers have developed bilateral sharing arrangements, while European Union mechanisms provide collective response capabilities. These institutional arrangements influence market expectations regarding policy support during disruption scenarios.
Monetary Policy Considerations
Central bank responses to supply-driven inflation create complex policy trade-offs between price stability and economic growth objectives. The Federal Reserve's framework distinguishes between temporary supply shocks and persistent demand-driven inflation, influencing interest rate decision-making during energy crises.
Communication strategies become crucial during energy-driven inflation episodes. Clear central bank guidance regarding policy intentions helps anchor inflation expectations and prevents secondary price effects. Historical analysis indicates credible commitment to price stability reduces energy shock transmission to broader price indices.
Historical Precedent Analysis
Comparative Conflict Outcomes
The Iran-Iraq War (1980-1988) provides extensive precedent for analysing prolonged Middle East conflicts affecting energy markets. During the "Tanker War" phase, sustained crude prices of $40-60 per barrel (inflation-adjusted) persisted for multiple years, demonstrating market adaptation to chronic supply uncertainty.
Regional conflict resolution patterns suggest 6-12 month normalisation periods following ceasefire agreements. The 1991 Gulf War demonstrated rapid price correction once infrastructure damage assessments confirmed limited production capacity loss. Market confidence restoration depends critically on credible conflict termination and reconstruction timelines.
Recent regional tensions during 2019-2020 produced temporary 8-12% price premiums that dissipated as diplomatic solutions emerged. These episodes highlight market sensitivity to escalation signals while demonstrating resilience during effective crisis management. Additionally, understanding potential war economic impacts helps frame current policy discussions.
Investment flow patterns during and after regional conflicts reveal long-term structural adjustments. Foreign direct investment in Middle East energy projects typically requires 24-36 months to resume normal levels following major conflicts, reflecting insurance market caution and political risk assessment frameworks.
The next major ASX story will hit our subscribers first
Structural Market Evolution
Energy Security Rebalancing
Long-term supply chain diversification accelerates during regional energy crises, as consuming nations seek reduced dependence on geopolitically sensitive sources. North American shale production, Norwegian offshore development, and South American conventional resources benefit from sustained Middle East uncertainty.
Subsequently, the renewable energy transition receives crisis-driven policy support during energy security episodes. European Union renewable targets gained momentum following Russian supply disruptions, while Asian nations accelerated domestic energy development programs.
These structural shifts create permanent demand reductions for conventional petroleum products. Strategic alliance formations among consuming nations develop institutional frameworks for coordinated emergency response. These arrangements include sharing agreements, joint reserve facilities, and standardised crisis communication protocols.
Risk Premium Evolution
Permanent risk premiums embedded in forward price curves reflect market assessment of chronic geopolitical uncertainty. Analysis suggests $5-10 per barrel "conflict insurance" becomes incorporated in long-term pricing during sustained regional tensions. These premiums persist until credible stability frameworks emerge.
Investment pattern shifts favour politically stable production regions, affecting global capital allocation across energy projects. Enhanced oil recovery technologies and alternative fuel development programs receive accelerated funding during crisis periods, creating technological advancement opportunities.
Technology acceleration encompasses both conventional extraction improvements and renewable energy alternatives. Crisis-driven innovation funding creates breakthrough potential in energy storage, grid management, and carbon capture applications.
Long-term Market Implications
What Are the Permanent Changes from Energy Security Crises?
The US Iran war oil impact extends beyond immediate price volatility, creating structural changes in global energy architecture. Market participants increasingly prioritise supply security over cost optimisation, leading to permanent shifts in sourcing strategies and infrastructure development.
"Critical Market Assessment": While immediate price reactions to regional military escalation could drive crude toward $80-90 per barrel, sustained increases above $100 require either prolonged supply disruptions affecting multiple producer nations or infrastructure damage significantly reducing global production capacity.
The intersection of geopolitical risk and fundamental market forces creates dynamic equilibrium conditions requiring constant reassessment. Current spare capacity buffers, strategic reserve availability, and demand response mechanisms provide substantial stability anchors, though prolonged conflicts can overwhelm these natural market corrections.
Market participants must balance immediate volatility management with longer-term structural adaptation strategies, recognising that energy security considerations increasingly influence investment decisions across multiple economic sectors. The evolution toward enhanced supply diversification and renewable alternatives continues regardless of short-term price movements, suggesting permanent shifts in global energy architecture emerging from current tensions.
Ready to Capitalise on Energy Market Volatility?
Discovery Alert's proprietary Discovery IQ model delivers real-time alerts on significant ASX mineral discoveries, instantly empowering subscribers to identify actionable opportunities ahead of the broader market during periods of commodity price volatility. Begin your 14-day free trial today and secure your market-leading advantage whilst energy markets reshape investment landscapes.