August 21, 2026
When Chokepoints Become Weapons: Understanding the Oil Market Shock Reshaping Global Energy
Few concepts in global energy economics carry as much weight as the phrase "chokepoint risk." For decades, analysts modelled scenarios in which a single maritime corridor could bring the world's most traded commodity to its knees. As of mid-2026, that scenario is no longer theoretical. The US-Iran war oil supply disruption now sits at the centre of the most significant structural energy shock since the 1970s oil embargoes, and the implications extend far beyond weekly crude price movements.
Understanding this crisis requires moving past the headline numbers and examining the deeper mechanics of how conflict geography, market psychology, and physical supply constraints interact to create conditions that conventional economic buffers struggle to contain.
When big ASX news breaks, our subscribers know first
The Geography of Vulnerability: Why Does This Conflict Hit Differently?
Not all geopolitical oil shocks are created equal. What separates the current US-Iran conflict from previous Middle Eastern tensions is the simultaneous disruption of both production capacity and transit infrastructure. When a single conflict zone overlaps with the world's most consequential energy chokepoint, the compounding effect is severe.
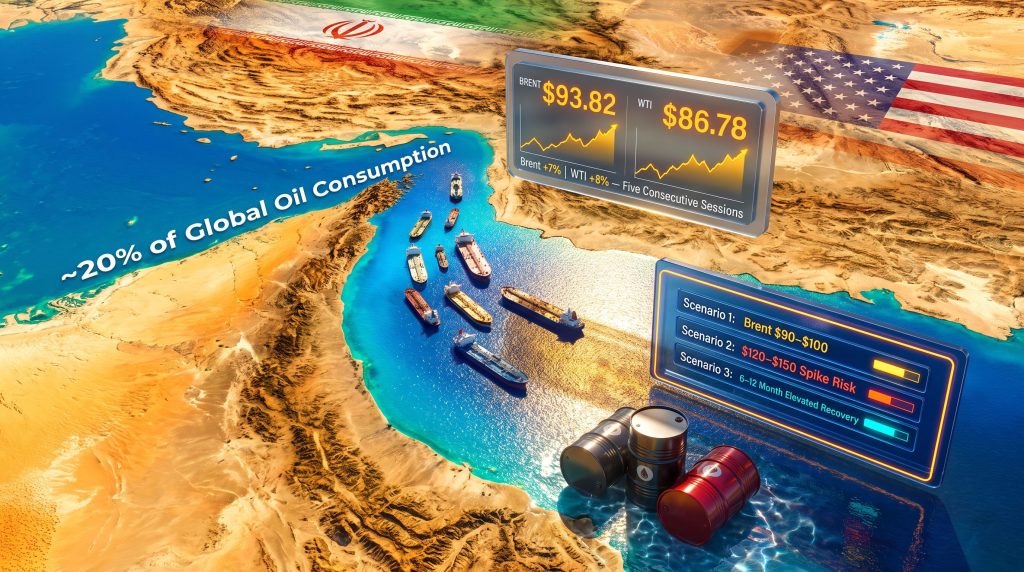
The Strait of Hormuz, a narrow passage connecting the Persian Gulf to the Arabian Sea, served as the transit route for approximately one-fifth of global daily oil consumption before the war began on February 28, 2026, when US and Israeli forces launched military strikes on Iran. Alongside oil, significant volumes of liquefied natural gas from Qatar also moved through this corridor. Tehran's subsequent blockade of the waterway transformed what had been an abstract vulnerability in energy security planning into an acute operational crisis for importers worldwide.
The conflict timeline unfolded rapidly. Within weeks of initial strikes, Iranian attacks on energy facilities across the broader Middle East compounded the direct supply loss from Hormuz restrictions. A peace deal that briefly offered hope of de-escalation expired without either side making any attempt to restart negotiations. By mid-August 2026, shipping traffic through the Strait had collapsed to just nine vessel transits per day, a figure that represents a fraction of pre-war throughput levels.
Critical Context: The strategic brilliance, from Iran's perspective, of a Hormuz blockade lies in its asymmetry. Iran does not need to match US military capabilities to inflict severe economic pain. Restricting a 34-kilometre-wide waterway with mines, coastal missile batteries, and naval harassment creates a disproportionate disruption relative to the resources required to sustain it.
Furthermore, the broader context of oil trade and geopolitics makes clear that this type of chokepoint vulnerability has long been a latent risk in global energy architecture, one that markets systematically underpriced for decades.
Quantifying the US-Iran War Oil Supply Disruption
Measuring the precise scale of the disruption requires careful attention to methodology, because different analytical frameworks produce meaningfully different estimates.
| Disruption Metric | Estimated Scale | Measurement Basis |
|---|---|---|
| Peak daily barrels disrupted | 11 to 20 million bbl/day | Shipping flow and production data |
| Energy infrastructure assets damaged | 40+ facilities | Field damage assessments |
| Strait of Hormuz vessel transits (wartime) | ~9 vessels/day | Real-time shipping data |
| Pre-war Hormuz throughput | ~20% of global consumption | IEA baseline estimates |
| Brent crude range during peak disruption | $93 to $100+ per barrel | Futures market data |
The wide 11 to 20 million barrels per day range reflects genuine measurement uncertainty rather than analytical sloppiness. Shipping flow data captures the immediate reduction in tanker transits but misses barrels being redirected via alternative, longer routes. Production curtailment data at Gulf facilities reflects operational shutdowns but may not account for barrels stored onshore or released from strategic reserves.
The practical implication for investors and policymakers is that the lower end of the disruption range likely understates real market impact, while the upper end may overstate it during periods when emergency logistics compensate partially for flow losses. According to reporting by CNBC, this conflict has been characterised as the biggest oil supply disruption in history, a designation that underscores the unprecedented structural pressure being applied to global energy systems.
Saudi Arabia, Iraq, the UAE, and Kuwait: Collateral Damage to the Gulf's Output Backbone
One of the least widely appreciated dimensions of the current crisis is that the countries holding the majority of OPEC's market influence are themselves among the most operationally constrained. Iranian attacks on energy infrastructure across the Gulf region have forced output reductions from Saudi Arabia, Iraq, the UAE, and Kuwait, which collectively represent the primary reservoir of swing capacity that markets historically relied upon to absorb supply shocks.
This creates a structural trap with no clean exit. The conventional market stabilisation mechanism, where OPEC producers ramp up spare capacity to offset a disrupted supplier, cannot function when the producers holding that spare capacity face their own output constraints due to proximity to the conflict zone.
Oil Price Mechanics: Decoding the Weekly Trajectory
Brent crude futures were trading at $93.82 per barrel as of August 21, 2026, after gaining more than 7% over five consecutive sessions. West Texas Intermediate sat at $86.78 per barrel, having climbed more than 8% over the same period to reach its highest point since late July. Both benchmarks recorded a second consecutive week of gains driven primarily by supply-side anxiety rather than any uptick in demand.
The price behaviour reflects two distinct risk premia being priced simultaneously:
- Immediate supply loss premium – the physical shortfall of barrels reaching the market today.
- Duration uncertainty premium – the market's assessment of how long disruption will persist without a credible resolution pathway.
The second component is arguably the more consequential and harder to hedge. Short-duration supply shocks allow traders to draw down inventories and wait for normalisation. Prolonged stalemates, where neither side has both the willingness and the ability to end hostilities quickly, sustain elevated prices through a process of continuous repricing as resolution timelines extend further into the future.
Market commentary from analysts in late August 2026 highlighted that both the US-Israeli coalition and Iran appeared deeply entrenched in their positions, with no visible mechanism for de-escalation, and that crude prices were responding by grinding consistently higher rather than displaying the sharp spike-and-retreat pattern typical of shorter geopolitical flare-ups. This stalemate dynamic is structurally more damaging to energy markets than a decisive but brief conflict, because it eliminates the possibility of traders positioning for a quick resolution.
Investor Psychology Note: Markets consistently underprice the duration of geopolitical supply disruptions. The historical pattern across conflicts from 1973 to 2022 shows that initial price spikes are frequently followed by partial retreats as traders anticipate quick resolution, only for prices to re-accelerate as the conflict extends beyond initial forecasts. The current trajectory suggests markets may be repeating this pattern.
Economic Warfare as a Force Multiplier
Beyond the physical military dimension, the US government has deployed financial pressure as a complementary tool. US President Donald Trump threatened what he described as economic retaliation on an unprecedented scale against nations providing any form of economic support to Iran. The UAE responded by suspending all financial and economic transactions with Iran until further notice, a significant development given the historical commercial ties between Gulf Arab states and Tehran.
This secondary sanctions pressure adds a layer of complexity that extends the disruption beyond the physical oil supply chain. Trading houses, shipping insurers, and financial intermediaries that facilitate Iranian oil flows face direct exposure to US sanctions enforcement, creating a chilling effect on any transactions that might otherwise partially compensate for physical supply losses. Consequently, the oil market disruption risks extend well beyond the Strait itself into the broader architecture of global energy finance.
Regional Exposure: Who Bears the Greatest Economic Risk?
The distributional consequences of the US-Iran war oil supply disruption are deeply uneven across the global economy.
| Region | Gulf Oil Dependency | Primary Vulnerability |
|---|---|---|
| Asia (Japan, South Korea, India, China) | Very High | Refinery configuration; limited alternative routes |
| Europe | Moderate to High | Gulf refined products and LNG dependency |
| United States | Lower | Domestic production buffer; indirect price exposure |
| Developing Economies | Critical | Import dependence; limited fiscal shock absorbers |
Asian economies face the sharpest structural exposure. Japan and South Korea source the overwhelming majority of their crude imports from Gulf producers and have limited flexibility to rapidly reconfigure refinery inputs to accommodate different crude grades. India faces a similar challenge, compounded by the scale of its import volumes and fiscal constraints on fuel subsidy expansion.
China, while possessing more diversified supply relationships including Russian crude, still carries significant Gulf exposure and faces logistical complexity in rapidly scaling alternative sources. Developing economies occupy a particularly precarious position, as unlike advanced economies that can absorb higher import costs through fiscal mechanisms, import-dependent lower-income nations face direct transmission of oil price increases into inflation, current account deterioration, and potential social instability.
Qatar's LNG Disruption: The Hidden Second Shock
Significant attention has focused on crude oil flows, but the LNG dimension of the Hormuz blockade represents an underappreciated secondary shock. Qatar is among the world's largest LNG exporters, and a substantial portion of its export volumes transit the Strait of Hormuz. Force majeure declarations triggered by the operational shutdown of LNG export facilities create cascading contractual disruptions across long-term supply agreements with buyers in Europe and Asia.
Gas markets entered 2026 with tighter inventories than the prior year across key European storage facilities, meaning the LNG supply shock compounds an existing supply-demand imbalance rather than hitting a market with comfortable buffers. In addition, the geopolitical oil market dynamics shaping these events have been building over many years, making the current shock a culmination of longstanding structural vulnerabilities rather than a sudden aberration.
The next major ASX story will hit our subscribers first
Three Scenarios for Global Oil Markets
Scenario 1: Prolonged Stalemate (Base Case)
- Hormuz traffic remains severely constrained at low single-digit daily vessel transits
- Gulf producers maintain reduced output due to infrastructure damage and security constraints
- Brent sustains in the $90 to $100 per barrel range
- Emergency strategic reserve releases from IEA member nations provide partial relief but cannot close the structural gap
- Stalemate premium is repriced higher as resolution timelines extend
Scenario 2: Escalation to Broader Regional Conflict
- Additional energy infrastructure targeted across the Gulf, including refining capacity
- Shipping insurance markets seize, reducing tanker availability beyond the direct security threat
- Price spike potential reaching $120 to $150 per barrel
- Global recession risk escalates materially given the scale of the supply shock and its interaction with existing inflationary pressures
Scenario 3: Negotiated De-escalation and Ceasefire
- Hormuz traffic resumes gradually over weeks to months as confidence in security conditions rebuilds
- Restocking demand from severely depleted commercial inventories creates a secondary price support floor, preventing sharp price falls
- Prices decline from peak but remain elevated above pre-war levels for 6 to 12 months
- Structural investment in alternative supply corridors, rerouting infrastructure, and non-Gulf production accelerates materially
Important Disclaimer: Scenario modelling in conflict situations carries inherently high uncertainty. Price projections and timeline estimates represent analytical frameworks for understanding potential outcomes, not forecasts. Actual market outcomes will depend on military, diplomatic, and political developments that are not predictable with precision.
Furthermore, analysis from the Financial Post suggests that the US government itself anticipates supply disruptions extending through 2027, which, if accurate, would push the duration of the crisis well beyond what many market participants are currently pricing.
Adapting in Real Time: How Markets and Governments Are Responding
Emergency Strategic Reserve Releases and Their Limits
Coordinated releases from IEA member nations' strategic petroleum reserves represent the primary policy tool available to governments seeking to moderate price impacts in the short term. However, reserve releases carry well-understood limitations. They address inventory levels, not the underlying flow constraint. If Hormuz remains blocked, released barrels drawn from onshore storage must still reach refiners through alternative logistics chains that have limited throughput capacity.
The restocking problem that follows any eventual conflict resolution is also frequently underestimated by markets. Rebuilding commercial inventories and strategic reserves that have been drawn down during the disruption creates sustained demand above normal run-rate consumption for months after physical supply normalises. This inventory rebuild dynamic has historically prevented crude prices from returning quickly to pre-shock levels even after geopolitical triggers dissipate.
Tanker Rerouting: The Cost and Logistics Reality
Shipping operators attempting to bypass the Strait of Hormuz face a fundamental geographic problem. The only alternative for Gulf crude exports is transport overland via pipeline to Red Sea or Mediterranean terminals, and existing pipeline infrastructure cannot come close to handling volumes that previously moved by sea. Rerouting tankers entirely around the Arabian Peninsula adds thousands of nautical miles to voyage distances, increasing freight costs substantially and consuming tanker fleet capacity that would otherwise serve other trade routes.
Does the Renewable Energy Transition Offer a Long-Term Answer?
Every extended oil supply shock strengthens the long-term economic case for accelerating renewable energy deployment, particularly in import-dependent economies. The structural lesson of the current crisis, that extreme concentration of transit through a single geographical point creates catastrophic systemic risk, reinforces the energy security argument for domestic capacity development. The renewable energy transition offers import-dependent economies a structural path toward reducing chokepoint exposure over the longer term, even if it cannot resolve the immediate crisis.
Frequently Asked Questions: US-Iran War and Oil Supply
What is the Strait of Hormuz and why does it matter for global oil supply?
The Strait of Hormuz is a narrow maritime passage between Iran and Oman through which approximately one-fifth of the world's daily oil consumption and significant LNG volumes were transported before the current conflict. Its disruption creates immediate and severe pressure on global energy markets because no scalable alternative route exists.
How much oil supply has been disrupted?
Estimates range from approximately 11 million to 20 million barrels per day, depending on measurement methodology. More than 40 energy infrastructure assets across the region have been reported as damaged, compounding the transit disruption with direct production losses.
Why isn't OPEC spare capacity solving the problem?
The conflict directly affects Saudi Arabia, the UAE, Iraq, and Kuwait, which collectively hold the majority of OPEC's spare production capacity. Because these producers face their own operational constraints from infrastructure damage and regional instability, the conventional spare capacity pressure valve is largely unavailable.
How long could elevated prices persist after a ceasefire?
Based on the pattern of previous major supply disruptions, prices are likely to remain elevated above pre-war levels for 6 to 12 months beyond any ceasefire agreement, driven by inventory restocking demand, infrastructure repair timelines, and the slow rebuilding of shipping market confidence.
Which countries face the greatest economic exposure?
Asian economies including Japan, South Korea, India, and China face the highest structural exposure. Developing economies with import-dependent energy systems and limited fiscal reserves face the most severe economic vulnerability from sustained price increases.
Key Structural Takeaways for Energy Market Participants
- The concentration of approximately 20% of global oil transit through a single 34-kilometre waterway represents a systemic risk that markets chronically underpriced prior to the current conflict
- The simultaneous removal of supply and spare capacity from the same conflict zone eliminates the market's primary self-correction mechanism
- Stalemate conflicts, without a clear victor or rapid resolution, create more sustained and damaging price impacts than decisive short-duration military actions
- Post-disruption price recovery is structurally slower than markets typically anticipate due to inventory rebuild dynamics and infrastructure repair timelines
- The crisis is accelerating long-term structural conversations around energy security diversification, strategic reserve adequacy, and the geopolitical case for faster renewable energy transition in highly import-dependent economies
Readers seeking additional context on global oil market dynamics and geopolitical risk frameworks may find value in reviewing energy market analysis published by the International Energy Agency and Reuters Energy coverage, which track real-time developments in Middle East supply conditions and global crude benchmarks. This article contains forward-looking analysis and scenario projections that are inherently uncertain. Nothing in this article constitutes financial or investment advice.
Want to Identify the ASX Mineral Discoveries Reshaping Investment Portfolios?
As energy market volatility drives renewed interest in resource diversification, Discovery Alert's proprietary Discovery IQ model delivers real-time notifications on significant ASX mineral discoveries, transforming complex geological data into clear, actionable investment insights — explore historic discoveries and their extraordinary returns to understand the opportunity, then begin your 14-day free trial to position yourself ahead of the broader market.