July 15, 2026
The recent escalation of U.S.-Israel military actions against Iran has sent shockwaves through global energy markets, creating immediate supply disruption concerns and triggering significant price volatility across crude oil benchmarks. This oil price rally demonstrates how geopolitical tensions in critical producing regions continue to shape energy market dynamics.
Global energy markets operate within an intricate web of geopolitical dependencies, where regional conflicts can trigger cascading disruptions across supply chains, pricing mechanisms, and strategic reserve deployments. The interconnected nature of modern energy infrastructure means that military tensions in key producing regions create immediate ripple effects through international commodity markets, regardless of whether physical supply interruptions actually materialise.
Understanding how geopolitical risk translates into market volatility requires examining both the mechanical aspects of supply-demand dynamics and the psychological factors that drive speculative positioning. When energy infrastructure becomes threatened by military action, markets must price in not only immediate supply risks but also the potential for prolonged instability that could fundamentally reshape global energy flows.
Strategic Framework for Conflict-Driven Market Analysis
Energy security analysis has evolved beyond simple supply-demand calculations to incorporate complex risk assessment models that account for chokepoint vulnerabilities, insurance market disruptions, and coordinated strategic reserve responses. Modern frameworks must consider how threats to critical infrastructure can create supply constraints even without physical damage, as insurance cancellations and shipping route avoidance patterns demonstrate.
The 1973 Arab Oil Embargo provides a foundational case study for understanding how geopolitical tensions translate into price volatility. During this five-month period, oil prices increased approximately 300%, rising from around $3 per barrel to $12 per barrel as production declined by 5-10% globally.
This dramatic price response occurred despite the relatively limited scope of the embargo, which primarily targeted the United States, Netherlands, and supporting nations. The embargo demonstrated how coordinated political action could weaponise energy supplies effectively.
The Iran-Iraq War of 1980-1988 illustrated how prolonged regional conflicts can create sustained market volatility. Combined oil production from both nations fell from approximately 6 million barrels per day to near-zero during conflict peaks, with global prices fluctuating between $30-40 per barrel throughout the eight-year period.
Furthermore, the extended duration of this conflict demonstrated how markets must account for uncertainty about resolution timelines when pricing energy commodities. The sustained nature of this disruption reshaped global supply chains permanently.
During the 1990-1991 Gulf War, oil prices spiked from approximately $15 per barrel to $40 per barrel within days of Iraq's invasion of Kuwait. The removal of Kuwait's 1.5 million barrels per day from global markets created immediate supply concerns.
However, price normalisation occurred relatively quickly following the ceasefire, taking approximately 6-8 months. This rapid recovery highlighted how swift conflict resolution could restore market confidence efficiently.
Key Historical Price Response Patterns:
- Immediate spike phase: 50-300% price increases within first week of conflict escalation
- Volatility plateau: Sustained elevated pricing during uncertainty period
- Resolution tracking: Gradual price normalisation over 2-8 months post-conflict
- Market memory: Persistent risk premiums even after supply restoration
Modern energy interdependence differs significantly from historical patterns due to reduced demand elasticity, expanded strategic reserve coordination, and increased refining complexity. Current oil demand demonstrates elasticity of approximately 0.1-0.3 in the short term, compared to historical levels of 0.5-0.7.
This means prices must rise higher to achieve equilibrium when supply tightens. Consequently, modern markets experience more dramatic price swings during supply disruptions.
Strategic petroleum reserves now provide greater market stabilisation capacity, with the U.S. Strategic Petroleum Reserve holding over 400 million barrels and coordinated global reserves exceeding 1.5 billion barrels. However, refining complexity has created new vulnerabilities, as modern facilities require specific crude grades that cannot be easily substituted during supply disruptions.
When big ASX news breaks, our subscribers know first
Technical Mechanics of Oil Price Surge Dynamics
Current market conditions following escalated U.S.-Israel military actions against Iran demonstrate classic conflict-driven price surge patterns. These oil price movements reflect both fundamental supply concerns and speculative positioning adjustments.
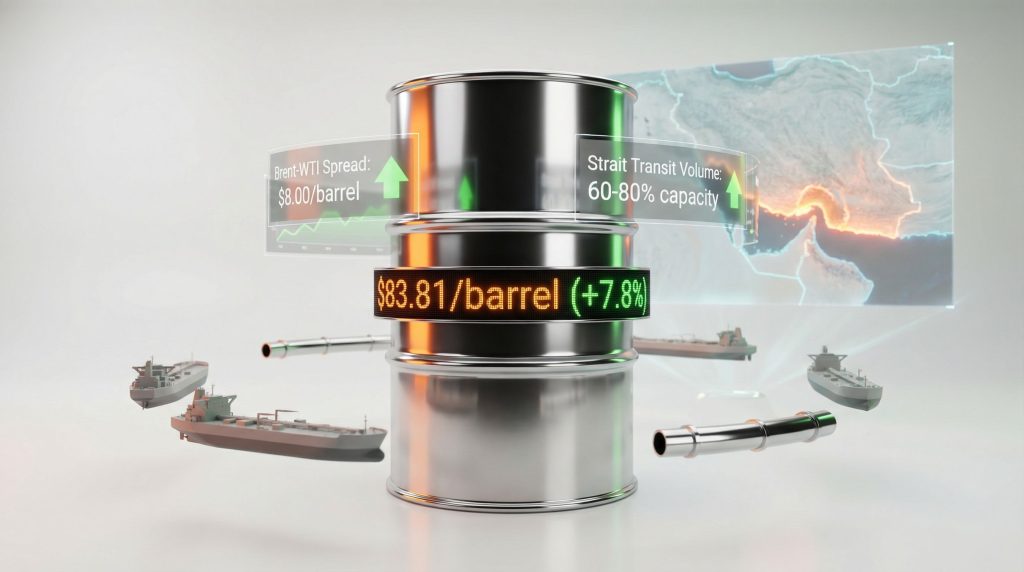
Brent crude has surged to $83.81 per barrel, representing a 7.8% increase from baseline levels around $77.74, while WTI crude reached $77.23 per barrel, marking an 8.4% jump from approximately $71.23. These gains occurred within consecutive trading sessions following initial conflict reports.
Both benchmark crude prices entered technically overbought territory, with Relative Strength Index indicators exceeding 70 for consecutive trading sessions. This condition signals maximum fear pricing but historically can persist during genuine supply threats for 2-4 weeks before market reversion occurs.
Current Technical Indicators:
| Metric | Previous Level | Current Level | Change |
|---|---|---|---|
| Brent Crude | $77.74/barrel | $83.81/barrel | +7.8% |
| WTI Crude | $71.23/barrel | $77.23/barrel | +8.4% |
| Brent-WTI Spread | $4.00/barrel | $8.00/barrel | +100% |
| RSI Indicator | <70 | >70 | Overbought |
The expansion of the Brent-WTI differential to $8.00 per barrel from a baseline of approximately $4.00 reflects Brent's greater exposure to Middle Eastern supply disruption risk. In contrast, WTI demonstrates relative insulation through North American production sources.
When this premium exceeds $4 per barrel, it creates arbitrage opportunities that support increased U.S. crude exports. This dynamic helps moderate WTI pricing while maintaining Brent premiums during regional conflicts.
What Drives Immediate Price Surge Mechanisms?
Price surge mechanisms operating during the current crisis involve multiple concurrent factors. The Strait of Hormuz transit capacity has fallen to 60-80% of normal levels due to vessel avoidance and insurance cancellations.
This creates a 20-40% reduction in available transit capacity. Given that approximately 20% of global oil transits this waterway, representing roughly 18 million barrels per day of the global 90 million barrels per day supply, this reduction translates to 3.6-7.2 million barrels per day of supply uncertainty.
Insurance market disruption has created a de facto supply constraint independent of physical blockade actions. Insurers have cancelled standard coverage for vessels transiting the Strait of Hormuz rather than merely increasing premiums.
This effectively eliminates insurance availability required for international maritime law compliance and lender requirements. Moreover, this oil futures analysis reveals how forward curve distortions amplify current supply constraints.
Market psychology amplifies these mechanical factors through momentum-driven positioning and forward curve distortions. Three consecutive days of price gains create cumulative momentum effects, while contango conditions in forward markets encourage physical inventory building.
Furthermore, this inventory building behaviour further constrains available supply by reducing immediately accessible crude oil stocks. Professional traders and hedge funds often amplify these trends through algorithmic positioning strategies.
Critical Chokepoint Infrastructure Vulnerabilities
The Strait of Hormuz represents the world's most strategically important energy transit corridor, handling approximately 20% of global oil flows plus significant liquefied natural gas volumes. The strait's narrowest passage spans only 21 nautical miles, with shipping confined to 2-nautical-mile-wide channels.
Iranian threats reported through state media indicate intentions to fire on vessels attempting passage through the waterway. While these threats have not been executed as of early March 2026, their credibility has proven sufficient to trigger widespread insurance cancellations.
The threats have also prompted shipping route modifications that create immediate commercial impact. Container shipping and tanker operators have begun implementing precautionary measures that effectively reduce transit capacity.
Strait of Hormuz Traffic Analysis:
- Normal capacity: 18-21 million barrels per day oil equivalent
- Current operational level: 60-80% of normal capacity
- LNG component: Approximately 21% of global seaborne LNG
- Geographic alternatives: Cape of Good Hope route adds 4,000-6,000 nautical miles
Alternative routing through the Cape of Good Hope requires additional 14-21 days transit time and increases fuel costs by 200-400% due to extended voyage requirements. This rerouting also reduces global tanker fleet availability since longer voyage cycles mean fewer vessels available for charter globally.
Insurance market responses demonstrate how threats to shipping security create immediate commercial impact independent of physical supply loss. Marine insurance is mandatory for vessel financing, international maritime law compliance, and port authority entry requirements.
Protection and Indemnity Club coverage cancellations effectively halt commerce even when ships could physically transit threatened waterways. The insurance industry's risk-averse approach during conflicts creates supply bottlenecks regardless of actual military action.
LNG terminals in Qatar, UAE, and Oman account for approximately 60% of global LNG supply, with all three nations dependent on Strait of Hormuz transit for export access. Unlike oil shipments, LNG cannot be easily rerouted due to specialised carrier requirements.
Additionally, the absence of alternative pipeline infrastructure means LNG supply chains face complete disruption during strait closures. This creates cascading effects through global natural gas markets that extend far beyond crude oil impacts.
Port facilities downstream of the strait, including major terminals in Jebel Ali, Fujairah, and Ras Al Khaimah, handle over 50 million barrels per day of storage and transshipment operations. Strait closure would trap inventory in these facilities while preventing upstream production from reaching export terminals.
Regional Storage Vulnerability:
- Gulf state storage capacity: 500+ million barrels aggregate
- Daily throughput: 50+ million barrels via major terminals
- Inventory trapped: Entire downstream storage network during closure
- Production backup: Upstream facilities cannot evacuate output
Military Escalation Impact on Energy Market Fundamentals
Military operations create both immediate supply disruption risks and longer-term structural changes to energy market fundamentals. Current U.S.-Israel military actions against Iran have triggered responses that extend beyond the primary conflict zone.
Iranian strikes against energy infrastructure in Gulf countries and attacks on tankers demonstrate how regional conflicts rapidly expand their geographic impact. The U.S.-Israel conflict with Iran shows how military escalation can trigger broader regional instability.
Supply disruption modelling must account for multiple escalation scenarios with varying probability distributions and duration estimates. Immediate supply interruption occurs through shipping route avoidance and insurance cancellations, while sustained supply loss requires physical infrastructure damage.
Market psychology during military conflicts operates through fear premium calculations that can persist independently of actual supply losses. Research indicates that geopolitical risk adds $5-15 per barrel to crude prices regardless of physical supply disruption.
Escalation Scenario Framework:
- Shipping disruption: Insurance cancellations and route avoidance (current status)
- Infrastructure targeting: Attacks on port facilities and storage terminals
- Production shutdown: Facility closures due to security concerns
- Regional expansion: Conflict spreading to additional producing nations
Strategic petroleum reserve deployment becomes a critical policy tool during supply disruptions. The International Energy Agency coordinates emergency sharing protocols among member nations, while individual countries can release reserves to moderate price spikes.
However, reserve effectiveness depends on coordination timing and available refining capacity to process released crude. Strategic reserves cannot immediately replace all disrupted supplies due to logistical constraints and crude quality specifications.
How Do Demand-Side Responses Affect Energy Markets?
Demand-side responses to energy security threats involve both immediate conservation measures and longer-term substitution patterns. Industrial consumers may reduce petrochemical production, shipping companies can implement slow-steaming protocols to conserve fuel.
Power generators can switch to alternative fuels where available, though these substitutions often require weeks or months to implement fully. The flexibility of demand response varies significantly across sectors and geographic regions.
Transportation sectors demonstrate limited short-term demand elasticity, as fuel consumption patterns cannot adjust quickly to price changes. However, industrial users often possess greater flexibility to reduce consumption during extreme price volatility periods.
Economic Multiplier Effects Through Energy Price Transmission
Energy price volatility creates cascading economic effects through inflation transmission mechanisms, currency market disruptions, and investment flow redirections. Transportation and logistics sectors experience immediate cost pressures, while manufacturing industries face input cost adjustments.
These cost adjustments eventually reach consumer prices through complex supply chain interactions. The tariffs economic implications demonstrate how trade policy intersects with energy price transmission during geopolitical conflicts.
Inflation transmission occurs through multiple channels, including direct energy costs for transportation fuel and heating, indirect effects through supply chain cost increases, and second-order impacts from wage adjustments. Historical analysis indicates that 10% oil price increases typically translate to 0.2-0.4% increases in core inflation over 12-18 months.
Energy Price Transmission Channels:
- Direct effects: Petrol, heating oil, and electricity price increases
- Indirect effects: Transportation and logistics cost pass-through
- Second-order effects: Wage pressures and monetary policy adjustments
- Substitution effects: Demand shifting toward alternative energy sources
Currency markets respond to energy price shocks through multiple mechanisms. Oil-importing nations typically see currency weakening due to increased import costs, while energy-exporting countries benefit from improved trade balances.
The U.S. dollar often strengthens during energy crises due to its reserve currency status and relative energy independence. This strength can moderate energy price impacts for American consumers while amplifying costs for other nations.
Investment flow redirection accelerates during energy security crises as capital seeks either defensive positioning or opportunistic exposure to energy price volatility. Energy sector equity performance during military conflicts demonstrates significant dispersion.
Upstream producers benefit from higher commodity prices while downstream refiners and transportation companies face margin pressures. This divergence creates sector rotation opportunities within energy equity markets.
Petrodollar recycling patterns intensify during price spikes as energy-exporting nations accumulate foreign currency reserves that require reinvestment. This capital typically flows toward government bonds, real estate, and infrastructure investments in developed markets.
Conflict Resolution Timeline Impact on Market Recovery
Energy markets demonstrate distinct price patterns depending on conflict resolution scenarios, with recovery timelines varying significantly based on infrastructure damage, production capacity restoration, and shipping route normalisation. Understanding these patterns helps investors and policymakers calibrate appropriate response strategies.
Scenario 1: Rapid Conflict Resolution (2-4 weeks)
Price normalisation typically occurs within 6-8 weeks of ceasefire agreements when conflicts resolve quickly without significant infrastructure damage. Strategic reserve releases can accelerate this timeline by providing immediate supply buffers while commercial shipments resume normal routing.
Insurance market stabilisation requires separate timeline consideration, as coverage restoration often lags behind physical security improvements. Vessel operators typically wait for explicit all-clear signals from insurance providers before resuming normal routing through previously threatened waterways.
Scenario 2: Prolonged Regional Instability (3-6 months)
Extended conflicts create sustained market volatility with periodic price spikes during escalation episodes. Strategic reserve depletion becomes a concern if coordinated releases exceed 1-2 million barrels per day over multiple months.
This potentially requires inventory rebuilding that supports elevated prices. Alternative supply source activation accelerates during prolonged instability, with unused production capacity brought online and long-term supply contracts renegotiated.
This process typically requires 2-4 months for meaningful capacity additions. However, the oil production impact shows how supply responses can vary significantly based on regional production capabilities.
Scenario 3: Expanded Conflict Zone (6+ months)
Prolonged multi-regional conflicts trigger fundamental energy architecture restructuring as importers prioritise supply security over cost optimisation. Permanent supply chain diversification investments typically begin 4-6 months after conflict onset when temporary measures prove insufficient.
Recovery Timeline Indicators:
| Phase | Duration | Key Markers | Price Impact |
|---|---|---|---|
| Immediate | 1-2 weeks | Ceasefire agreements | -10 to -20% |
| Stabilisation | 2-6 weeks | Route resumption | -20 to -40% |
| Normalisation | 2-4 months | Inventory rebuilding | -40 to -60% |
| New equilibrium | 6+ months | Contract renegotiation | Variable |
The next major ASX story will hit our subscribers first
Risk Management Strategy Evolution During Energy Crises
Corporate energy procurement strategies undergo rapid adaptation during geopolitical conflicts as companies balance cost management with supply security requirements. Traditional hedging approaches often prove inadequate during extreme volatility periods, necessitating more sophisticated risk management frameworks.
Hedging strategy modifications typically involve expanding time horizons and adjusting strike prices to account for elevated volatility environments. Companies may increase the percentage of future consumption hedged while accepting higher premium costs to secure price certainty.
Supply contract force majeure considerations become critical during conflicts affecting major producing regions. Legal teams must evaluate whether supply disruptions constitute force majeure events that excuse contract performance, while procurement teams simultaneously seek alternative supply sources.
Corporate Risk Management Adaptations:
- Extended hedging horizons: 12-24 months vs. typical 3-6 months
- Increased hedge ratios: 70-90% vs. typical 50-70% coverage
- Diversified supplier portfolios: Multiple source countries and routes
- Emergency fuel reserves: 30-90 day inventory buffers vs. just-in-time delivery
National energy security response frameworks activate coordinated mechanisms designed to moderate price volatility and maintain strategic fuel supplies. The International Energy Agency emergency response protocols enable member nations to coordinate strategic reserve releases.
These protocols also facilitate demand reduction measures during major supply disruptions. Central bank intervention in energy commodity markets represents an unconventional but occasionally deployed policy tool during extreme price volatility.
While central banks typically avoid direct commodity market intervention, extreme circumstances may warrant coordinated action to prevent destabilising economic impacts. Government fuel subsidy programmes often expand during energy crises to moderate consumer price impacts.
However, these policies create fiscal costs and may interfere with market-driven demand destruction that helps restore supply-demand balance. The timing and scale of such interventions significantly influence market recovery patterns.
Market-Based Conflict Resolution Indicators
Energy commodity markets provide real-time indicators of geopolitical conflict probability and resolution expectations through futures curve structures, options market positioning, and cross-commodity correlation patterns. These indicators often provide earlier signals than traditional diplomatic or military intelligence sources.
Futures curve contango patterns typically indicate market expectations of temporary supply disruptions, with prices declining over time as normal supply conditions are expected to resume. Conversely, backwardation suggests market belief in sustained supply constraints requiring immediate consumption reduction.
Options market volatility analysis reveals the market's assessment of tail-risk scenarios through skew patterns and implied volatility surfaces. Aggressive call option purchasing typically indicates institutional preparation for further price escalation, while put option activity may signal expectations of rapid resolution.
Technical Market Indicators:
- Futures curve structure: Contango vs. backwardation patterns
- Options volatility skew: Tail-risk assessment through option pricing
- Cross-commodity correlations: Gold-oil relationships during uncertainty
- Currency market signals: Safe-haven flows and energy-currency correlations
Presidential and diplomatic communications create immediate market responses that can be quantified through event studies of price movements following official statements. Markets typically interpret conciliatory language as conflict de-escalation signals while aggressive rhetoric triggers renewed volatility.
Military operation timeline expectations become embedded in forward market pricing as traders attempt to anticipate conflict duration and resolution probability. These expectations adjust rapidly based on battlefield developments and diplomatic progress indicators.
Furthermore, institutional positioning data from regulatory filings provides insights into professional money manager expectations about conflict duration and price trajectory. Large-scale position changes often precede significant price movements by several trading sessions.
Long-term Structural Energy Market Transformation
Geopolitical energy crises accelerate structural changes in global energy systems that persist long after immediate conflicts resolve. Supply chain resilience enhancement becomes a permanent feature of energy market architecture as importers prioritise security alongside cost optimisation.
Diversification strategies for energy import portfolios expand beyond traditional supplier relationships to incorporate geographic, political, and infrastructure risk assessments. This evolution creates opportunities for previously marginal suppliers while reducing market share for traditional major exporters.
Regional energy hub development initiatives gain political and financial support during crises as nations seek to reduce dependence on vulnerable chokepoints. These investments typically require 3-7 years for completion but create permanent changes to global energy flow patterns.
Long-term Infrastructure Impacts:
- Alternative pipeline routes: Bypassing traditional chokepoints
- Expanded storage capacity: Strategic and commercial inventory buffers
- Renewable acceleration: Reduced import dependence through domestic production
- Regional cooperation: Bilateral and multilateral energy security agreements
Technology acceleration patterns demonstrate how security concerns can override economic considerations in energy investment decisions. Renewable energy deployment urgency increases during fossil fuel supply crises, while energy efficiency investments receive enhanced political and financial support.
Energy diplomacy emerges as a conflict prevention mechanism through bilateral cooperation frameworks and regional energy security alliances. These arrangements create economic incentives for political stability while providing alternative supply arrangements during future disruptions.
In addition, climate policy acceleration often occurs during energy security crises as governments recognise the strategic vulnerability created by fossil fuel import dependence. This dynamic can permanently alter energy investment priorities and regulatory frameworks.
Understanding how geopolitical conflicts reshape energy market dynamics requires analysis of both immediate price mechanisms and longer-term structural adaptations. Current U.S.-Israel military actions against Iran demonstrate classic patterns of conflict-driven market volatility, while also highlighting how modern energy infrastructure vulnerabilities can create supply constraints.
These constraints operate independent of physical damage through insurance market responses and shipping route modifications. The interconnected nature of global energy systems means that regional conflicts can trigger worldwide supply chain disruptions with lasting economic implications.
Featured Insight: Oil prices typically surge 5-15% during Middle East military conflicts due to supply disruption fears, shipping route closures, and market speculation. The Strait of Hormuz, handling 20% of global oil transit, becomes a critical vulnerability. Historical patterns show prices peak within 2-4 weeks of conflict escalation, then gradually normalise as alternative supply routes activate and strategic reserves deploy.
Disclaimer: This analysis contains forward-looking statements and speculative scenarios regarding geopolitical developments and energy market impacts. Actual outcomes may differ significantly from projections presented. Investment decisions should not be based solely on this analysis, and readers should consult qualified financial advisors before making energy-related investments.
Ready to capitalise on energy market volatility during geopolitical crises?
Discovery Alert's proprietary Discovery IQ model delivers real-time alerts on significant ASX mineral discoveries, helping investors identify actionable opportunities during periods of market uncertainty and commodity price volatility. Begin your 14-day free trial today to gain a market-leading edge when energy sector disruptions create new investment opportunities across the resources sector.