May 19, 2026
Understanding the Fundamental Cost Structure of US LNG Operations
The global LNG market operates within a complex web of cost structures, regulatory frameworks, and operational constraints that determine export viability. At the heart of this system lies a fundamental economic calculation: the spread between production costs and delivered prices must cover the entire value chain from wellhead to end consumer. Recent market dynamics have created unprecedented pressure on these margins, forcing operators to reassess their strategic positioning within an evolving competitive landscape where us lng margins tighten on higher henry hub prices.
Base Input Costs and Liquefaction Economics
Feedgas costs represent the largest variable component in US LNG production, with Henry Hub pricing serving as the primary reference point. According to recent market data, the front-month Henry Hub price reached $5.06/MMBtu on December 4, 2025, representing nearly a three-year high that has significantly compressed export margins.
Furthermore, the typical long-term contract structure reflects this cost dynamic through a formula of 115% of Henry Hub plus $3.00/MMBtu liquefaction fee. This pricing mechanism ensures operators receive cost recovery while maintaining operational flexibility during volatile market periods.
| Component | Range ($/MMBtu) | Volatility Profile |
|---|---|---|
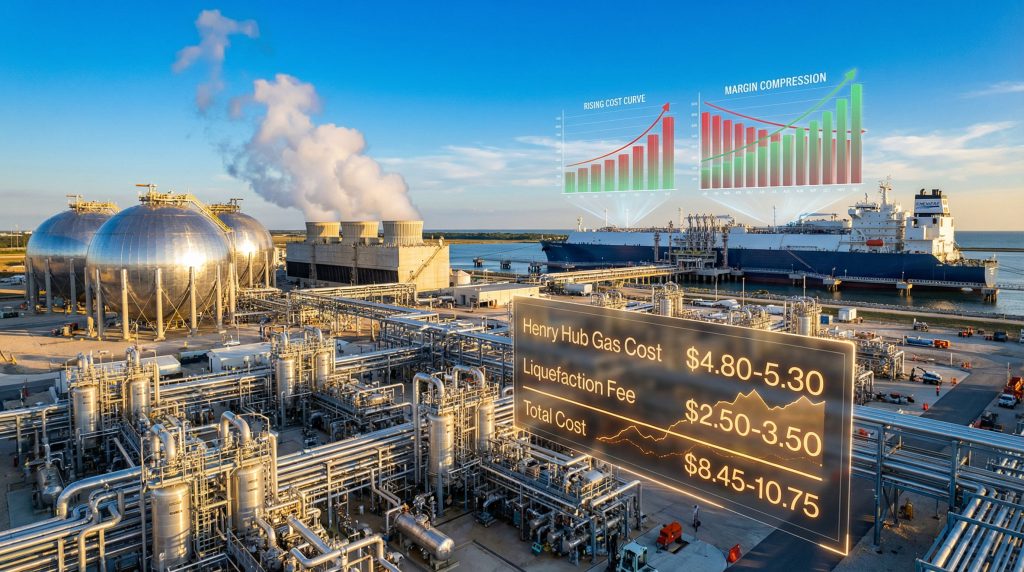
| Henry Hub Gas Cost | $4.80-5.30 | High – weather/demand driven |
| Liquefaction Fee | $2.50-3.50 | Low – infrastructure fixed cost |
| Pipeline Transport | $0.20-0.50 | Medium – capacity constraints |
| Loading/Terminal | $0.15-0.25 | Low – operational efficiency |
| Freight to Europe | $0.80-1.20 | High – charter rate volatility |
Fixed liquefaction fees function as infrastructure recovery mechanisms, representing sunk costs once facilities become operational. These fees typically range from $2.50-3.50/MMBtu depending on plant efficiency, financing structure, and operational complexity. Unlike variable feedgas costs, these charges remain constant regardless of market conditions, providing revenue stability during margin compression periods.
The Henry Hub Pricing Mechanism and Its Direct Impact
The Henry Hub operates as both a physical delivery point and financial settlement mechanism, creating the price discovery foundation for approximately 90% of US natural gas transactions. This dual function means LNG producers face direct exposure to domestic supply-demand fundamentals while competing in global markets, particularly given current us natural gas prices forecast conditions.
Regional basis differentials add another layer of cost complexity:
- Permian Basin to Gulf Coast: typically $0.15-0.30/MMBtu negative to Henry Hub
- Appalachian Basin to Gulf Coast: typically $0.25-0.50/MMBtu negative to Henry Hub
- Haynesville to Gulf Coast: typically $0.05-0.15/MMBtu negative to Henry Hub
These basis spreads reflect pipeline capacity constraints and transportation costs from major production regions to liquefaction terminals. During peak demand periods, basis widening can add 50-100 basis points to feedgas procurement costs, directly impacting export margins.
Time-lag dynamics between gas purchase and cargo delivery create additional risk exposure. Natural gas is typically purchased 1-2 months before actual cargo loading through futures contracts, meaning operators face basis risk as market conditions evolve between purchase commitment and physical delivery.
When big ASX news breaks, our subscribers know first
What Drives the Current Margin Compression in US LNG Exports?
Multiple structural factors have converged to create the most challenging margin environment for US LNG exports since operations began at scale. These pressures reflect both cyclical market conditions and fundamental shifts in global energy dynamics that operators must navigate strategically.
Atlantic Basin Freight Rate Dynamics
Charter rate volatility has emerged as a primary driver of margin compression, with Atlantic basin freight costs experiencing dramatic swings throughout 2025. The AGC-NW Europe spread grew to 96¢/MMBtu on November 24, 2025, near the peak of the freight rally, compared to just 28¢/MMBtu in mid-October.
This 68 basis point deterioration represents a 241% increase in shipping cost components, directly eroding export profitability. Freight rate amplification occurs through multiple mechanisms:
- Direct cost impact: Higher rates increase delivered cost to European buyers
- Spread compression: Expensive freight makes US LNG less competitive versus pipeline gas
- Cargo diversion costs: Limited flexibility to redirect shipments during rate spikes
Vessel availability constraints during peak loading periods exacerbate rate volatility. The commissioning of the 27.2mn tonnes/year Plaquemines facility has increased Atlantic basin loading demand, creating competition for available shipping capacity during winter demand periods.
European Demand Patterns and Price Discovery
European gas pricing has moved independently of US cost structures, creating structural margin pressure. The NW Europe LNG delivered price of $8.83/MMBtu on December 4, 2025, represented the lowest level since May 2024, driven by warmer-than-normal weather forecasts and well-supplied EU underground storage.
This price discovery mechanism reflects several demand elasticity factors:
- Storage inventory levels: High storage reduces spot purchasing urgency
- Weather sensitivity: Mild temperatures decrease heating demand
- Pipeline gas competition: Russian pipeline flows and Norwegian supply provide alternatives
- Renewable generation displacement: High wind/solar output reduces gas-fired power demand
The disconnect between US cost inflation and European price weakness has created unprecedented compression in export margins. Historical premium levels demonstrate this deterioration:
- 2022 average premium: $20.13/MMBtu
- 2023 average premium: $5.37/MMBtu
- 2024 average premium: $4.63/MMBtu
- 2025 average premium: $4.11/MMBtu (through December 4)
This represents an 80% margin erosion from 2022 levels, highlighting the structural challenges facing US exporters in the current market environment where us lng margins tighten on higher henry hub prices.
How Do Long-Term Contracts Provide Margin Protection?
Long-term contract structures represent the primary hedge against spot market volatility, providing predictable revenue streams while sacrificing operational flexibility. These arrangements have evolved to balance risk allocation between producers and buyers in an increasingly complex global gas market.
Fixed-Fee vs. Oil-Indexed Contract Structures
Three primary pricing methodologies dominate global LNG contracting, each offering distinct risk profiles and margin protection characteristics:
-
Henry Hub-linked contracts (115% HH + fixed fee)
- Automatic cost escalation through 115% multiplier
- Fixed fee component covers infrastructure amortisation
- Direct correlation with US feedgas costs
-
JKM-indexed contracts
- Asian market price exposure
- Higher volatility but premium pricing potential
- Seasonal demand patterns favour winter loading
-
Brent-indexed contracts
- Oil price correlation provides inflation hedge
- Traditional pricing mechanism for legacy contracts
- Reduced direct gas market exposure
The Henry Hub formula creates margin protection through cost pass-through mechanics. The 115% multiplier ensures producers benefit from feedgas price increases while maintaining a 15% markup buffer above input costs. During December 2025 conditions:
- Henry Hub price: $5.06/MMBtu
- Contract calculation: (115% × $5.06) + $3.00 = $8.82/MMBtu
- Spot AGC Gulf Coast FOB: $8.13/MMBtu (implied 69¢ premium to contract)
This demonstrates how contract protection mechanisms can provide pricing floors during volatile market conditions, though spot premiums have compressed significantly from historical levels.
Portfolio Optimisation Strategies for LNG Operators
Successful operators balance long-term contract security with spot market opportunity through diversified portfolio approaches. Key optimisation strategies include:
Geographic diversification: Operators maintain sales exposure across Atlantic and Pacific markets to capitalise on regional price differentials and seasonal demand patterns.
Volume flexibility provisions: Modern contracts incorporate limited flexibility mechanisms allowing seasonal rebalancing within annual commitments, though these provisions sacrifice some pricing certainty.
Cargo timing optimisation: Forward curve analysis enables operators to time discretionary volumes during favourable margin periods while fulfilling minimum take quantities.
Industry analysis indicates that operators maintaining 70-80% long-term contract coverage while retaining 20-30% spot exposure achieve optimal risk-adjusted returns during volatile market cycles.
Which Operational Factors Determine Export Viability?
Beyond pricing dynamics, operational efficiency and infrastructure optimisation determine the viability of US LNG exports during margin compression periods. These factors often prove more controllable than market conditions, making them crucial elements of strategic planning.
Plant-Level Economics and Utilisation Rates
Liquefaction facilities exhibit significant economies of scale, with minimum economic run rates typically falling between 70-85% of nameplate capacity. Below these thresholds, fixed cost absorption becomes prohibitive, making continued operation uneconomical despite positive variable margins.
Key operational metrics include:
- Heat rate optimisation: Modern facilities achieve 8.5-9.5 MMBtu gas input per MMBtu LNG output
- Power consumption efficiency: 8-12% of gas input for compression and auxiliary systems
- Maintenance scheduling: Planned outages typically occur during low-demand summer periods
- Debottlenecking potential: Existing facilities often achieve 105-110% nameplate through optimisation
The Golden Pass LNG facility, with 18.1mn tonnes/year capacity, recently received approval for cool-down cargo operations, representing a significant addition to US export capacity. Feedgas flows to Golden Pass reached just over 8mn ft³/d on December 4, indicating gradual ramp-up toward full operational status.
Feedgas Supply Chain Optimisation
Pipeline capacity constraints from major production basins create operational bottlenecks that directly impact feedgas costs and delivery reliability. In addition, broader economic trends including the us economy and tariffs landscape further complicate supply chain planning through inflationary pressures.
Basin connectivity analysis:
- Permian Basin: 800-900 miles to Gulf Coast terminals via multiple pipeline systems
- Appalachian production: Longer transport distances but lower basis differentials
- Haynesville Shale: Closest proximity to terminals but higher extraction costs
Storage and linepack management: Operators utilise pipeline storage capacity and underground storage facilities to manage seasonal demand fluctuations and optimise gas procurement timing.
Associated gas vs. dry gas sourcing: Associated gas from oil production often trades at discounts to pipeline gas, providing cost optimisation opportunities for facilities with flexible feedgas specifications.
What Are the Forward Market Indicators for LNG Margins?
Forward market analysis provides critical insights into margin sustainability and operational planning horizons. Current forward curves reflect both seasonal patterns and structural supply-demand imbalances that will shape future profitability, particularly as us lng margins tighten on higher henry hub prices.
Futures Curve Analysis and Backwardation Patterns
The current market exhibits steep backwardation in both Henry Hub futures and Atlantic freight rates, creating divergent forward pricing dynamics. This backwardation pattern suggests market expectations of:
- Near-term tightness: Current high prices reflect immediate supply-demand imbalances
- Medium-term relief: Forward prices anticipate increased supply and demand normalisation
- Seasonal adjustment: Winter premium pricing expected to moderate in spring 2026
Critical forward indicators include:
- TTF-Henry Hub spread convergence: European gas futures showing less backwardation than US prices
- Freight rate normalisation: Charter rates expected to decline significantly in Q1 2026
- Storage cycle timing: European injection season begins April-May, affecting demand patterns
New Capacity Additions and Market Saturation Risk
Global LNG supply growth threatens to oversupply markets in the latter half of the decade, with multiple projects scheduled for completion between 2025-2028. However, the tariff impact on markets could reshape global trade flows and competitive positioning.
US additions:
- Golden Pass LNG: 18.1mn tonnes/year (commissioning phase)
- Additional capacity: Various brownfield expansions totalling ~20mn tonnes/year
Global competition:
- Qatar Golden Pass expansion phases
- Australian capacity optimisation projects
- Russian Arctic LNG developments (subject to sanctions)
Market share competition will intensify as new capacity comes online, potentially creating structural margin pressure beyond current cyclical factors. Operators must position for increased competition through cost optimisation and contract portfolio management.
How Do Regulatory and Infrastructure Constraints Affect Margins?
Regulatory frameworks and infrastructure limitations create operational constraints that directly impact export economics. Understanding these factors enables operators to optimise within existing constraints while planning for future regulatory evolution.
FERC Approval Processes and Operational Flexibility
Federal Energy Regulatory Commission oversight affects multiple aspects of LNG operations:
Cool-down cargo procedures: New facilities require regulatory approval for initial LNG introduction, creating commissioning delays that affect cash flow timing.
Environmental compliance costs: Operators face increasing regulatory requirements for emissions monitoring, leak detection, and environmental impact mitigation.
Export permit limitations: While existing facilities operate under blanket approvals, volume restrictions and destination requirements can limit marketing flexibility.
Recent regulatory developments include approval for Golden Pass LNG to receive cool-down cargo, enabling the facility to begin commissioning procedures and approach commercial operations.
Terminal Infrastructure and Logistical Bottlenecks
Physical infrastructure constraints create operational limitations that affect both costs and scheduling flexibility:
Loading dock availability: Peak winter loading periods create berth congestion, potentially requiring vessel queuing and demurrage costs.
Storage tank capacity: Facilities require adequate storage to manage production timing versus shipping schedules, particularly during maintenance periods.
Pipeline interconnection capacity: Feedgas delivery constraints during peak production periods can limit operational flexibility and increase procurement costs.
These infrastructure factors often prove more limiting than market conditions, making capacity optimisation crucial for maintaining competitive positioning.
The next major ASX story will hit our subscribers first
What Strategic Adaptations Are Operators Making?
Industry participants are implementing multiple strategic adaptations to navigate margin compression while positioning for long-term competitiveness. These approaches balance immediate profitability concerns with structural market evolution, particularly as trade war tariffs impact global supply chains.
Risk Management and Hedging Strategies
Sophisticated risk management has become essential for maintaining viable operations during volatile market conditions. Key hedging strategies include:
Financial derivatives deployment:
- Henry Hub futures for feedgas cost hedging
- Freight forward agreements for shipping cost protection
- Currency hedging for international contract exposure
- Weather derivatives for demand-side risk mitigation
Portfolio optimisation techniques:
- Geographic diversification across end markets
- Seasonal cargo timing optimisation
- Contract versus spot exposure balancing
- Operational flexibility preservation
Integrated supply chain management: Operators increasingly focus on vertical integration opportunities, from upstream gas production through downstream marketing, to capture margin throughout the value chain.
Technology and Efficiency Improvements
Technological advancement represents a controllable margin improvement opportunity independent of market conditions:
Heat rate optimisation: Advanced process control systems and equipment upgrades can reduce gas consumption per unit of LNG produced, directly improving margins.
Digitalisation initiatives: Predictive maintenance, real-time optimisation, and automated operations reduce both operating costs and unplanned downtime risks.
Environmental performance enhancement: Carbon capture integration and emissions reduction technologies address regulatory requirements while potentially accessing carbon credit revenues.
These efficiency improvements often provide 2-5% margin enhancement through reduced input costs and improved operational reliability.
How Will Market Dynamics Evolve Through 2026?
Forward-looking analysis suggests 2026 will represent a transitional period for US LNG markets, with structural oversupply conditions developing as new capacity comes online while demand growth moderates from recent peak levels. Furthermore, the broader oil price rally analysis suggests interconnected energy markets will influence LNG pricing dynamics.
Demand Growth Projections by Region
Global LNG demand growth is expected to moderate from recent elevated levels, creating more competitive conditions for US exporters:
Asian market evolution:
- Chinese demand growth slowing from infrastructure build-out completion
- Japanese and Korean demand relatively stable but weather-sensitive
- Emerging Southeast Asian markets providing growth opportunities
European market maturation:
- Storage capacity utilisation affecting seasonal demand patterns
- Pipeline gas competition from Norway and potential Russian resumption
- Renewable energy displacement reducing baseline gas demand
Emerging market penetration: South American, African, and Middle Eastern markets represent growth opportunities, though infrastructure development and creditworthiness considerations limit near-term impact.
Supply-Side Competitive Positioning
US cost competitiveness faces increasing challenges as global supply capacity expands:
Middle Eastern competition: Qatar's expansion phases offer lower production costs and geographic advantages for Asian markets.
Australian positioning: Existing facilities benefit from proximity to Asian demand centres and established contract relationships.
US advantages: Flexible contract terms, operational reliability, and political stability provide competitive differentiation beyond pure cost considerations.
The evolution toward oversupply conditions will likely favour buyers, creating pressure for more flexible contract terms and potentially lower pricing formulas for new agreements.
Navigating the New Economics of US LNG
The current margin compression in US LNG exports reflects a fundamental shift from the seller's market conditions of 2021-2022 toward a more balanced, competitive environment. As conditions where us lng margins tighten on higher henry hub prices continue, operators face the challenge of maintaining profitability while positioning for long-term success in an evolving global energy landscape.
Key strategic imperatives include optimising operational efficiency, diversifying market exposure, and maintaining financial flexibility through sophisticated risk management. For instance, recent market developments show natural gas prices reaching three-year highs while margin pressure intensifies, highlighting the complex dynamics operators must navigate.
The industry's ability to adapt to these changing conditions will determine competitive positioning as global LNG markets transition toward structural oversupply in the latter half of the decade.
Disclaimer: This analysis is based on market data available as of December 2025 and reflects current industry conditions. Forward-looking statements involve inherent uncertainties, and actual results may differ materially from projections. Operators should conduct independent analysis before making operational or investment decisions.
Looking for Investment Opportunities in the Energy Sector?
Discovery Alert provides instant notifications on significant ASX mineral discoveries, powered by its proprietary Discovery IQ model, helping investors identify actionable opportunities across energy-related commodities including uranium and critical battery metals. Begin your 30-day free trial today to secure your market-leading advantage as the energy transition creates new investment landscapes.