July 24, 2026
The Market Architecture Behind America's LNG Dominance
Consider the mechanics of global energy trade before liquefied natural gas technology matured. A country that produced more natural gas than it could consume domestically had limited options. It could inject the surplus into storage, lower the wellhead price to stimulate local demand, or pipe it to a neighbouring country if the infrastructure existed. Absent a pipeline connection, that gas simply stayed in the ground. This geographic imprisonment of natural gas supply shaped regional energy pricing for decades, creating three largely insulated pricing universes centred on North America, Europe, and Asia.
The LNG process dismantled that architecture. By cooling natural gas to approximately -162 degrees Celsius (-260 degrees Fahrenheit), its volume shrinks by roughly 600 times, making it practical to load onto specialised tankers and ship anywhere in the world with a receiving terminal. What had been a regional commodity became, for the first time, a globally traded one. This single technological shift is the foundation of how the U.S. became the world's LNG superpower, and understanding its full implications requires examining the structural forces that preceded it.
When big ASX news breaks, our subscribers know first
From Importer to Global Exporter: A Decade of Reversal
In 2015, the United States exported less than 0.03 trillion cubic feet of LNG annually. Qatar dominated global trade at that point, shipping approximately 3.7 trillion cubic feet, while Australia was still in a rapid buildout phase at 1.4 trillion cubic feet. U.S. terminal developers were not building liquefaction plants at that time. They were constructing import terminals, engineered to receive foreign gas and regasify it for domestic consumption, because the prevailing consensus held that American gas production would eventually fall short of demand.
The shale revolution made that consensus obsolete almost overnight. Hydraulic fracturing combined with horizontal drilling unlocked vast volumes of natural gas trapped in tight rock formations that conventional drilling could not economically access. The surplus transformed domestic economics and, critically, provided the raw supply base for an export industry that barely existed. Furthermore, the LNG supply outlook for 2025 reflects just how dramatically this transformation reshaped global energy markets.
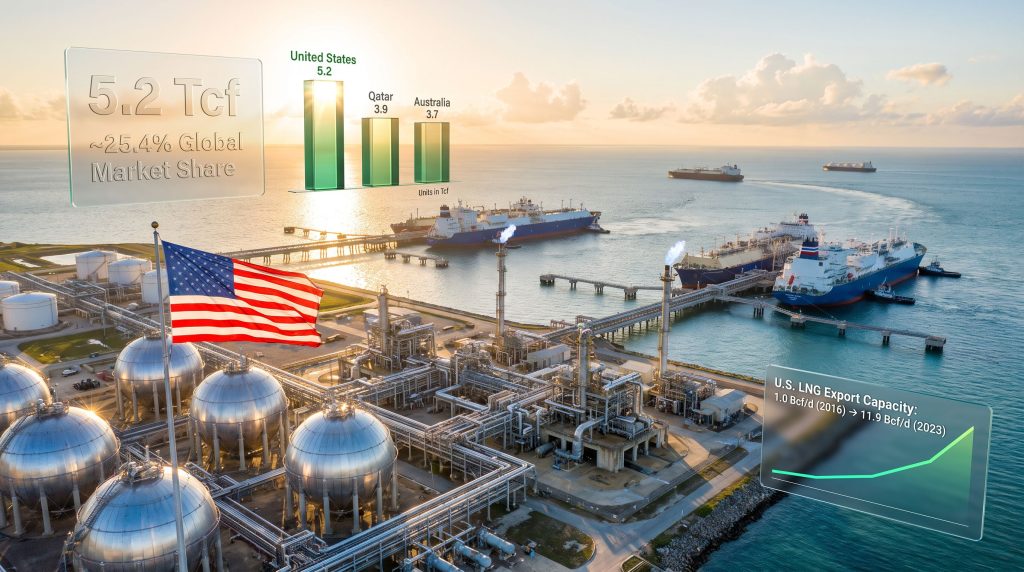
By 2025, U.S. LNG exports had reached 5.2 trillion cubic feet, according to data from the Energy Institute's 2026 Statistical Review of World Energy. That represents a greater-than-200-fold increase over a decade. The U.S. captured 25.4% of the global LNG export market, placing it well ahead of Qatar at 3.9 trillion cubic feet and Australia at 3.7 trillion cubic feet.
| Metric | United States (2025) | Qatar (2025) | Australia (2025) |
|---|---|---|---|
| LNG Exports (Tcf) | 5.2 | 3.9 | 3.7 |
| Global Market Share | ~25.4% | ~19.1% | ~18.1% |
| Year-on-Year Export Growth | +27% | Modest | Flat |
| Export Capacity (Bcf/d baseline) | ~11.9+ | Stable | Stable |
One statistic captures the scale of American dominance more precisely than any market share figure: global LNG exports grew by approximately 1.2 trillion cubic feet in 2025, and the United States contributed roughly 1.10 trillion cubic feet of that increase. Approximately 93% of all incremental global LNG supply in 2025 originated from American export terminals. This level of marginal supply concentration has no modern precedent in the LNG industry.
The Three Structural Pillars Driving U.S. LNG Growth
Pillar One: Shale Gas as an Inexhaustible Supply Engine
The export story begins underground. U.S. natural gas production reached a record 103.9 billion cubic feet per day in 2025, according to the U.S. Energy Information Administration (EIA), representing more than 25% of total global output. No other country comes close to that production scale.
Three distinct basin types collectively underpin this output:
| Basin | Strategic Characteristic | Role in LNG Supply Chain |
|---|---|---|
| Appalachia (Marcellus/Utica) | Largest domestic production volume | Limited by pipeline takeaway capacity |
| Permian Basin | Associated gas from oil-driven drilling | Provides a production floor independent of gas prices |
| Haynesville (TX/LA) | Proximity to Gulf Coast export terminals | Most responsive to LNG export demand signals |
One dynamic that is not widely appreciated outside the industry is how the Permian Basin functions as a structural volume anchor. Because Permian drilling decisions are primarily driven by crude oil economics, natural gas produced as a byproduct continues flowing regardless of gas price weakness. This creates a supply floor that supports export volumes even during domestic price downturns.
The Haynesville Shale in eastern Texas and northern Louisiana occupies a different strategic role. Its geographic positioning within pipeline reach of multiple Gulf Coast liquefaction facilities makes it the basin most directly responsive to changes in LNG export throughput. When a terminal adds capacity or a new train comes online, Haynesville producers are typically the first to benefit commercially. In addition, US drilling activity trends in 2025 have introduced some uncertainty around how quickly these production gains can be sustained.
Pillar Two: Gulf Coast Infrastructure and the Import Terminal Reversal
A less obvious contributor to American LNG competitiveness is the pre-existing energy ecosystem along the Gulf Coast. Deep-water ports, dense pipeline networks, petrochemical processing complexes, and a highly skilled energy workforce were already in place before the first LNG export cargo departed in 2016. This infrastructure inherited from decades of oil and gas development gave U.S. project developers a construction cost and timeline advantage that greenfield LNG nations simply cannot replicate.
Particularly significant was the conversion of import terminals into liquefaction and export facilities. Rather than constructing entirely new coastal infrastructure from scratch, developers retrofitted existing regasification terminals to run the cryogenic process in reverse, compressing the project development cycle and reducing capital expenditure.
The capacity buildout that followed was rapid. Average annual export capacity scaled from roughly 1.0 Bcf per day in 2016 to approximately 11.9 Bcf per day by 2023, with the ramp continuing through 2025 and beyond.
The single largest source of incremental LNG supply in 2025 was Plaquemines LNG in Louisiana. According to the International Energy Agency, this facility alone accounted for more than 60% of the increase in global LNG supply during the year. Corpus Christi Stage 3 in Texas also began contributing new volumes as its ramp-up progressed.
The next wave of projects currently under construction includes:
- Golden Pass LNG (Texas)
- Port Arthur LNG (Texas)
- Rio Grande LNG (Texas)
Projects totalling more than 2.8 trillion cubic feet of annual export capacity reached final investment decisions during 2025, establishing the volume trajectory for the remainder of the decade.
Pillar Three: Contract Flexibility as a Competitive Differentiator
Contract architecture is an underappreciated dimension of U.S. LNG competitiveness. Most American LNG is sold under terms linked to the Henry Hub benchmark, the domestic U.S. natural gas pricing reference point. This contrasts with LNG from Qatar and Australia, which is commonly priced on an oil-indexed basis.
Henry Hub linkage gives buyers a structural advantage when international gas prices significantly exceed U.S. domestic prices, allowing them to capture the spread between their supply cost and the market value of the cargo at destination. This pricing model has proven particularly attractive to European utilities seeking to reduce exposure to oil-price volatility in their gas procurement. Notably, US natural gas prices in 2025 remained a closely watched variable for buyers evaluating long-term contract commitments.
Beyond pricing, many U.S. contracts incorporate destination flexibility clauses that allow cargo rerouting while a vessel is in transit. A tanker that departed the Gulf Coast bound for an Asian buyer can be redirected to Europe if spot prices there surge above the contracted level. This real-time arbitrage capability is not a standard feature of competing supplier contracts, and it has become a significant commercial differentiator as global gas markets have grown more interconnected and volatile.
Europe's Structural Pivot to American LNG
The geopolitical shock that accompanied Russia's invasion of Ukraine in 2022 compressed what might otherwise have been a decade-long market transition into just a few years. European nations that had been planning gradual reductions in pipeline gas dependency were forced to accelerate the process dramatically, creating urgent demand for alternative LNG supply at a scale the global market had not previously anticipated.
Europe responded by rapidly expanding its LNG import infrastructure, deploying floating storage and regasification units (FSRUs) that can be installed in months rather than the years required for onshore terminal construction. This import capacity expansion created the physical ability to absorb the surge in American cargoes. However, the broader question of European gas prices and how U.S. trade policy intersects with energy costs has added a further layer of complexity for buyers on the continent.
The numbers are substantial. According to the EIA, U.S. LNG shipments to Europe averaged a record 10.3 billion cubic feet per day in 2025, compared with 6.3 billion cubic feet per day in 2024, representing a 63% year-on-year increase. Europe received approximately 68% of total U.S. LNG exports during the year.
Europe has not ended its dependence on imported energy. What has fundamentally changed is the routing of that energy and the diversity of the supply base competing to provide it. According to the EIA, American volumes now dwarf those from all other LNG suppliers to the European market combined.
Market conditions in 2025 reinforced this trend from the supply side as well. Softening Asian LNG demand, combined with a sharp contraction in U.S. shipments to China driven by trade tensions, redirected substantial cargo volumes toward European buyers who were willing to pay competitive prices. The destination flexibility embedded in U.S. contracts made this cargo reallocation technically straightforward to execute.
The Risks Embedded in Rapid Growth
Domestic Supply and Price Pressure
The LNG export expansion has not occurred in isolation from the domestic U.S. gas market. U.S. natural gas consumption also set a record in 2025, reaching 88.4 billion cubic feet per day, as power generation demand, industrial activity, and pipeline exports to Mexico all competed alongside LNG terminals for available supply.
Several structural forces are adding new layers of domestic demand complexity:
- Rapidly expanding data centre construction for artificial intelligence and cloud computing infrastructure
- Industrial reshoring programs bringing energy-intensive manufacturing back to U.S. soil
- The ongoing electrification of transport and heating in many parts of the country
- Continued pipeline export growth to Mexico
The critical balance to monitor is whether production and pipeline construction can grow fast enough to serve all these competing demand centres simultaneously. To date, abundant shale supply has accommodated the growth without severe domestic price inflation. Whether that equilibrium holds as export capacity accelerates toward 20 Bcf per day and beyond is an open question, and one with direct implications for American energy consumers.
Pipeline Bottlenecks and Takeaway Constraints
Appalachia remains the largest gas-producing region in the United States, yet persistent pipeline capacity limitations restrict how much of that output can physically reach Gulf Coast export terminals. This creates a concentration dependency on Haynesville as the primary swing supplier for LNG facilities, which introduces its own form of geographic risk if Haynesville production costs rise or regulatory constraints tighten.
The regulatory environment for new pipeline approvals in the U.S. adds further complexity. Permitting timelines for major interstate pipeline projects can extend years beyond initial planning horizons, constraining the speed at which infrastructure can catch up with export demand growth.
Geopolitical Exposure and the Hormuz Premium
The 2026 disruptions to LNG flows transiting the Strait of Hormuz provided a real-world demonstration of the strategic premium associated with supply originating outside the Persian Gulf. The IEA estimated that LNG flowing through the Strait had represented nearly 20% of global supply before the disruption. American exporters, whose cargoes depart from Gulf Coast terminals without any Persian Gulf transit requirement, benefited from an immediate demand pull as buyers sought non-Hormuz-exposed volumes.
This geopolitical positioning creates both opportunity and risk. Higher prices and stronger demand for non-Hormuz supply benefit U.S. exporters commercially. Simultaneously, the broader escalation of Middle East conflict introduces shipping cost inflation, insurance premium increases, and contract uncertainty that can affect the entire LNG market, including American participants. Furthermore, US LNG tariff pressures from Asian nations have added yet another dimension of trade complexity to navigate.
The Road to One-Third of Global Supply
The IEA projects that the United States will supply approximately one-third of the global LNG market by the end of the decade, as the next wave of Gulf Coast projects enters service.
| Year | Projected U.S. LNG Exports (Bcf/d) | Key Capacity Additions |
|---|---|---|
| 2025 (actual) | ~14.2 | Plaquemines ramp-up, Corpus Christi Stage 3 |
| 2026 (projected) | ~17 | Continued ramp-up of existing facilities |
| 2027-2030 | Rising toward ~20+ | Golden Pass, Port Arthur, Rio Grande LNG |
As U.S. market share approaches that level, an important secondary consequence emerges for global gas pricing. The Henry Hub benchmark will increasingly function as a reference point for international LNG pricing, transmitting the dynamics of the U.S. domestic gas market into global trade. Supply disruptions, demand spikes, or production shortfalls in the United States will carry progressively larger price signals to buyers in Europe, Asia, and Latin America.
This integration also intensifies competitive pressure on Qatar and Australia. Qatar's North Field expansion program represents the most credible medium-term challenge to U.S. market share, though its timeline extends well beyond 2027. Australia's growth trajectory has effectively plateaued, constrained by cost overruns at legacy facilities and a limited pipeline of new projects. Neither competitor currently has the combination of resource volume, infrastructure readiness, and contract flexibility to challenge U.S. dominance within the current planning horizon.
The next major ASX story will hit our subscribers first
Frequently Asked Questions: U.S. LNG Dominance
When did the U.S. become the world's largest LNG exporter?
The United States surpassed both Qatar and Australia to claim the top position in 2023, with the margin widening substantially through 2024 and 2025. By 2025, U.S. exports exceeded those of Qatar by more than 1.3 trillion cubic feet annually.
What is the difference between LNG and pipeline natural gas?
Liquefied natural gas is natural gas that has been supercooled to approximately -162 degrees Celsius, reducing its volume by around 600 times and enabling seaborne transport in specialised cryogenic tankers. Pipeline gas requires fixed physical infrastructure directly connecting the producer and consumer. LNG can be rerouted mid-voyage based on real-time market conditions, making it a fundamentally more flexible and geopolitically versatile commodity.
Why does the U.S. have a competitive advantage in LNG exports?
Several reinforcing structural advantages combine to create the U.S. competitive position:
- Record domestic gas production exceeding 103.9 Bcf per day
- Pre-existing Gulf Coast infrastructure that accelerated export terminal development
- Henry Hub-linked pricing that offers buyers exposure to lower U.S. domestic gas costs
- Destination-flexible contract structures enabling real-time cargo rerouting
- Political and regulatory stability supporting the long-term contract commitments required for LNG project financing
What are the environmental concerns associated with U.S. LNG exports?
The primary lifecycle emissions concern is methane leakage across the full value chain, from wellhead production through liquefaction, shipping, and regasification. Methane is a potent short-term greenhouse gas, and the cumulative emissions profile of LNG has been a focus of ongoing regulatory and scientific debate. LNG proponents characterise it as a bridge fuel enabling coal displacement in power generation, particularly in Asia. Climate advocates counter that long-term LNG infrastructure commitments risk locking in fossil fuel dependency for decades, complicating the pathway to net-zero targets. This tension remains unresolved and is likely to intensify as European decarbonisation timelines approach the 2035 horizon.
Key Takeaways: The Strategic Architecture of U.S. LNG Supremacy
- The U.S. transitioned from near-zero LNG exports in 2015 to the world's largest exporter by 2023, reaching 5.2 trillion cubic feet of annual exports by 2025
- Three structural foundations drove this rise: shale gas abundance, Gulf Coast export infrastructure, and flexible contract design
- The U.S. supplied approximately 93% of all incremental global LNG growth in 2025, a concentration of marginal supply without modern precedent
- Europe's structural pivot away from Russian pipeline gas created the demand pull that absorbed and accelerated U.S. export expansion, with American shipments to Europe reaching a record 10.3 Bcf per day
- Future growth is underpinned by a pipeline of committed projects targeting approximately one-third of the global LNG market by 2030
- Key risks include domestic price pressure from competing demand centres, pipeline bottlenecks, geopolitical trade disruptions, and long-term demand uncertainty tied to the energy transition
Data Sources: Readers seeking additional statistical context on U.S. LNG production and trade flows can consult the U.S. Energy Information Administration at eia.gov and the International Energy Agency at iea.org. The Energy Institute's annual Statistical Review of World Energy also provides comprehensive interregional trade data. All forecasts and projections cited in this article represent analyst and agency estimates subject to revision, and should not be construed as investment advice.
Want to Capitalise on the Resource Discoveries Driving the Next Energy Supercycle?
Discovery Alert's proprietary Discovery IQ model delivers real-time alerts on significant ASX mineral discoveries — instantly converting complex geological data into actionable investment insights for both short-term traders and long-term investors. Explore how historic mineral discoveries have generated extraordinary returns, then begin your 14-day free trial at Discovery Alert to position yourself ahead of the broader market.