June 19, 2026
The Hidden Variable Reshaping Global Energy Markets
Energy markets have spent decades pricing natural gas primarily on two variables: volume and cost. The supplier offering the largest quantities at the most competitive price typically won the contract. For buyers across Europe and Asia, this logic governed procurement strategy through the 1990s, the 2000s, and well into the 2010s. What that framework failed to account for was the value of reliability itself as a standalone, priceable commodity.
That omission is now being corrected in real time. A convergence of geopolitical disruptions, accelerating demand growth from unexpected sectors, and structural changes in how nations think about energy security has introduced a third pricing variable into global gas markets. Supply reliability now commands a measurable premium, and no producer is better positioned to capture that premium than the United States.
Understanding why requires examining not just where U.S. LNG is today, but how the architecture of global gas supply has fundamentally shifted and why U.S. LNG becoming the backbone of global gas supply would have seemed implausible just a decade ago.
When big ASX news breaks, our subscribers know first
From Regional Exporter to Global Anchor
The United States was a net natural gas importer as recently as 2016. The shale revolution changed that arithmetic completely. By unlocking enormous volumes of domestic gas from formations like the Marcellus, Haynesville, and Permian Basin, the U.S. transformed itself from a country building import terminals into one racing to construct export capacity fast enough to meet surging international demand.
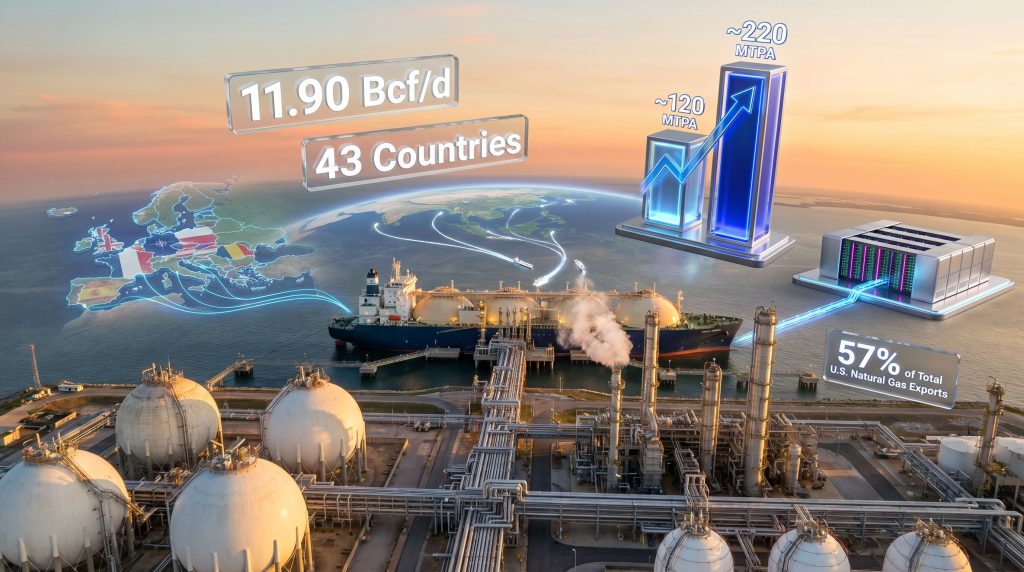
The numbers that resulted from that transformation are striking. According to the U.S. Energy Information Administration, U.S. LNG exports averaged 11.90 billion cubic feet per day (Bcf/d) in 2023, reaching buyers across 43 countries and representing 57% of total U.S. natural gas exports for the year. Current liquefaction capacity sits at approximately 120 million metric tons per annum (MTPA), a figure that already surpasses Qatar's approximately 77 MTPA and Australia's roughly 80 MTPA.
The trajectory ahead is more remarkable still. Projects currently under active construction could push U.S. capacity toward 220 MTPA within five years, a scale that no competing supplier is positioned to match. Furthermore, the global LNG supply outlook suggests these capacity gains will arrive at precisely the moment global demand is accelerating.
How the Major LNG Suppliers Compare
| Supplier | Current Capacity (MTPA) | Projected 5-Year Capacity | Primary Markets |
|---|---|---|---|
| United States | ~120 | ~220 | Europe, Asia-Pacific |
| Qatar | ~77 | ~126 | Asia, Europe |
| Australia | ~80 | ~85 | Asia-Pacific |
| Russia | ~30 | Constrained | Asia |
What the table above does not capture is the growth differential. Qatar's North Field expansion, while substantial, faces its own geopolitical dependencies. Australia's LNG sector is contending with domestic policy uncertainty that has created investment hesitation. Russia's capacity expansion is constrained by sanctions and international counterparty risk that is unlikely to reverse meaningfully within the current decade. The U.S., by contrast, possesses the reserve base, capital market depth, and infrastructure pipeline to sustain growth that none of these suppliers can replicate.
Three Demand Vectors Tightening the Global LNG Market
The supply transformation story is only half the equation. Demand is accelerating simultaneously from three structurally distinct directions, each of which would be significant in isolation. Together, they are creating conditions for a tighter LNG market than most forecasters had modelled even five years ago.
Vector 1: Europe's Structural Break from Pipeline Dependence
Russia's reduction of pipeline gas flows to Europe following the 2022 invasion of Ukraine was not a temporary disruption. It was a permanent restructuring of European energy procurement philosophy. European utilities and governments that had previously optimised their gas purchasing around cost now reorganised entirely around supply security.
The scale of the gap that emerged was enormous. Russian pipeline gas had supplied approximately 40% of Europe's gas consumption before the conflict. Replacing that volume required accessing alternative sources at speed, and U.S. LNG became the primary replacement volume source. European nations have since been locking in long-term supply agreements with U.S. exporters, a contracting pattern that represents a structural shift rather than a temporary emergency procurement response.
The lesson embedded in that experience extended well beyond Europe. Any buyer globally with significant concentration in a single supplier witnessed firsthand what over-reliance on one source could mean during a geopolitical rupture. Consequently, the trade war impact on energy markets has further accelerated this diversification imperative across multiple regions.
Vector 2: Asia's Coal Displacement Opportunity
Asia has historically represented the largest share of global LNG imports, driven by Japan, South Korea, and China. However, the next wave of demand growth is coming from developing Asian economies where coal remains the dominant fuel source.
- Southeast Asia continues building coal-fired power capacity, but LNG represents a credible near-term displacement pathway as economies industrialise and environmental pressure increases.
- India's power demand recently hit record highs, with coal still meeting the bulk of that load, creating a substantial LNG substitution opportunity as domestic gas infrastructure expands.
- China's continued coal consumption at scale represents the single largest LNG displacement opportunity on Earth, even if the transition timeline remains uncertain.
The urbanisation and electrification dynamics across South and Southeast Asia represent demand growth that will extend the LNG horizon well beyond near-term energy transition projections. In addition, the U.S.-China trade war impacts on procurement relationships are reshaping which suppliers Asian buyers prefer for long-term contracts.
Vector 3: The AI and Data Centre Electricity Multiplier
Perhaps the most consequential and least anticipated demand driver in current LNG market analysis is the electricity consumption footprint of artificial intelligence infrastructure.
Hyperscale data centres powering AI workloads require constant, dispatchable electricity around the clock. Unlike intermittent renewable sources, natural gas provides the always-on generation capacity these facilities demand, making AI infrastructure growth a structural tailwind for LNG demand that was largely absent from forecasts just five years ago.
The scale of AI-driven electricity demand is difficult to overstate. Major technology companies are committing to data centre buildouts measured in gigawatts of capacity. These facilities cannot run on intermittent generation. Grid-scale battery storage does not yet exist at the cost or capacity required to bridge renewable intermittency for continuous industrial loads of this magnitude.
Natural gas, and by extension LNG in import-dependent markets, fills that gap as the fastest scalable dispatchable generation solution available. Texas provides a visible case study: data centre development is accelerating in parallel with natural gas infrastructure expansion across the state, a pattern increasingly visible in other high-growth markets as well.
Why Reliability Has Become a Priced Commodity
The traditional LNG market was structured around long-term bilateral contracts, often oil-indexed, designed to guarantee volume at a predictable cost. Supply reliability was assumed. It was not explicitly priced because disruption risk was considered low for established exporters.
That assumption collapsed in stages. The 2022 European energy crisis demonstrated that concentrated pipeline dependence created catastrophic vulnerability. More recently, infrastructure disruptions in the Middle East have injected systemic risk into global LNG shipping and supply chains. The Strait of Hormuz, through which a significant portion of global LNG trade flows, has emerged as a structural chokepoint whose risk premium is now visibly embedded in buyer procurement behaviour.
Energy markets have historically priced commodities on volume and cost. The post-2022 global gas market introduced a third pricing variable: supply reliability. Buyers are now demonstrably willing to pay a premium for diversified, politically stable supply sources, a structural shift that systematically advantages U.S. LNG over competing exporters with higher geopolitical risk profiles.
The U.S. offers a combination of advantages that no single competing supplier can fully replicate:
| Competitive Advantage | Strategic Significance |
|---|---|
| Vast shale gas reserve base | Supports long-term supply volume commitments |
| Expanding Gulf Coast infrastructure | Enables rapid capacity scaling |
| Deep and liquid capital markets | Funds new liquefaction projects at scale |
| Destination-flexible cargo contracts | Allows supply to follow highest-value markets |
| Lower geopolitical risk profile | Provides supply security premium for buyers |
The destination flexibility point deserves particular attention. Unlike pipeline gas, which is physically constrained to fixed routes, LNG cargoes under U.S. contract structures can be redirected to the highest-value or most supply-constrained market. This makes the U.S. a genuine global swing supplier capable of responding to regional demand shocks that pipeline-locked competitors simply cannot address. Furthermore, U.S. natural gas prices remain competitively positioned relative to alternative supply sources, reinforcing this structural advantage.
Gulf Coast Infrastructure: The Physical Engine of Export Growth
The U.S. LNG story has a physical geography centred on the Gulf Coast, and Corpus Christi represents one of the most important nodes in that system. Already recognised as the largest crude oil export hub in the United States, the port is undergoing parallel development as a major LNG export centre.
Cheniere Energy's Corpus Christi Liquefaction facility stands as a benchmark for terminal scale, and expansion projects at the site are ongoing. Broader pipeline network expansions are increasing gas volumes flowing to Gulf Coast export points, supporting the capacity growth trajectory that could see U.S. export volumes reach the 220 MTPA level within the current decade.
Port infrastructure investment in handling large-scale LNG carrier traffic represents a logistics layer that receives less attention than upstream production metrics but is equally critical to export capacity realisation. According to the Atlantic Council, U.S. LNG is increasingly vital not only to energy security but also to broader economic growth for importing nations.
Three Scenarios for U.S. LNG's Role Through 2030
Responsible analysis requires acknowledging that the trajectory described above is not guaranteed. Three plausible scenarios frame the range of outcomes:
Scenario 1: Accelerated Dominance (Base Case)
U.S. capacity reaches 200+ MTPA by 2030, Europe completes its structural pivot to U.S. and allied LNG sources, AI-driven demand adds 15-20% to long-term gas consumption forecasts, and the U.S. captures a sustained reliability premium in global pricing.
Scenario 2: Constrained Growth
Permitting delays and regulatory uncertainty slow new terminal approvals, Qatar and Australia expand capacity faster than projected, and spot market volatility reduces appetite for long-term U.S. LNG contracts. The U.S. retains major supplier status but falls short of achieving the dominant anchor position.
Scenario 3: Geopolitical Acceleration
Prolonged Middle East instability triggers emergency LNG procurement across Asia simultaneously with elevated European demand, making the U.S. the de facto emergency supply backstop for multiple regions. Capacity constraints accelerate new project approvals and compress the timeline for expansion.
Disclaimer: Scenario projections involve inherent uncertainty. These frameworks are analytical tools for understanding the range of plausible outcomes, not predictions. Investors and policymakers should assess multiple scenarios when making decisions based on LNG market forecasts.
The next major ASX story will hit our subscribers first
The Climate Debate Reframed: LNG Versus Coal, Not LNG Versus Renewables
The environmental case against LNG expansion is often framed as a binary choice between natural gas and renewable energy. That framing misrepresents the actual substitution decision facing most of the developing world.
Natural gas combustion produces approximately 50-80% fewer greenhouse gas emissions than coal on a per-unit energy basis, according to the U.S. Environmental Protection Agency. In regions where coal remains the dominant fuel, LNG substitution represents a near-term, scalable pathway to meaningful emissions reduction even before renewable capacity reaches sufficient scale.
China, India, Southeast Asia, and much of Africa face energy access challenges that renewable energy alone cannot solve within the timeframes required for economic development. For these regions, the realistic alternative to LNG is not wind and solar. It is continued coal combustion or, in some cases, biomass fuels with far worse emissions profiles. However, the energy transition challenges facing these economies mean that LNG will remain a critical bridging fuel for decades to come.
The IEA's long-range demand scenarios consistently show natural gas playing a material role in the global energy mix through at least 2040, even under accelerated transition scenarios. The developing-world energy access imperative extends the LNG demand horizon in ways that advanced-economy transition timelines do not capture.
Natural gas also plays a structural enabling role for renewable expansion itself. Gas peaker plants provide the grid stability backup that allows higher renewable penetration without sacrificing system reliability. The two energy sources are less in competition than they are complementary within a grid architecture that requires both intermittent generation and dispatchable backup. As Forbes notes, U.S. LNG functions as both an engine of economic growth and a critical instrument of national and allied security.
LNG as a Geopolitical Instrument
The final dimension of U.S. LNG's rise is one that commodity markets price imperfectly but policymakers understand acutely. Energy supply relationships create geopolitical alignment. A European nation purchasing the majority of its gas from the United States has a different strategic calculus than one dependent on a pipeline-locked supplier whose foreign policy interests may diverge sharply.
U.S. LNG exports have already reshaped energy-security thinking for multiple European NATO allies. The same dynamic is emerging across Asia as buyers diversify away from supply chains exposed to Middle East shipping risk.
If U.S. LNG growth stalls due to regulatory headwinds or infrastructure bottlenecks, the countries that fill the resulting gap are Qatar, which carries its own regional geopolitical dependencies, and potentially Russia in markets where sanctions pressure has eased. Neither scenario improves global supply security or emissions performance relative to U.S. LNG.
The argument that U.S. LNG is becoming the backbone of global gas supply is ultimately an argument about which country is best positioned to provide what the global energy system most urgently needs: large volumes, destination flexibility, financial depth, political stability, and the production growth capacity to meet demand that is rising from multiple directions at once. On each of those criteria, the United States currently leads the field.
This article is intended for informational purposes only and does not constitute financial or investment advice. LNG market projections involve material uncertainty. Readers should conduct independent research before making investment decisions related to energy markets or energy sector equities.
Want To Stay Ahead Of The Next Major Resource Discovery Shaping Global Energy Markets?
As the structural shift towards LNG and energy security accelerates, so too does investment interest in the resource companies supplying the commodities underpinning this transformation — and Discovery Alert's proprietary Discovery IQ model delivers real-time alerts on significant ASX mineral discoveries the moment they hit the exchange, turning complex resource data into actionable opportunities. Explore historic discoveries and their market returns or start your 14-day free trial today to position yourself ahead of the broader market.