May 12, 2026
When Supply Chains Collide: The Structural Forces Behind Soaring US OCTG Prices
Steel markets have a long memory. Every major pricing cycle in oil country tubular goods carries the fingerprints of decisions made years earlier, from consolidation waves that gutted domestic manufacturing capacity to trade policies that reshaped import flows. Understanding why US OCTG prices soaring on Hormuz disruption and anti-dumping cases in 2026 requires looking not just at what is happening now, but at the compounding fragilities that made the market so vulnerable to simultaneous shocks in the first place.
When big ASX news breaks, our subscribers know first
What Is OCTG and Why Does It Matter?
Oil country tubular goods encompass a family of steel pipe products essential to the construction and operation of oil and gas wells. Every wellbore drilled requires multiple OCTG components working in sequence: surface casing set into the upper section of the well to stabilise the formation and protect groundwater, intermediate casing run deeper to manage pressure zones, production tubing that brings hydrocarbons to surface, and line pipe that moves product from wellhead to processing facility.
The two grades most relevant to the current price surge are API 5CT J55 surface casing and API 5L X52 ERW line pipe. J55 is a lower-strength carbon steel grade manufactured to American Petroleum Institute specification 5CT, widely used in shallow to mid-depth surface casing applications. X52 line pipe, specified under API 5L, carries a minimum yield strength of 52,000 pounds per square inch and is the workhorse grade for gathering lines and transmission infrastructure.
What makes OCTG pricing strategically significant is its position at the intersection of two major industrial systems: steel manufacturing and upstream energy. When OCTG prices rise sharply, they signal tightening conditions across both sectors simultaneously. Drilling programmes cannot proceed without adequate pipe supply, regardless of how favourable oil prices become. This is precisely why the current convergence of supply destruction and demand acceleration is being watched so closely by energy operators and steel traders alike.
Three Simultaneous Shocks and Why 2026 Is Different
Most historical OCTG price dislocations have been driven by a single dominant variable. The 2015–2016 collapse was almost entirely demand-driven, as the oil price crash eliminated drilling budgets overnight. The 2022–2023 surge was primarily a supply chain reconstruction story following pandemic-era disruptions. In both cases, the market had a clear corrective pathway: restart supply chains, wait for demand to recover, or allow prices to attract new import volumes.
The 2026 environment is structurally different because three independent shock vectors have arrived simultaneously, each capable of moving prices meaningfully on its own, and each reinforcing the others. Furthermore, the tariffs on supply chains have added an additional layer of complexity that previous cycles simply did not face.
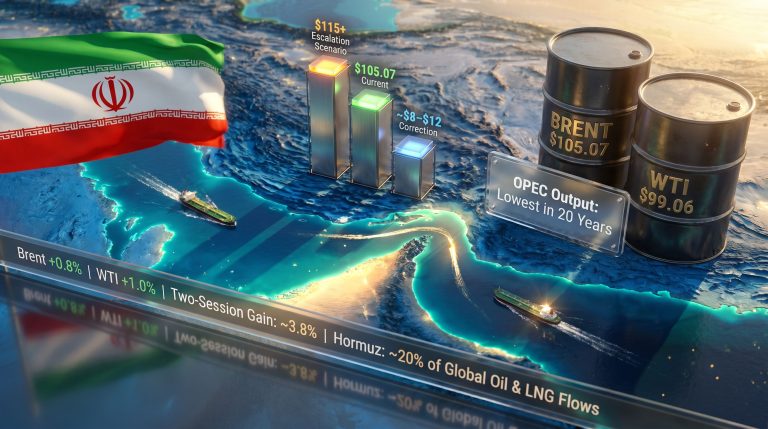
- Geopolitical supply destruction: The conflict in the Middle East has effectively sealed the Strait of Hormuz to commercial shipping, halting UAE pipe exports to the United States with near-total abruptness.
- Trade policy restriction: Anti-dumping and countervailing duty petitions filed on April 2, 2026, targeting Austria, Taiwan, and the UAE collectively eliminate or chill three of the top five OCTG import sources into the US market.
- Demand acceleration: Rising oil prices, a politically accelerated drilling push, and AI-linked infrastructure construction are driving OCTG demand higher at precisely the moment supply is contracting.
No single one of these forces would be easy to navigate in isolation. Their simultaneous arrival creates a compounding dynamic in which each shock amplifies the others, narrowing the market's available corrective mechanisms from multiple directions at once.
| Disruption Period | Primary Driver | Price Outcome | Recovery Path |
|---|---|---|---|
| 2015–2016 | Demand collapse (oil price crash) | OCTG prices fell ~40% | Demand recovery |
| 2020 | COVID-19 dual shock | Severe contraction | Supply chain reconstruction |
| 2022–2023 | Post-pandemic supply rebuild | Prices exceeded $2,000/ton | Gradual supply normalisation |
| 2026 | Hormuz disruption + trade enforcement + demand surge | Trajectory toward $2,000+/ton | Duration and path uncertain |
How the Strait of Hormuz Crisis Collapsed US Pipe Import Volumes
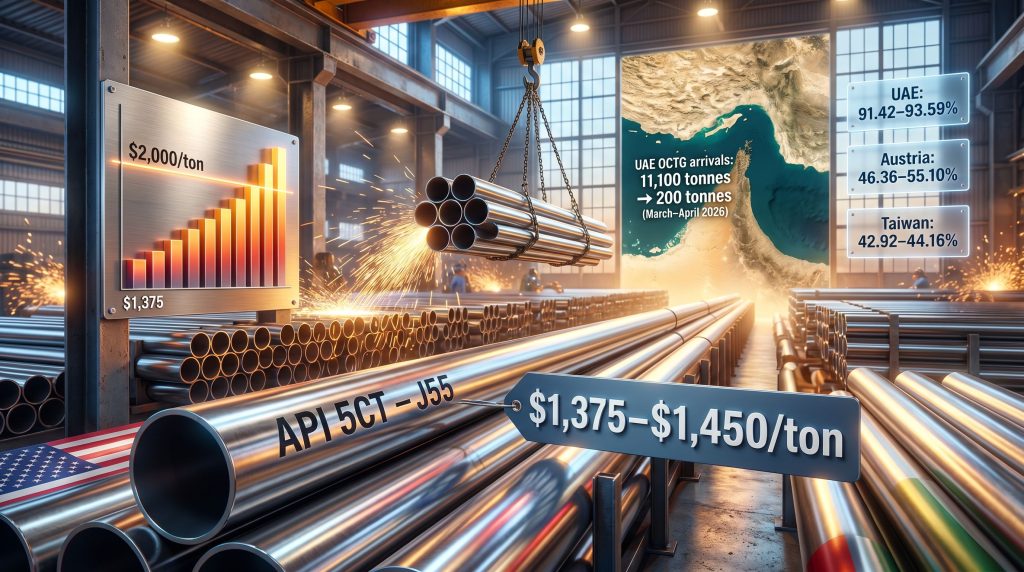
The scale and speed of the UAE import collapse is difficult to overstate. According to data from the US International Trade Agency's steel imports monitor, OCTG arrivals from the UAE fell from 11,100 tonnes in March 2026 to just 200 tonnes in April 2026, a reduction of more than 98% in a single month. For context, the UAE had been exporting 6,000 to 8,000 tonnes per month to US buyers throughout 2025, making it the largest single source of standard pipe imports into the country that year.
The mechanism behind this collapse is straightforward. The Strait of Hormuz is the only navigable maritime exit route for exports originating in UAE ports. With the conflict disrupting shipping through the strait from February 2026 onward, vessels carrying already-sold tonnage have been unable to transit. The critical detail here is that much of this material was contractually committed to US buyers before the disruption began, meaning the pipe is technically sold but physically undeliverable.
That creates a category of supply that does not exist from the buyer's perspective but does exist on paper, distorting traditional inventory metrics. Consequently, the oil price rally driven by Hormuz tensions is compounding the pipeline supply crisis from multiple directions simultaneously.
The broader consequences for global energy markets are severe. The Strait of Hormuz handles roughly one-fifth of daily global oil supply, and the collapse in commercial shipping traffic from approximately 150 vessels daily to fewer than a dozen has prompted the International Energy Agency to authorise a release of 400 million barrels from strategic reserves. WTI crude has surpassed $110 per barrel, with market participants pricing a trajectory toward $120 per barrel if the closure extends through the third quarter of 2026.
| Period | UAE OCTG Arrivals in US | Market Status |
|---|---|---|
| 2025 Annual Average | 6,000–8,000 tonnes/month | Normal supply flow |
| March 2026 | 11,100 tonnes | Pre-disruption buyer stockpiling |
| April 2026 | 200 tonnes | Near-total supply collapse |
| May 2026 Outlook | Minimal | Strait blockade ongoing |
An important and underappreciated dynamic: the March 2026 spike to 11,100 tonnes likely reflects buyers rushing to secure as much material as possible just before the disruption fully materialised. This front-loading behaviour is common in commodity markets when buyers sense an approaching supply constraint, but it also means that whatever inventory was accumulated in March was a one-time buffer, not a sustainable supply stream. Analysts tracking oil prices and trade war dynamics have noted that similar front-loading behaviour emerged during previous geopolitical flashpoints.
Anti-Dumping Petitions: Three of the Top Five Suppliers Under Investigation
On April 2, 2026, the US OCTG Manufacturers Association, joined by the United Steelworkers Union and US Steel Corporation, filed antidumping and countervailing duty petitions with the Department of Commerce and the US International Trade Commission targeting Austria, Taiwan, and the UAE.
The significance of the target selection cannot be overstated. These three countries collectively represent a major portion of the top five OCTG import sources into the United States. Combined, their import volumes grew by 74% between 2023 and 2025, rising from approximately 290,000 tonnes to 505,000 tonnes, even as steel and aluminum tariffs escalated from 25% to 50%. The persistence of import growth through successive tariff increases was the explicit justification for escalating to formal trade remedy proceedings.
The alleged dumping margins filed in the petition are substantial:
| Country | Alleged Antidumping Margin | Additional Action |
|---|---|---|
| UAE | 91.42–93.59% | Antidumping |
| Austria | 46.36–55.10% | Antidumping + Countervailing Duty |
| Taiwan | 42.92–44.16% | Antidumping |
The investigation timeline follows a structured sequence established under US trade law:
- April 22, 2026: Department of Commerce formally initiates investigations
- Mid-May 2026: ITC issues preliminary injury determination
- September 2026: Preliminary countervailing duty (subsidy) determinations expected
- November 2026: Preliminary antidumping duty determinations expected
What makes this timeline particularly consequential is the market behaviour it triggers before any duties are formally imposed. Importers from the named countries face the prospect of retroactive duty liability on all entries made after the initiation date, creating a powerful economic incentive to curtail shipments immediately. The chilling effect on import flows therefore operates months ahead of any final determination.
This is not the first time the US OCTG market has been reshaped by trade enforcement. The China OCTG case, originally valued at $2.6 billion when filed in 2008, resulted in antidumping margins of up to 99.14% and countervailing duties of 20.90 to 26.19%, effectively removing China from the US market. Subsequent enforcement rounds progressively narrowed the pool of viable import sources. Furthermore, the broader US steel tariffs impact across successive administrations has cumulatively reduced the number of flexible import levers available when domestic supply tightens.
The Hot-Rolled Coil Problem: Why Domestic Production Cannot Simply Fill the Gap
A critical but underreported dimension of the current crisis is the feedstock constraint operating upstream of OCTG production itself. Welded OCTG pipe is manufactured from hot-rolled coil steel, which is formed into skelp, roll-formed into a cylindrical shape, and welded along the seam. If hot-rolled coil is unavailable or prohibitively expensive, OCTG production cannot simply be ramped up on demand regardless of how attractive the finished pipe price becomes.
The 50% Section 232 tariff on imported steel has dramatically curtailed the availability of imported hot-rolled coil, concentrating supply among a small number of domestic mills. According to Fastmarkets reporting, US steel mills were operating at their highest capacity utilisation since 2024 as of April 2026, yet spot market buyers continued to face difficulty securing tonnage because domestic producers had prioritised long-term contract customers.
The feedstock problem is not limited to the US. South Korean and Taiwanese pipe producers, who might otherwise redirect supply to a high-price US market, are themselves struggling to source sufficient coiled steel. This eliminates what would normally be a natural market corrective: export diversion from alternative Asian suppliers.
The domestic consolidation story provides critical context here. In the 1990s, the United States had approximately 30 steel manufacturers. Today, four steelmakers control roughly 80% of domestic market share. That consolidation was the direct consequence of import flooding that drove widespread bankruptcies across the industry through the late 1990s and into the 2000s. The result is a market structure where surge capacity is structurally limited, because building new steel mill capacity requires 18 to 36 months of planning, permitting, and construction, while demand accelerates in real time.
| Supply Constraint | Mechanism | Near-Term Impact |
|---|---|---|
| Hormuz disruption | UAE/Middle East exports halted | Immediate spot shortage |
| Anti-dumping petitions | Austria, Taiwan, UAE imports chilled | Supply reduction within 60–90 days |
| Section 232 tariffs (50%) | Imported HRC restricted | Domestic production cost inflation |
| HRC mill outages | Upstream feedstock shortage | Output ceiling on domestic OCTG |
| Market consolidation | 4 mills control ~80% of supply | Minimal surge capacity available |
The next major ASX story will hit our subscribers first
OCTG Price Trajectory: The Path to $2,000 Per Ton
Fastmarkets assessed steel OCTG API 5CT Casing J55, fob mill US at $1,375 to $1,450 per short ton on April 8, 2026, up from $1,350 to $1,425 per ton in March. Steel ERW line pipe X52, fob mill US was assessed at $1,500 to $1,650 per ton on the same date, representing a 3.28% increase following two consecutive months of price stability.
The last time domestic OCTG prices exceeded $2,000 per ton was January 2023, during the post-pandemic supply chain reconstruction cycle. Industry participants who witnessed that pricing environment note that the current structural drivers appear more durable than the demand-pull dynamic of 2022–2023, because the current disruptions affect supply from multiple independent directions rather than reflecting a single demand surge that eventually rebalances.
| Scenario | Key Assumptions | Projected Price Range |
|---|---|---|
| Base Case | Hormuz partially reopens Q3 2026; anti-dumping cases proceed on standard timeline | $1,600–1,750/ton |
| Elevated Case | Hormuz blockade extends through Q3; preliminary duties imposed on schedule | $1,800–1,950/ton |
| Stress Case | Prolonged closure + full duty imposition + HRC shortage persists into Q4 | $2,000+/ton |
The most revealing near-term demand signal comes from distributor-level sales data. Sales volumes at US pipe and tube distributors reportedly quadrupled between February and March 2026, a pace of activity that reflects both genuine demand acceleration and pre-emptive inventory building by buyers anticipating further price increases and supply restrictions.
Disclaimer: Price projections represent scenario-based analysis and not financial advice. Commodity price forecasts are inherently uncertain and subject to rapid change based on geopolitical developments, regulatory decisions, and macroeconomic conditions.
What Is Driving Demand Higher at the Worst Possible Time
The demand side of the equation is being reshaped by three converging forces, each with a distinct timeline and mechanism.
Oil Price Recovery and Rig Count Expansion
Oil price recovery and rig count expansion represent the most immediate driver. With WTI crude surpassing $110 per barrel, the economic calculation for drilling programmes has shifted decisively in favour of acceleration. Oil companies are reportedly beginning to add rigs in response to the improved price environment, converting previously deferred projects into active drilling programmes. This directly translates into OCTG consumption at the wellsite.
AI Data Centres and Natural Gas Infrastructure
AI data centre construction and natural gas infrastructure represent a structural demand driver with no parallel in previous OCTG cycles. The electricity load requirements of large-scale artificial intelligence computing infrastructure are driving significant increases in natural gas-fired power generation capacity. Building that generation capacity requires not only power plant construction but also expanded pipeline infrastructure, which in turn requires ERW line pipe and related OCTG products. This demand stream is multi-year in character and largely price-inelastic, meaning it persists even if pipe prices rise substantially.
Politically Accelerated Project Timelines
Politically accelerated project timelines add urgency to demand that might otherwise be spread over a longer period. A decade of underinvestment in energy infrastructure, attributed in part to policy uncertainty from successive administrations, has created a backlog of deferred projects. Operators are reportedly compressing timelines to advance as much in-ground progress as possible within the current political window, releasing pent-up demand simultaneously rather than in a measured sequence.
The supply chain for US energy infrastructure is being rewritten in real time. The combination of commodity price recovery, AI-linked energy demand, and project acceleration creates a demand environment that is qualitatively different from any single-factor cycle this market has experienced.
Strategic Implications for Buyers, Distributors, and Producers
For buyers and distributors, the spot market is now both expensive and unreliable. The strategic priorities in this environment include:
- Evaluating long-term contract structures with domestic mills, even at a premium to current spot levels, to secure supply certainty
- Assessing whether existing inventory positions reflect the new supply reality or were sized for a normal market
- Identifying OCTG import sources not currently subject to active petitions, understanding that the available list is shrinking
- Monitoring the ITC preliminary injury determination expected in mid-May 2026 as a critical signal for whether import flows from named countries will tighten further
For domestic producers, the constraints are upstream as much as downstream. Key considerations include:
- Hot-rolled coil procurement strategy: locking in long-term supply agreements with domestic mills may provide cost certainty in an increasingly volatile feedstock market
- Evaluating whether the current price environment justifies accelerated capital expenditure on capacity expansion, while acknowledging the 18 to 36-month lead time before new capacity comes online
- Preparing for the competitive landscape shift that preliminary duty determinations in September and November 2026 will create
Risk factors that could alter the outlook deserve equal attention from any participant planning around the current trajectory:
- A diplomatic resolution or ceasefire restoring Hormuz transit would rapidly rebuild UAE export capacity and ease spot market pressure
- A faster-than-expected ITC injury determination could accelerate the chilling effect on imports from named countries
- Restoration of domestic HRC mill availability would ease the upstream feedstock constraint on domestic OCTG production
- An oil price correction below $80 per barrel could stall drilling programme expansion and dampen demand-side momentum
The Deeper Question: Is This a Warning About US Energy Supply Chain Resilience?
The 2026 OCTG situation illustrates a structural vulnerability that has been building for decades. The concentration of domestic steel production into four major players controlling approximately 80% of market share means the US has essentially traded supply chain diversity for efficiency, and is now experiencing the cost of that trade-off at the worst possible moment.
The global OCTG trade architecture is simultaneously being redrawn from multiple directions. Canada's August 2025 investigation targeting OCTG imports from five countries including the United States adds another layer of complexity, signalling that trade enforcement is not a uniquely American phenomenon but a broader trend reshaping international steel flows. As each enforcement round eliminates another competitive import source, the pressure on remaining suppliers intensifies.
What the current crisis makes unmistakably clear is that energy security and steel supply chain security are not separable policy domains. OCTG availability is a direct function of both, and the situation of US OCTG prices soaring on Hormuz disruption and anti-dumping cases demonstrates how disruption in either dimension cascades into drilling programme delays, infrastructure construction slowdowns, and ultimately into the energy supply that underpins the broader economy.
Whether the US investment and policy community draws the lesson that strategic OCTG stockpiling, analogous to the Strategic Petroleum Reserve, warrants consideration is a question this market may force onto the agenda sooner than anyone anticipated.
Readers seeking current OCTG pricing benchmarks and steel supply chain intelligence can access Fastmarkets' steel energy tube and pipe price assessments, including API 5CT Casing J55 and ERW line pipe X52 grades, at fastmarkets.com. Price data, forecasting analysis, and market intelligence tools are available through the Fastmarkets platform.
Want to Stay Ahead of the Next Major Resource Discovery Driven by Energy Market Shifts?
As OCTG prices surge and energy infrastructure demand accelerates, the upstream mining and exploration sectors are responding in kind — and Discovery Alert's proprietary Discovery IQ model instantly identifies significant ASX mineral discoveries the moment they are announced, transforming complex data across 30+ commodities into clear, actionable insights. Explore how historic mineral discoveries have generated extraordinary returns and begin your 14-day free trial at Discovery Alert to position yourself ahead of the market.