
July 18, 2026
The Chokepoint That Moves Markets: Understanding the Hormuz-to-Wellhead Pipeline
Every significant shift in global oil pricing ultimately traces back to a handful of physical realities: how much crude is flowing, where it is flowing from, and whether the routes carrying it remain open. When one of those routes comes under genuine threat, the repricing that follows is rarely subtle. The current environment offers a textbook illustration of how a single geographic chokepoint can simultaneously reshape futures curves, accelerate onshore drilling programmes, and transmit cost pressure through to consumers filling their tanks at the pump.
Understanding why US oil drilling picks up as Brent gains 4% requires stepping back from the headlines and examining the structural mechanics connecting geopolitical risk, commodity pricing, and the capital allocation decisions made by upstream operators across American shale basins.
When big ASX news breaks, our subscribers know first
The Strait of Hormuz: Why a 21-Mile-Wide Channel Controls Global Energy Economics
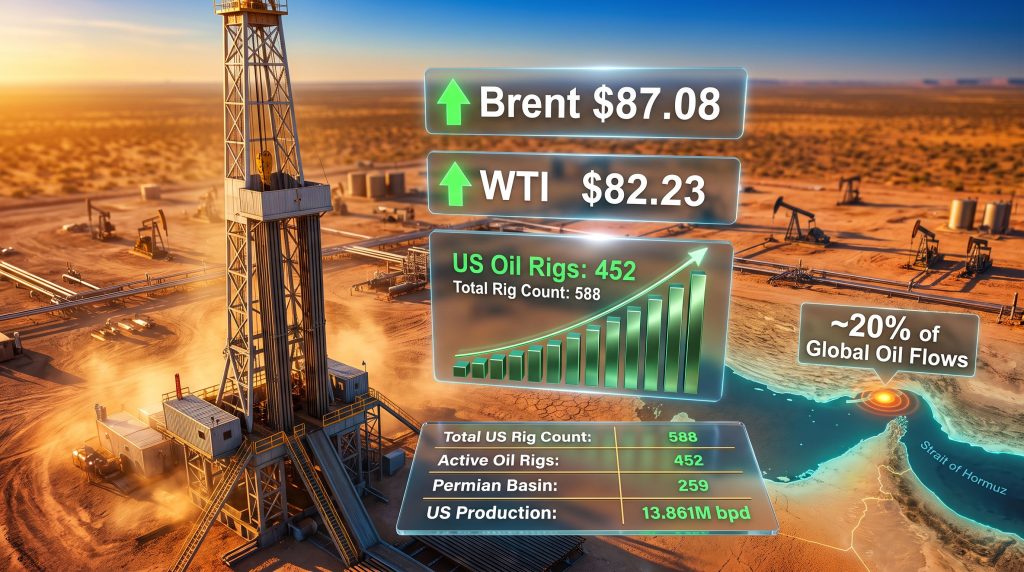
The Strait of Hormuz, at its narrowest point spanning roughly 21 miles, handles the transit of approximately 20% of all globally traded oil. No other single passage concentrates that volume. The Persian Gulf producers that depend on Hormuz for export access collectively account for a disproportionate share of the world's proven reserves, making disruption there qualitatively different from supply interruptions elsewhere.
What makes the current escalation particularly significant is the distinction between news-driven price spikes and structurally sustained risk premiums. Short-term spikes typically resolve within days as initial panic subsides. Sustained risk elevation, by contrast, embeds itself into the forward curve, altering the calculus for producers, refiners, and traders across multi-week and multi-month horizons.
The Iran conflict has introduced exactly this kind of structural repricing. With US strikes on Iran-linked tankers near Kharg Island, Houthi preparations for renewed Red Sea attacks, and the International Maritime Organization warning shippers against Hormuz transits, the market is no longer pricing in a temporary disruption. It is pricing in an extended period of supply route uncertainty.
Brent futures flipping into backwardation signals that traders are paying a premium for immediate delivery over future delivery, a definitive indicator of near-term physical tightness rather than speculative momentum.
Backwardation is a technically precise market signal. When spot prices exceed futures prices across the curve, it reflects genuine concern about near-term supply availability. Historical precedents reinforce this interpretation: Brent entered backwardation during the 2022 Russia-Ukraine escalation and following the 2019 Aramco infrastructure attack, both of which preceded significant upstream investment acceleration cycles. Understanding crude oil price trends helps contextualise why these backwardation signals carry such weight for operators and traders alike.
Brent and WTI: Anatomy of a $12 Weekly Gain
The scale of the recent price move warrants careful attention. Brent crude surged approximately 4.55% to $87.65 per barrel, representing a weekly gain of roughly $12 per barrel, the largest single-week move since April. WTI tracked closely, reaching $82.23 to $82.69, an advance of approximately 4.15% to 4.74% on the day.
A $12 weekly gain is not noise. In percentage terms, it compresses into the crude price a risk premium that would ordinarily accumulate over months of gradual repricing. It also creates immediate and powerful incentive structures for onshore producers whose breakeven economics are now operating well below prevailing market prices. Furthermore, this kind of oil price rally often accelerates capital deployment decisions that producers had previously placed on hold.
Refined product markets confirmed the transmission effect. Gasoline futures advanced approximately 3.80% to $3.409, placing retail pump prices on a trajectory toward the psychologically significant $4 per gallon threshold. Heating oil futures rose a more measured 0.71% to $4.059, while Asian LNG spot prices surged 10% as Hormuz disruption reignited supply security concerns throughout importing nations.
China's response was immediate: the country moved to raise retail gasoline and diesel prices following crude input costs rising approximately 12% in a single week, a stark illustration of how rapidly geopolitical risk transmits through refining chains into consumer economies. South Korea pivoted toward Red Sea routing alternatives, and Japan's trade officials formally classified Hormuz transits as off-limits.
How Crude Prices Translate Into Drilling Decisions
The relationship between crude pricing and rig activation is not linear, but it does follow well-documented economic thresholds. Permian Basin operators generally achieve breakeven economics between $35 and $50 per barrel, depending on well vintage, operator efficiency, and infrastructure access. At current Brent levels above $87 and WTI above $82, the margin incentive to drill is substantial.
The critical threshold for multi-week rig expansion cycles has historically sat around $80 per barrel for WTI. Sustained pricing above that level tends to unlock capital allocation decisions that were previously deferred, as producers gain confidence that the price environment will persist long enough to justify the full cycle economics of new wells.
Several basin-specific factors shape how quickly that price signal translates into rig additions:
- Infrastructure access determines how quickly new wells can be tied into gathering systems and export pipelines, with the Permian's dense network offering faster time-to-market than frontier areas.
- Operator balance sheet health after the post-2020 consolidation cycle has left major Permian operators with lower debt loads and greater capacity to fund drilling programmes at current strip prices.
- Drilled but uncompleted (DUC) well inventories allow some operators to accelerate production without adding rigs, by deploying completion crews to already-drilled wellbores, which is why the Frac Spread Count can sometimes move independently of the rig count.
- Gas-to-oil ratios within specific reservoir zones influence operator preference for oil-focused versus gas-focused drilling programmes, particularly relevant as natural gas prices remain subdued relative to crude.
Baker Hughes Rig Count: What the Numbers Reveal
The latest Baker Hughes data, published Friday, July 17, 2026, confirmed a meaningful expansion in US drilling activity. US rig count trends provide important historical context for interpreting whether this expansion represents a genuine inflection point or a short-term reaction.
| Metric | Current Week | Prior Week | Year-Ago Level |
|---|---|---|---|
| Total US Rig Count | 588 | 586 | 544 |
| Active Oil Rigs | 452 | 445 | 422 |
| Active Gas Rigs | 126 | 126 | 117 |
| Miscellaneous Rigs | 10 | 10 | N/A |
Oil rigs rose by 7 to reach 452, sitting 30 rigs above year-ago levels. Gas rigs held steady at 126, itself representing a 9-rig year-over-year improvement. The total count of 588 rigs is 44 rigs higher than the equivalent week in the prior year, a structural gain that reflects sustained producer confidence rather than a single-week reaction.
What is less commonly discussed is the qualitative shift in how these rigs are being deployed. Modern horizontal drilling technology, combined with extended lateral lengths now routinely exceeding two miles in the Permian, means each additional rig today carries far greater productive potential than a rig counted a decade ago. The per-rig production impact has expanded significantly, compressing the volume of rigs required to sustain or grow output compared with earlier shale cycles. According to recent Baker Hughes reporting, this trend of improving per-rig efficiency continues to reshape how analysts interpret headline rig count figures.
Basin-Level Breakdown: Where the Growth Is Concentrated
Permian Basin: Structural Dominance With Room to Expand
The Permian Basin added 3 rigs to reach 259 active drilling rigs, the highest basin concentration in the country. Despite the weekly gain, the Permian remains 4 rigs below year-ago levels, a gap that suggests meaningful headroom for further expansion if current pricing is sustained.
The Permian's dominance stems from its unique geological characteristics: stacked pay zones across the Spraberry, Wolfcamp, Bone Spring, and Dean formations allow operators to target multiple productive horizons from a single surface location, fundamentally improving capital efficiency. The Delaware Basin sub-play within the Permian is particularly notable for its liquids-rich output and relatively lower water cut in shallower zones, factors that improve per-well economics materially.
Eagle Ford: Steady Production Discipline
The Eagle Ford held flat at 47 active rigs, though this represents a 6-rig improvement compared with the same week in the prior year. Operator strategy in the Eagle Ford reflects a broader industry maturation: rather than chasing rig count growth, major producers are optimising existing well density, refrac programmes on older wellbores, and artificial lift configurations to extract more volume from established acreage.
The Eagle Ford's light sweet crude output is particularly well-suited to Gulf Coast refinery configurations, giving producers a logistical advantage in accessing premium markets without significant pipeline tariff exposure.
Natural Gas Rigs: Disciplined Stability
Gas rigs holding steady at 126 reflects operator discipline in an environment where Henry Hub prices remain relatively soft. The Marcellus Shale underpins a significant portion of this count, with its extraordinary reservoir quality and proximity to Northeast demand centres providing a structural cost advantage over Gulf Coast gas production. Long-term LNG export contract positioning by Asian buyers continues to underpin gas drilling economics for operators with export-linked contracts, even when spot gas prices are uninspiring.
The next major ASX story will hit our subscribers first
Production Volumes and the Lag Effect
US crude oil production averaged 13.861 million barrels per day for the week ending July 10, 2026, a marginal increase from 13.860 million bpd the prior week, and a year-over-year expansion of approximately 486,000 bpd. For reference, pre-pandemic peak production reached approximately 13.1 million bpd in early 2020, placing current output at genuine historical record territory.
The Frac Spread Count, tracked by Primary Vision, fell by 5 to 200 crews for the same period, following a gain of 5 crews the prior week. This oscillation is characteristic of normal scheduling variability rather than directional retreat.
A critical insight that many investors miss: the rig count and the frac spread count measure different stages of the same production pipeline. Drilling a well creates a drilled-but-uncompleted asset; hydraulic fracturing and completion converts that asset into a producing well. Watching both metrics in parallel provides a more complete picture of the production runway than either data series alone.
The spud-to-first-oil timeline typically spans 60 to 120 days, depending on basin, well complexity, and operator logistics. This means the current six-week rig count expansion streak, the longest since 2022, is building a production ramp that will begin to emerge in output data through the third and fourth quarters of 2026. Industry analysts tracking slowing drilling activity note that the current acceleration stands in sharp contrast to the more cautious stance operators adopted earlier in the year.
The Supply Response Paradox and OPEC+ Dynamics
The US shale supply response mechanism creates an inherent tension within the current price rally. Higher prices incentivise additional drilling, which eventually adds supply, which can moderate the very price elevation driving the activity. The 2018-2019 shale boom demonstrated this dynamic clearly, with US production growth ultimately capping Brent well below levels that OPEC production discipline alone might have sustained.
The critical variable is timing. If geopolitical risk resolves faster than the drilling-to-production lag, the price correction may arrive before new US supply has any measurable market impact. Conversely, if Hormuz uncertainty persists for multiple months, US production additions could coincide with an eventual de-escalation, amplifying the downside price correction.
OPEC's market influence remains a decisive factor in this equation. Current production cut compliance has been imperfect across several member states, and sustained prices above $85 increase the temptation for higher-cost members to exceed quotas while prices support the economics. A coordinated production increase by OPEC+ would introduce a second simultaneous source of supply growth, potentially accelerating the price moderation timeline. Consequently, the oil market volatility generated by these competing forces creates a complex backdrop for producers making multi-year capital commitments.
Scenario Analysis: Price Pathways and Drilling Responses
| Scenario | Brent Price Implication | Expected US Drilling Response |
|---|---|---|
| Hormuz closure sustained beyond 30 days | $90 to $100+ per barrel | Accelerated rig addition, 600+ total rigs |
| Ceasefire or de-escalation | $75 to $80 per barrel | Rig count plateaus or modest pullback |
| Full Iran conflict resolution | $65 to $72 per barrel | Rig count contraction as margin narrows |
| OPEC+ production increase | $70 to $78 per barrel | Selective reductions in higher-cost basins |
Disclaimer: These scenarios represent analytical projections based on historical market behaviour and current conditions. They are not investment advice and should not be relied upon as forecasts. Actual outcomes will depend on factors that are inherently unpredictable.
Inventory Dynamics and Downstream Pressure
US crude oil and gasoline inventories continued declining in the most recent EIA reporting period, removing a potential buffer against price escalation. Falling inventory levels interact with geopolitical supply risk to amplify price sensitivity: when storage cushions are thin, the market becomes more reactive to any incremental supply disruption signal.
The Strategic Petroleum Reserve remains available as a policy response tool if prices continue their trajectory toward $90 and beyond, though SPR drawdowns address symptom rather than cause and have historically provided only temporary price relief.
FAQ: US Oil Drilling and the Brent Price Surge
What does it mean when Brent futures flip into backwardation?
Backwardation occurs when the spot price of crude exceeds the price of futures contracts for later delivery. It signals that physical oil is in immediate tight supply, and that traders are willing to pay a premium for barrels available now rather than in future months. It is considered one of the most reliable indicators of genuine near-term market tightness.
Why did Brent surge approximately 4% in a single week?
The price advance reflects escalating concern about supply route security through the Strait of Hormuz amid the ongoing Iran conflict, compounded by declining US inventory levels and strong physical demand signals from Asian and European buyers seeking alternative supply arrangements.
Does a rising rig count immediately increase oil production?
No. The spud-to-first-oil timeline runs between 60 and 120 days in most US basins. Rising rig counts are leading indicators of future production growth, not an immediate supply response.
What is the Frac Spread Count and why does it differ from the rig count?
The rig count measures active drilling operations, while the Frac Spread Count, published weekly by Primary Vision, tracks the number of crews actively completing wells through hydraulic fracturing. Completion activity is the immediate precursor to first oil flow, making it a more proximate leading indicator of production additions than the rig count alone.
What Brent price level tends to trigger accelerated US shale drilling?
Sustained WTI pricing above approximately $80 per barrel has historically been the threshold at which multi-week rig expansion cycles activate across major US basins. Permian Basin breakeven economics of $35 to $50 per barrel mean operators generate substantial margin at current price levels.
Key Takeaways for Energy Market Watchers
- Geopolitical risk is now structurally embedded in the forward curve, not merely reflected in a short-term spot price reaction, as confirmed by Brent's shift into backwardation.
- US oil drilling picks up as Brent gains 4%, reflecting rational producer responses to a price environment offering margins well above basin-level breakevens.
- The six-week rig expansion streak signals building producer confidence and points toward a measurable production ramp in Q3 and Q4 2026.
- Downstream transmission is broadening, with gasoline approaching $4 per gallon, Asian LNG spot prices surging 10%, and China implementing retail fuel price increases.
- The supply response paradox remains the critical long-term variable, as additional US output may eventually moderate the same price rally currently incentivising expanded drilling.
- Record US production at 13.861 million bpd demonstrates the structural capacity of the American upstream sector, while also highlighting the proximity to the ceiling at which further growth requires sustained elevated prices to justify incremental capital deployment.
This article is provided for informational and educational purposes only and does not constitute investment advice. Energy market forecasts and scenario projections involve inherent uncertainty and should not be relied upon as predictions of actual outcomes.
Want to Track the Next Major Resource Discovery Before the Market Does?
Discovery Alert's proprietary Discovery IQ model scans ASX announcements in real time, instantly identifying high-potential mineral discoveries across more than 30 commodities and converting complex data into clear, actionable insights — explore the historic returns major discoveries have delivered and begin your 14-day free trial to position yourself ahead of the broader market.