May 13, 2026
The Hidden Fragility of American Energy: When Maritime Chokepoints Drain Domestic Reserves
Every major oil supply crisis in modern history has shared a common thread: the vulnerability was visible long before the disruption arrived. The structural dependency of industrialised economies on narrow maritime corridors has been a known risk since the tanker wars of the 1980s. Yet each new disruption exposes how little the underlying architecture has changed. When a critical chokepoint closes, the consequences do not stay contained in the Middle East. They materialise weeks later at American fuel terminals, refinery gates, and highway gas stations, measured in millions of barrels of inventory that simply are not there.
The current episode of US crude oil and gasoline inventories crashing as the Iran war takes its toll is not a market anomaly. It is the predictable outcome of a supply chain architecture that was never designed to absorb a sustained disruption of this magnitude. Furthermore, understanding the geopolitical oil price risks embedded in these corridors helps clarify why each successive crisis follows a disturbingly familiar pattern.
When big ASX news breaks, our subscribers know first
How Severely Are US Oil and Gasoline Inventories Actually Falling?
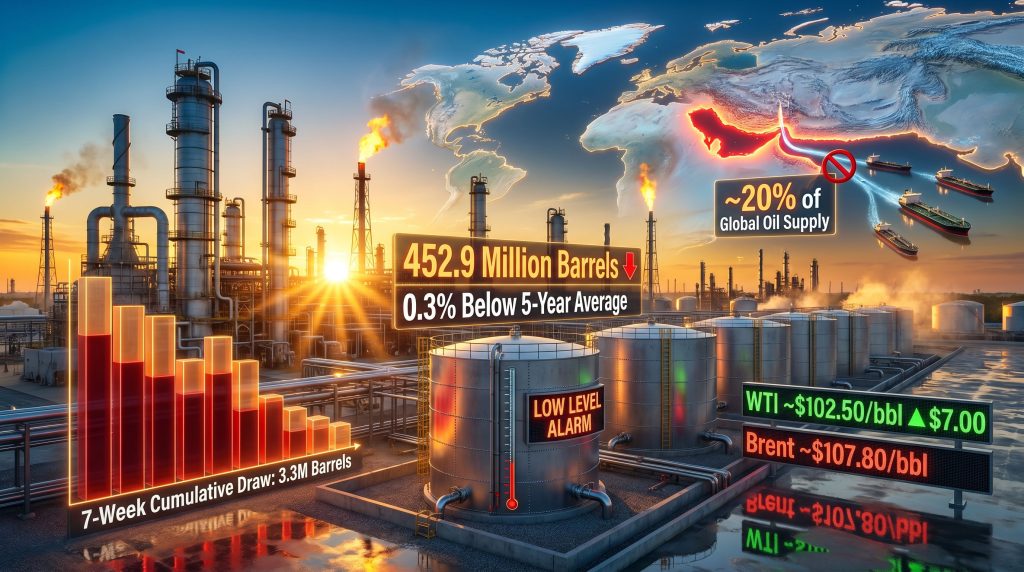
The most recent data from the U.S. Energy Information Administration, covering the week ending May 8, 2026, confirmed that commercial crude stockpiles fell by 4.3 million barrels, bringing total holdings to 452.9 million barrels. That figure sits 0.3% below the five-year seasonal average, a margin that sounds modest until viewed within its cumulative context.
Over the preceding seven-week period, EIA data shows that US crude inventories have declined by a total of 3.3 million barrels. The significance of this pattern lies not in any single week's figure but in the persistence of the drawdown across consecutive reporting periods. Sustained multi-week inventory depletion is a reliable indicator of structural supply-demand imbalance rather than seasonal fluctuation or short-term refinery scheduling.
The week before the EIA release, the American Petroleum Institute had separately reported a crude draw of 2.188 million barrels, broadly consistent with the government data but highlighting the degree to which both independent and official tracking systems are registering the same underlying supply pressure.
Gasoline Stocks: The Acceleration Is the Warning Signal
While crude inventory data attracts the most analytical attention, the gasoline figures are arguably more alarming in their trajectory. Total motor gasoline inventories fell by 4.1 million barrels in the most recent week, a significant acceleration from the prior week's decline of 2.5 million barrels. That escalation of roughly 64% week-over-week in the rate of decline signals intensifying demand-side pressure that domestic refining output is failing to offset.
Key gasoline market metrics as of the week ending May 8, 2026:
- Average daily gasoline production reached 9.8 million barrels per day
- Four-week average gasoline demand held at 8.9 million barrels per day
- National average retail gasoline prices reached approximately $3.57 per gallon, representing roughly a 25% increase from late December 2025 levels
- The retail price figure from live price feeds as of May 13, 2026 showed gasoline at $3.660 per gallon, with heating oil at $4.024 per gallon
The price increase has not generated meaningful demand destruction. Total US petroleum products supplied, the primary proxy for domestic oil consumption, averaged 20.1 million barrels per day across the most recent four-week period, up 1.1% compared to the same period in 2025. This demand inelasticity at elevated price levels suggests that American consumers and businesses have not yet materially curtailed fuel consumption despite a quarter's worth of price escalation, placing continued strain on already depleting stockpiles.
Distillate Inventories: A Technical Build That Masks a Deeper Problem
| Metric | Current Reading | Benchmark Comparison |
|---|---|---|
| Weekly Inventory Change | +200,000 barrels | Marginal build |
| Daily Production | 4.8 million bpd | Declining trend |
| Four-Week Average Demand | 3.7 million barrels | +1.3% year-over-year |
| Seasonal Position | 9% below five-year average | Significant structural deficit |
Middle distillates recorded a small weekly build of 200,000 barrels, which on the surface appears to be good news. However, the distillate picture carries a meaningful caveat: inventories remain 9% below the five-year seasonal average, a deficit with direct implications for diesel transportation, agricultural fuel supply, and heating oil availability as the second half of 2026 approaches. Daily distillate production has continued declining to 4.8 million barrels per day, meaning the modest build reflects demand softness in certain industrial segments rather than a genuine recovery in production capacity.
The Strait of Hormuz Disruption: Quantifying the Global Supply Shock
Understanding why US crude oil and gasoline inventories are crashing as the Iran war takes its toll requires a clear grasp of how Hormuz disruption physically translates into American fuel shortages. The mechanism is not abstract. It operates through a chain of compounding constraints that each individually would be manageable but together create a structural inventory collapse.
The Strait of Hormuz is the passage between Iran and Oman through which approximately 20% of total global daily oil supply transits. The conflict involving Iran has effectively constrained this corridor through a combination of mine threats, missile interdiction events, and security-driven tanker avoidance. Estimated production outages linked to the conflict have reached approximately 12 million barrels per day, representing roughly 10% of total global daily supply.
The International Energy Agency has characterised the current disruption as the most severe global energy security challenge in recent history, a designation that reflects both the volume of supply affected and the infrastructure damage extending beyond crude oil to pipelines, LNG terminals, and storage facilities across the Persian Gulf region.
Estimated crude oil value destroyed or rendered inaccessible within the first 50 days of the conflict exceeded $50 billion, equivalent to approximately 500 million barrels. Infrastructure repairs are expected to lag significantly behind any potential ceasefire timeline, meaning the supply disruption will extend well beyond active hostilities.
How Tanker Dynamics Feed US Inventory Depletion
The connection between a Middle Eastern maritime conflict and declining stockpiles at American refineries operates through several simultaneous channels:
- Tanker avoidance and rerouting reduce the volume of crude arriving at US refineries within normal delivery windows, creating feedstock deficits that directly limit throughput
- War-risk insurance premium escalation creates economic disincentives for transit that operate independently of any physical blockade, as underwriters restrict coverage or price it prohibitively
- Offshore cargo parking holds oil in floating storage that never enters EIA commercial inventory counts, creating the appearance of more severe physical depletion than supply-demand fundamentals alone would generate
- Refinery feedstock constraints prevent US Gulf Coast facilities, which are optimised for medium and heavy crude grades that historically transit Hormuz, from substituting alternative light crude grades without operational adjustments and efficiency losses
- OPEC spare capacity elimination removes the global production buffer that would normally compensate for regional disruption, with Reuters survey data confirming OPEC output has fallen to a 26-year low
A particularly underappreciated dynamic involves the crude grade specificity of US Gulf Coast refinery infrastructure. These facilities have been engineered and configured over decades to process medium and heavy sour crude grades that predominantly originate in the Persian Gulf. Consequently, when those specific crude types become unavailable, refineries cannot simply switch to domestic light sweet crude without incurring reduced yield efficiency, higher processing costs, and in some cases operational constraints that limit total throughput capacity. The oil market trade disruptions already reshaping import flows have made this grade-specificity problem significantly more acute.
Crude Oil Prices: What the Market Is and Is Not Pricing In
As of May 13, 2026, crude benchmarks are trading at elevated but not yet peak levels, reflecting market uncertainty about the conflict's trajectory rather than full pricing of a worst-case scenario.
| Benchmark | Current Level | Daily Change | Week-over-Week |
|---|---|---|---|
| WTI Crude | $102.50/barrel | +$0.27 (+0.26%) | +~$7.00 |
| Brent Crude | $107.80/barrel | +$0.03 (+0.03%) | +~$5.00 |
| OPEC Basket | $115.10/barrel | +$7.43 (+6.90%) | N/A |
| WTI Midland | $104.90/barrel | +$0.51 (+0.49%) | N/A |
| Indian Basket | $109.10/barrel | +$6.53 (+6.37%) | N/A |
| Crisis Peak (WTI) | $119.48/barrel | N/A | N/A |
The current trading range of approximately $102 to $108 per barrel for the major benchmarks sits meaningfully below the crisis-peak levels observed during peak escalation. This gap reveals something important about market psychology: participants are pricing in the current disruption but have not yet incorporated a sustained worst-case scenario. The oscillation between upward spikes when peace signals collapse and partial corrections when diplomatic signals emerge reflects acute uncertainty about duration rather than conviction in either direction.
According to analysis published by Morgan Stanley, oil market buffers could be exhausted before the Strait of Hormuz is fully reopened. That assessment, if accurate, would represent a fundamental shift in the supply equation, moving crude pricing from a disruption premium into a genuine scarcity framework where available physical barrels are insufficient to meet demand at any price level accessible to most importers.
The week-over-week gains of approximately $7 for WTI and $5 for Brent, while substantial in absolute terms, also suggest that incremental negative news is losing its marginal price impact — a pattern consistent with markets approaching the pricing ceiling supported by demand destruction expectations. Furthermore, OPEC's market influence over production decisions has been severely curtailed by the conflict, removing a key stabilising mechanism from the global supply equation. If Chinese demand contraction, India's fuel conservation measures, and slowing Asian industrial activity begin materially reducing global oil consumption, the upward price trajectory may face a ceiling before buffers are actually exhausted.
Global Supply Chain Reshuffling: Winners, Losers, and New Trade Routes
The disruption of Hormuz transit has triggered one of the most rapid restructurings of global crude trade flows in decades. Nations and trading companies that depend on Gulf crude have simultaneously scrambled to secure non-Hormuz supply sources, creating cascading reallocation effects that compound the pressure on US import availability.
Notable supply chain adjustments currently underway:
- Brazil to China crude exports have doubled, as Chinese buyers prioritise Atlantic Basin supply to avoid Gulf exposure. This reallocation directly reduces the pool of medium-heavy crude grades accessible to other importers, including US refiners
- Japan received its first Central Asian crude cargo since the Iran conflict began, illustrating the extreme lengths major importers are taking to establish non-Hormuz supply lines for a grade of crude they had not previously been sourcing from that region
- China's independent refiners, commonly referred to as teapot refiners, have sharply cut throughput as Hormuz disruption compresses their margins, reducing global refined product availability and contributing to secondary fuel shortages across Asian markets
- Qatar has instructed vessels at key LNG terminals to operate without transponders, a signal that security concerns have expanded beyond crude oil to encompass liquefied natural gas export infrastructure, suggesting the energy disruption is broader than oil inventory data alone reflects
- OPEC production has fallen to a 26-year low, confirmed by a Reuters survey, removing the global production redundancy that historically buffers single-region supply shocks
Emergency Reserve Responses Across Major Importers
Japan's strategic response is particularly instructive. With refinery utilisation reaching 73% whilst simultaneously releasing strategic oil stocks into the processing system, Japan is demonstrating a deliberate policy of drawing down national reserves to maintain industrial throughput. India is actively pursuing Russian crude import expansion as a substitute for Gulf supply losses, though it has separately rejected sanctioned Russian LNG, highlighting the complexity of navigating both supply security and sanctions compliance simultaneously.
Reports indicate the Trump administration is evaluating unconventional domestic supply access options, including the potential to tap oil reserves beneath US military installations. In addition, the US shale slowdown has further constrained the domestic production response that might otherwise have partially offset Gulf supply losses. The fact that such options are under consideration reflects the degree to which conventional supply mechanisms are perceived as insufficient to bridge the current inventory gap.
The Economic Spillover: From Pump Prices to Capital Markets
The inventory depletion and price escalation generated by the Iran war's impact on global supply chains have moved well beyond commodity markets into broader economic and financial indicators.
Consumer and household impact:
- Retail gasoline at approximately $3.57 to $3.66 per gallon represents a sustained and material increase in household transportation costs
- Heating oil trading near $4.024 per gallon places direct pressure on residential and commercial heating budgets, particularly in regions without natural gas access
- Jet fuel cost increases are threatening to disrupt summer air travel demand and airline sector profitability, with rising ticket prices potentially generating demand destruction in discretionary travel
- Oil sustained in the $100 to $150 per barrel range historically transmits into broader inflation across transportation, food production, agriculture, and utility cost chains, raising the spectre of a stagflationary environment if current price levels persist
Financial market impact has been significant:
- US equity markets registered sharp losses during peak crisis escalation, with the Dow Jones falling 1,232 points (-2.5%), the Nasdaq declining 2.7%, and the S&P 500 shedding 2.4%
- South Korean equity markets recorded a 7.2% decline, reflecting the acute vulnerability of Asia-Pacific economies that lack domestic crude production and depend heavily on Gulf supply
- Rising bond yields have increased borrowing costs across the corporate sector, compounding the economic pressure from energy cost escalation
- Russia has emerged as a paradoxical beneficiary, with high crude prices generating a $6.3 billion surge in oil revenues, partially offsetting production losses attributable to ongoing sanctions
The broader market volatility reset underway across equities, bonds, and commodities reflects how deeply energy price shocks penetrate financial systems when they persist beyond a single quarter. According to reporting on the conflict's economic fallout, the cascading effects on trade-dependent economies have been particularly severe.
The next major ASX story will hit our subscribers first
The IEA's Revised 2026 Forecast and Three Scenarios for US Inventories
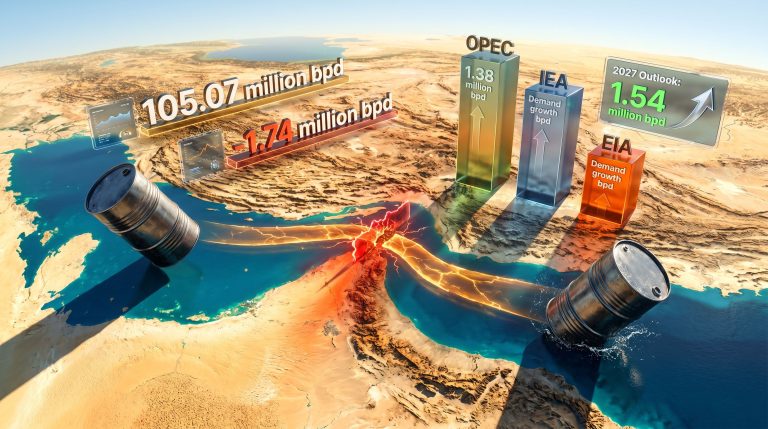
The International Energy Agency has revised its 2026 global oil supply-demand balance to reflect a widening deficit as Iranian production remains constrained. Prior expectations of steady output expansion from Gulf producers have been replaced with sustained contraction scenarios, whilst demand growth — particularly from India where Citi projects annual power demand growth of 5 to 6% — continues to exert upward pressure on global consumption.
The combination of reduced OPEC output and persistent demand growth creates a structural imbalance with no obvious near-term correction mechanism. Morgan Stanley's analysis that existing buffers may be depleted before Hormuz transit normalises suggests the timeline for inventory recovery may exceed what conventional market participants have factored into forward pricing.
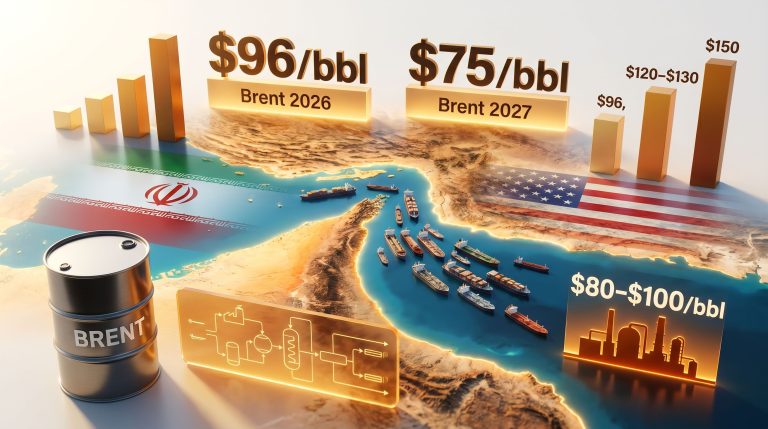
Three scenario pathways for US inventories illustrate the range of potential outcomes:
| Scenario | Core Assumption | Projected Outcome |
|---|---|---|
| Rapid Resolution | Hormuz reopens within 4-6 weeks; tanker flows normalise | Gradual inventory rebuild; WTI corrects toward $85-$90/barrel |
| Prolonged Stalemate | Conflict persists 3-6 months; partial transit only | Inventories fall below critical operational thresholds; WTI sustains above $110/barrel |
| Escalation | Conflict expands to additional Gulf producers | Acute physical scarcity; emergency SPR drawdowns; WTI tests $130-$150/barrel |
The escalation scenario carries particular analytical weight because ADNOC Gas has publicly indicated it is targeting approximately 80% recovery of the Habshan facility by end-2026, implying that significant regional infrastructure remains impaired and that full production restoration across the Gulf region is a multi-quarter undertaking regardless of conflict resolution timing.
What the Inventory Crash Reveals About America's Structural Energy Vulnerabilities
The persistent decline in US crude oil and gasoline inventories as the Iran war takes its toll is, at its core, a diagnostic of structural vulnerabilities that existed well before the first shot was fired. The current crisis has simply made them visible with unusual clarity.
Several systemic weaknesses have been brought into sharp relief:
- Refinery configuration dependency: US Gulf Coast facilities optimised for medium and heavy crude grades cannot rapidly adapt to alternative feedstocks without efficiency penalties and throughput reductions
- Strategic Petroleum Reserve limitations: The SPR was designed to bridge short-duration disruptions, not absorb multi-month supply shortfalls at the scale currently being experienced, with Morgan Stanley warning that buffers may be exhausted before the strait reopens
- Single chokepoint concentration risk: Routing approximately 20% of global daily oil supply through a single maritime passage represents a portfolio risk of extraordinary concentration that no amount of domestic production growth fully neutralises
- Demand inelasticity at current price levels: Total products supplied rising 1.1% year-over-year even as pump prices climb 25% suggests that American fuel consumption lacks meaningful short-term price sensitivity, extending the duration over which inventory depletion will continue
- Import grade specificity: The reallocation of medium-heavy Gulf crude toward Asian buyers competing for non-Hormuz alternatives removes the specific crude types that US refineries require, creating a shortage that is grade-specific rather than simply volumetric
The unfolding situation may generate sustained policy debate around domestic production expansion, strategic reserve replenishment protocols, refinery feedstock flexibility, and infrastructure investment in alternative import corridors. These structural reforms, if pursued, would address vulnerabilities that predate the current conflict and would persist regardless of its ultimate resolution timeline.
The weekly EIA inventory data will continue to serve as the most immediate barometer of how the Iran war's disruption of global crude flows is materialising in American fuel markets. For now, each successive report confirming additional draws brings the US inventory buffer closer to thresholds that would trigger more acute emergency responses, making the trajectory of Hormuz access the single most consequential variable in the 2026 global energy equation.
This article is intended for informational and educational purposes only and does not constitute investment, legal, or financial advice. Forecasts, scenario projections, and price targets referenced herein represent third-party analyst assessments and involve significant uncertainty. Readers should conduct independent research before making any financial or investment decisions related to energy markets.
Want to Stay Ahead of the Next Major Resource Discovery Driven by Shifting Energy Markets?
Discovery Alert's proprietary Discovery IQ model delivers real-time alerts on significant ASX mineral discoveries — turning complex market signals into actionable investment opportunities the moment they emerge. Explore how historic mineral discoveries have generated extraordinary returns and begin your 14-day free trial today to position yourself ahead of the broader market.