
July 11, 2026
The Efficiency Paradox Reshaping American Upstream Oil Strategy
The US oil rig count Baker Hughes releases each week has become one of the most closely scrutinised indicators in global energy markets. For most of the twentieth century, the relationship between drilling activity and oil production was relatively linear. Add rigs, get more oil. Remove rigs, watch output fall. That predictable logic underpinned decades of investment cycles, OPEC strategy, and energy policy. What is unfolding in the US upstream sector in 2026 challenges that assumption at its foundation, and the weekly data is the clearest window into just how profoundly the industry has been restructured.
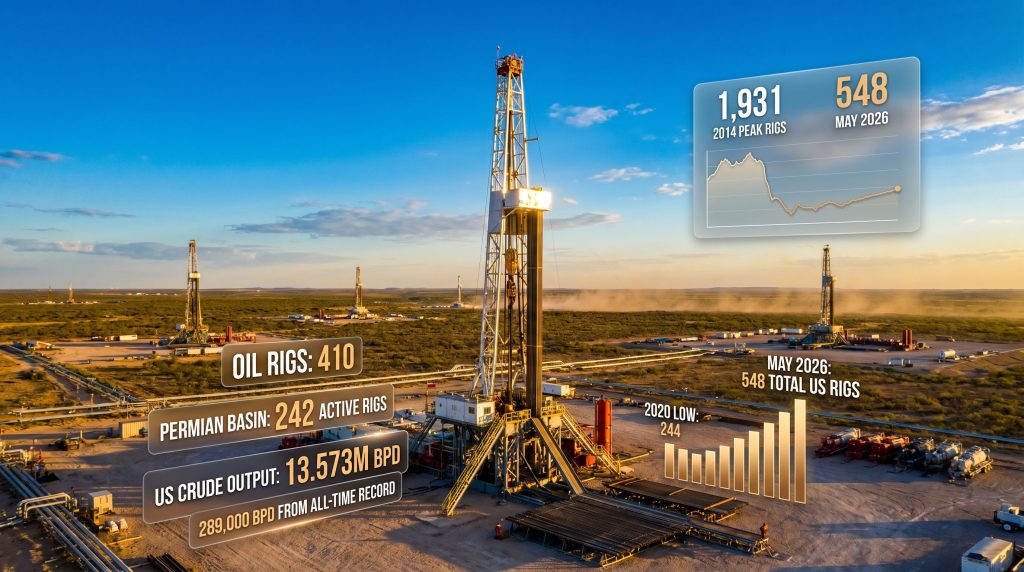
The numbers tell a story that defies conventional energy market intuition. With 548 total active rigs as of the week ending May 8, 2026, US operators are running fewer drilling units than at almost any point during the 2014 shale boom, yet crude production is sitting at 13.573 million barrels per day (bpd) — a figure that sits just 289,000 bpd below the all-time national production record, according to data reported by Oilprice.com citing Baker Hughes and the US Energy Information Administration (EIA). Understanding how these two facts coexist is arguably the most important analytical challenge in modern energy markets.
When big ASX news breaks, our subscribers know first
What the Baker Hughes Rig Count Actually Measures
Before interpreting the data, it is worth understanding precisely what is and is not captured in the weekly release. Baker Hughes defines an active rig as any rotary drilling unit that has been operating during the reporting week, segmented across three categories: oil-directed, gas-directed, and miscellaneous (which currently includes nine rigs engaged in geothermal and non-hydrocarbon drilling activities).
The report covers rotary rigs operating across the contiguous United States, Alaska, and the offshore Gulf of Mexico, and is published every Friday at noon Central Time. This release cadence creates a near-real-time signal of upstream capital deployment that analysts, traders, and operators watch closely.
Several important distinctions are worth noting:
- The rig count measures drilling intent, not production output, making it a leading rather than coincident indicator
- Well completion activity (hydraulic fracturing crews) is tracked separately by Primary Vision's Frac Spread Count, which offers the complementary completion-side signal
- Shut-in wells, reactivated legacy production, and enhanced oil recovery operations are entirely invisible to the rig count methodology
- Modern rig productivity varies enormously from the rigs counted in prior decades, making cross-era comparisons misleading without efficiency adjustments
The Baker Hughes rig count is best understood as a measure of new drilling momentum, not total productive capacity. A flat or declining count does not automatically signal production decline in an era of high-efficiency pad drilling.
Current US Oil Rig Count Snapshot: May 2026
The latest weekly data from Baker Hughes, as reported by Oilprice.com (May 8, 2026), presents the following picture:
| Category | Current Count | Week-over-Week | Year-over-Year |
|---|---|---|---|
| Total US Rigs | 548 | +1 | -30 |
| Oil Rigs | 410 | +2 | -57 |
| Gas Rigs | 129 | -1 | +21 |
| Miscellaneous Rigs | 9 | 0 | – |
Oil rigs account for approximately 75% of all active drilling units, reinforcing the crude-focused character of current US upstream programmes. Gas rigs represent roughly 24% of the total count but are moving in a strikingly different direction to their oil counterparts, a divergence explored further below.
Basin-Level Concentration
The geographic distribution of drilling activity reveals a high degree of capital concentration:
- Permian Basin (West Texas/New Mexico): 242 active rigs, up 1 on the week but down 43 year-over-year
- Eagle Ford (South Texas): 43 active rigs, unchanged week-over-week, down 3 from the prior year
- Combined, these two basins account for approximately 53% of all active US oil rigs
The Permian's 242 rigs make it by far the largest single concentration of oil-directed drilling activity in North America. Its stacked pay zones, mature midstream infrastructure, and competitive well economics continue to attract the majority of upstream capital deployment.
On the completion side, Primary Vision's Frac Spread Count rose by 5 to 174 active crews during the week ending May 1, 2026. This divergence between modestly rising frac spreads and a relatively flat rig count is a significant signal discussed in more detail below.
A Decade of Structural Transformation in US Drilling
Placing the current 548-rig count in historical context is essential for accurate interpretation:
| Period | Total US Rigs (Approx.) | Context |
|---|---|---|
| 2014 Peak | ~1,931 | Pre-crash shale boom maximum |
| 2016 Trough | ~404 | Post-oil price collapse low |
| 2019 Pre-COVID | ~800-900 | Moderate recovery phase |
| 2020 COVID Low | ~244 | Demand destruction nadir |
| 2022-2023 Recovery | ~750-780 | Post-pandemic rebound |
| Late 2025 | ~580-622 | Elevated but moderating |
| May 2026 | 548 | Measured consolidation |
The historical average for US oil rigs from 1987 through 2026 sits near approximately 498 rigs, placing the current count modestly above long-run norms despite sitting far below the 2014 peak. That peak, which saw approximately 1,609 oil rigs operating simultaneously, generated production volumes roughly comparable to what 410 oil rigs are achieving today.
This productivity multiplier — roughly 3.9 times more output per oil rig today versus the 2014 peak era — is the defining structural reality of modern US upstream operations. It reflects several compounding technological improvements:
- Extended lateral lengths — Modern horizontal wells routinely achieve laterals exceeding 10,000 feet, compared to 5,000–7,000 feet common during the earlier shale period
- Higher stage counts — Current completions commonly deploy 40–60 fracturing stages per well versus 20–30 stages typical in 2014
- Pad drilling economics — Modern operations drill 8–16 wells from a single surface pad location, dramatically reducing per-well surface costs and rig mobilisation time
- Real-time data and automation — Downhole sensors and automated pressure management have significantly reduced nonproductive time per well
The productivity implications are profound. Near-record US crude output at roughly one-quarter of the peak rig count means that the industry no longer needs a rig-count surge to sustain or modestly grow production. Furthermore, this has permanently altered how analysts should interpret rig count trends as a production signal. Consequently, US oil production trends are now decoupled from drilling activity in ways that were not possible a decade ago.
Three Forces Shaping the 2026 US Rig Count Trajectory
1. Oil Price Environment and the Hormuz Premium
Despite Brent crude trading near $100.40 per barrel and WTI at approximately $95.12 per barrel as of May 8, 2026, the rig count has not responded with the surge that historical price-to-rig correlations would predict. Both benchmarks remain elevated, partly supported by a geopolitical risk premium stemming from ongoing disruptions in the Strait of Hormuz. However, WTI fell approximately $6 over the preceding week, illustrating the price volatility that makes long-cycle drilling commitments financially hazardous for operators managing capital budgets on annual or multi-year horizons.
The muted drilling response to triple-digit Brent pricing is not operator irrationality. It reflects a calculated judgement that the Hormuz premium is geopolitical and therefore potentially temporary, and that committing additional rig activity to a commodity price spike that may reverse within quarters would destroy shareholder value rather than create it. In addition, trade war oil impacts have introduced further uncertainty into operator planning cycles, reinforcing the case for restraint.
2. Capital Discipline as a Structural Feature, Not a Cyclical Response
The post-2020 institutionalisation of returns-first capital frameworks among US independent producers is perhaps the most consequential structural shift in the upstream sector over the past decade. Prior to 2020, elevated crude prices consistently triggered rig count expansion as operators prioritised volume growth. That reflexive relationship has been deliberately dismantled.
Free cash flow is now systematically directed toward dividends, share buybacks, and debt reduction rather than aggressive rig additions. This shift reflects hard lessons from the 2015–2016 credit crisis, when overleveraged independents were decimated by falling oil prices after years of volume-maximising spending. Boards and management teams have structurally embedded capital discipline into their frameworks in ways that are unlikely to reverse quickly even at sustained oil prices above $90–100 per barrel.
Furthermore, US drilling activity decline observed through 2025 and into 2026 has reinforced this structural shift, with operators consistently signalling that volume growth is no longer the primary objective.
3. The Drilled-but-Uncompleted Well Inventory as a Production Buffer
The simultaneous rise in frac spread counts while rig counts remain relatively flat suggests operators are accelerating completions on drilled-but-uncompleted (DUC) wells rather than initiating new drilling campaigns. The DUC inventory functions as a production buffer: wells that have already been drilled but await hydraulic fracturing can be brought online relatively quickly without requiring new rig commitments.
When frac spread counts rise faster than rig counts, it typically signals that operators are drawing down DUC inventories. This represents a short-term production boost that may not be sustainable without renewed drilling activity over the subsequent 12–18 months.
This dynamic partially explains why US crude output remains near record highs despite oil-directed rig counts sitting 57 below year-ago levels.
The Gas Rig Divergence: A Separate Story Within the Same Dataset
One of the most analytically important features of the May 2026 Baker Hughes data is the directional divergence between oil and gas rigs. While oil rigs have declined 57 year-over-year, gas rigs have increased by 21 over the same period to reach 129 total active units.
This counter-cyclical movement reflects a structural realignment in natural gas drilling economics driven by global LNG demand. The International Energy Agency has projected tight gas supply conditions persisting through 2030, creating a durable incentive for gas-directed drilling that is somewhat insulated from short-term crude price volatility. The LNG supply outlook further supports this trajectory, with export-driven demand providing a sustained floor for gas-directed drilling investment.
US LNG export capacity expansion is particularly relevant here, with Gulf Coast export terminals creating proximity-based demand pull for gas production in key basins:
| Basin | Primary Product | LNG Export Relevance | Recent Trend |
|---|---|---|---|
| Haynesville (Louisiana/Texas) | Dry natural gas | High — proximity to Gulf Coast LNG terminals | Increasing |
| Appalachian (Marcellus/Utica) | Wet gas and dry gas | Moderate — requires extensive pipeline infrastructure | Stable |
| Permian (associated gas) | Associated gas | Indirect — flaring reduction regulatory pressure | Growing |
The gas rig recovery is occurring from a historically compressed base. Gas rigs collapsed from over 900 in 2008 to below 100 during the shale gas oversupply era, meaning the current 129-rig count, while recovering, still represents a fraction of historical peak gas drilling activity. The trajectory, however, is clearly upward as LNG export economics reshape long-term gas development incentives across producing basins.
The next major ASX story will hit our subscribers first
What the Year-over-Year Decline Means for Future Production
The 30-rig decline in total active rigs and 57-rig decline in oil-directed activity year-over-year carries real implications for production trajectories, though the relationship is lagged and non-linear. The typical industry lag between changes in rig count and corresponding shifts in production output ranges from 6 to 18 months, meaning the current drilling pullback from 2025 levels is likely to exert modest downward pressure on production growth through late 2026 and into 2027.
Three plausible trajectories emerge based on differing rig count assumptions:
| Scenario | Rig Count Assumption | Probable Production Outcome (12 Months) | Key Driver |
|---|---|---|---|
| Bull Case | Recovery toward 480–500 | Approaches or exceeds all-time high (~13.86M bpd) | Sustained $90+ oil prices; capital discipline partially relaxes |
| Base Case | Stabilisation at 420–450 | Flat to modest growth (~13.5–13.7M bpd) | Capital discipline maintained; DUC drawdown continues |
| Bear Case | Decline below 400 | Retreat toward 13.0–13.2M bpd | Oil price collapse or significant demand destruction event |
Disclaimer: Scenario projections involve assumptions about commodity prices, operator behaviour, and geopolitical conditions that are inherently uncertain. These scenarios should not be interpreted as forecasts or investment advice.
The near-term production cushion provided by the elevated frac spread count (174 crews) offers some confidence that output will not immediately decline even if rig counts remain flat. However, if DUC inventories are drawn down without corresponding new drilling activity, that buffer will eventually be exhausted.
Reading the Baker Hughes Data in Context: Key Takeaways
For investors, analysts, and energy market participants, the US oil rig count Baker Hughes publishes each week communicates several layered messages. OPEC's market influence adds an additional layer of complexity, as any sustained US production retreat could invite a strategic response from major producers. Consequently, the rig count carries geopolitical significance well beyond its technical remit.
- Total US rigs stand at 548, down 30 year-over-year, reflecting disciplined capital allocation rather than operational distress
- Oil rigs at 410 remain the primary production driver, though the 57-rig year-over-year decline signals moderating new drilling momentum
- Gas rigs at 129 represent the structural outlier, rising 21 year-over-year as LNG export economics reshape gas development incentives
- Permian Basin at 242 rigs maintains its position as the undisputed centre of gravity for US oil drilling, despite a 43-rig year-over-year reduction
- US crude output at 13.573M bpd demonstrates near-record production capacity achieved with dramatically fewer rigs than historical peaks
- Frac spread count at 174 and rising provides near-term production support as DUC completions accelerate
The gap between today's 548 total active rigs and the 2014 peak of approximately 1,931 rigs, achieved while approaching all-time production records, encapsulates the productivity revolution that has fundamentally restructured US upstream economics. The US oil rig count Baker Hughes publishes weekly remains the industry's most-watched supply signal precisely because it captures the evolving intersection of capital discipline, technological efficiency, and commodity market signals that determine whether American crude output grows, stagnates, or retreats.
For current and historical rig count data, readers can access the Baker Hughes Rig Count portal directly. The EIA's drilling productivity reports offer complementary analysis on the relationship between rig activity and production output across major US shale basins.
Want to Stay Ahead of the Next Major Resource Discovery?
While US upstream operators are mastering the art of doing more with less, Discovery Alert's proprietary Discovery IQ model delivers real-time alerts the moment significant ASX mineral discoveries are announced — translating complex resource data into actionable investment insights for traders and long-term investors alike. Explore how historic mineral discoveries have generated extraordinary returns and begin your 14-day free trial today to ensure you never miss a market-moving announcement.