
July 25, 2026
When Efficiency Outpaces the Drill Bit: Understanding What the US Oil Rig Count Really Measures
There is a persistent assumption embedded in mainstream energy analysis: more drilling equals more oil. For most of the twentieth century, that relationship held with reasonable consistency. However, the shale revolution has quietly dismantled that arithmetic. Today, the US oil rig count and Baker Hughes rig data remain among the most watched weekly releases in global commodities, yet their interpretation has grown considerably more complex. Understanding what this data actually captures, and what it deliberately excludes, is now a prerequisite for reading the upstream oil market correctly.
When big ASX news breaks, our subscribers know first
Understanding the Baker Hughes Weekly Rig Census: Methodology and Market Significance
Baker Hughes has published its weekly North American rig count since 1944, making it one of the longest-running continuous datasets in the energy industry. Despite its longevity, the methodology contains precise definitional boundaries that are frequently misunderstood by casual observers.
A rig qualifies as active in the Baker Hughes census only when it is physically on location and in the process of drilling. The count deliberately excludes:
- Rigs that are in transit between drilling locations
- Equipment in the rigging-up or rigging-down phase at a new site
- Units engaged in workover operations on existing wells
- Rigs performing completion activities such as hydraulic fracturing or perforation
This definitional precision has a critical implication: the weekly Baker Hughes rig data captures only the drilling phase of the well construction lifecycle. It is a leading indicator of future production capacity, not a real-time measure of output. Production responses to rig count changes typically materialise with a lag of three to six months, depending on basin-specific completion timelines and operator scheduling.
The data is released every Friday at noon Central Time, covering the full reporting week that ended the prior Thursday. It is segmented across multiple dimensions including US state and basin, drill type (horizontal, vertical, or directional), and commodity type (oil versus gas). A separate count is published for Canada. This granularity is what makes Baker Hughes rig data valuable across a range of analytical applications, from supply forecasting to oilfield services revenue modelling.
"The rig count tells you where production is heading, not where it is today. It measures intention and activity, not output."
What the Latest Baker Hughes Rig Count Data Shows
US Total Rig Count Snapshot: Week Ending July 17, 2026
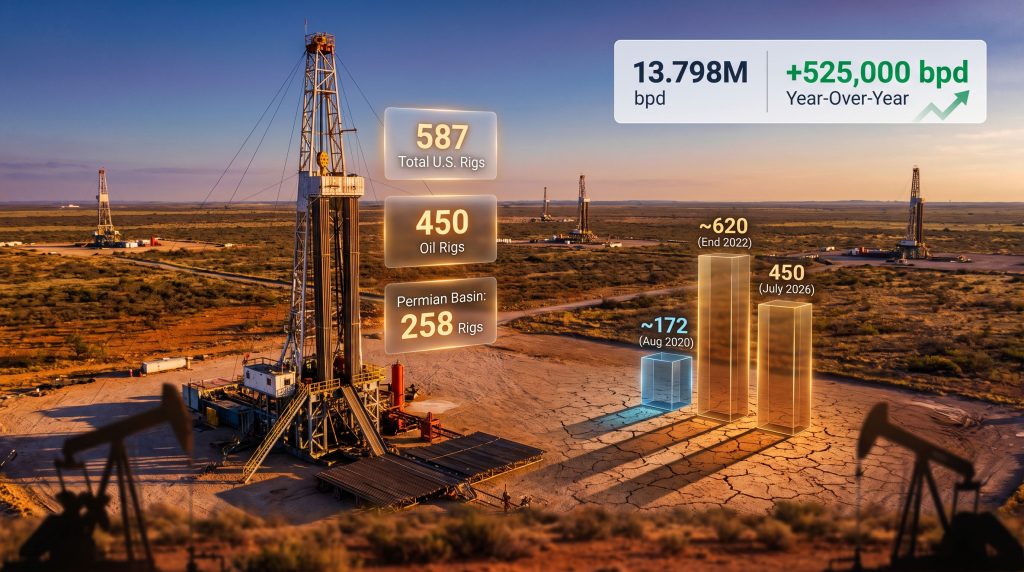
The most recent Baker Hughes release covering the week ending July 17, 2026 recorded a total US active rig count of 587 rigs, representing a net decline of one rig from the prior week but a year-over-year gain of 45 rigs compared to the same period in 2025.
| Metric | July 3, 2026 | July 17, 2026 | Year-Over-Year Change |
|---|---|---|---|
| Total US Rigs | 581 | 587 | +45 |
| Oil Rigs | 445 | 450 | +35 |
| Gas Rigs | 126 | 127 | +5 |
| Miscellaneous Rigs | 10 | 10 | Flat |
The week-over-week breakdown reveals a nuanced picture beneath the headline number:
- Oil rigs declined by 2 from the prior week, settling at 450 active units
- Gas rigs increased by 1, reaching 127 active units
- Miscellaneous rigs held steady at 10
- Net weekly change was a decline of 1 rig across all categories
The year-over-year improvement of 35 oil rigs reflects a gradual recovery from the capital-constrained environment of 2024 and early 2025. However, the pace of that recovery remains well below the aggressive drilling cycles seen during the 2011 to 2014 shale boom era. The broader context of US drilling activity decline in 2025 helps explain why this measured improvement is nonetheless being viewed constructively by many analysts.
Why US Oil Drillers Pulled Back Despite Near-$100 Oil Prices
The Disconnect Between Elevated Prices and Drilling Activity
The marginal pullback in active oil rigs during a week when Brent crude was trading near $96 per barrel and WTI hovered around $88 per barrel presents a structural puzzle. In previous commodity cycles, sustained prices at these levels would have triggered a significant acceleration in drilling programmes across US shale basins. That response has not materialised to the same degree in 2026, and the reasons illuminate a fundamental transformation in how US operators approach capital allocation.
Several converging factors explain the divergence between price signals and drilling behaviour:
-
Capital discipline frameworks: The major publicly listed exploration and production companies in the US shale sector have broadly pivoted away from the growth-at-all-costs model that defined the 2010s. Shareholder return programmes, including elevated dividends and share buyback commitments, now consume a substantial portion of free cash flow that would previously have been reinvested into new drilling.
-
Supply chain tightness: Pressure pumping capacity, steel tubular goods, and skilled labour continue to act as binding constraints across the Permian Basin and other key plays. Service cost inflation during the 2021 to 2023 recovery eroded well-level economics even as commodity prices rose.
-
Geopolitical risk premiums in pricing: A meaningful portion of the current crude price elevation reflects conflict risk in the Middle East, including disruptions connected to Houthi activity in the Red Sea and elevated war risk around the Strait of Hormuz. Producers tend to treat geopolitical risk premiums as transient rather than structural, making them hesitant to sanction multi-year drilling commitments on the basis of prices they expect to normalise.
-
Completion bottlenecks compounding the slowdown: The Primary Vision Frac Spread Count, which tracks active hydraulic fracturing crews completing drilled wells, fell by 4 crews in the week ending July 17, 2026, to 196 active crews, following a loss of 5 crews in the prior week. This two-week decline of 9 frac crews compounds the signal from the oil rig count, suggesting that the entire well construction pipeline from drilling through to completion is softening simultaneously.
"When commodity prices are elevated primarily because of geopolitical supply disruptions rather than demand-pull fundamentals, disciplined operators tend to resist committing long-cycle capital to new programmes. The risk of drilling into a price correction is asymmetric."
This is not indecision on the part of operators. It reflects a deliberate recalibration of risk tolerance that has been institutionalised across the sector following the boom-bust cycles of 2014 to 2016 and 2020. Furthermore, the broader question of oil prices and trade war dynamics has added another layer of uncertainty that continues to weigh on producer confidence.
Basin-Level Breakdown: Where US Drilling Activity Is Concentrated
Permian Basin: Dominant but Softening at the Margin
The Permian Basin in West Texas and southeastern New Mexico retained its position as the single most active drilling region in the United States, though it was not immune to the week's modest pullback.
- Active rigs in the Permian Basin: 258 as of the latest reporting period
- Week-over-week change: down 1 rig
- Year-over-year comparison: 2 rigs below the same period in 2025
The Permian's marginal year-over-year decline is particularly notable given that it remains the most productive basin per active rig in North America. Operators have concentrated activity in the highest-return portions of the Midland and Delaware sub-basins, deploying longer horizontal laterals and tighter completion designs to extract more production per well than was achievable even five years ago.
Eagle Ford Shale: A Measured Recovery in South Texas
The Eagle Ford continued to demonstrate more constructive year-over-year momentum than the Permian, holding steady week-over-week while recording a meaningful gain compared to 2025 levels.
- Active rigs in the Eagle Ford: 47
- Week-over-week change: flat
- Year-over-year comparison: up 8 rigs versus the same period in 2025
| Basin | Current Rig Count | Week-Over-Week | Year-Over-Year |
|---|---|---|---|
| Permian Basin | 258 | -1 | -2 |
| Eagle Ford | 47 | Flat | +8 |
The Eagle Ford's recovery reflects sustained operator interest in the oil-rich windows of the play at current price levels. In addition, the formation's proximity to Gulf Coast refining and export infrastructure also reduces the logistical friction that constrains some inland basin economics.
How the Rig Count Connects to US Crude Oil Production
EIA Output Data: A Slight Dip Amid Historically Elevated Volumes
Weekly production figures from the US Energy Information Administration for the period ending July 17, 2026 recorded average crude output of 13.798 million barrels per day (bpd), a decline of approximately 63,000 bpd from the prior week's reading of 13.861 million bpd. Despite this near-term dip, output remains 525,000 bpd above the same week in 2025, underscoring the lagged effect of previous drilling campaigns that are still generating production.
The week-over-week softness in output, combined with the declining rig and frac spread counts, suggests that production growth entering the second half of 2026 may moderate if current drilling trends are sustained. Consequently, the trajectory of US oil production decline seen in 2025 serves as a useful reference point for understanding just how significant this current softening could become.
The Frac Spread Count: Reading the Completion Phase Signal
While the US oil rig count and Baker Hughes rig data track the drilling phase of well construction, the Primary Vision Frac Spread Count provides a complementary window into the completion phase:
- Week ending July 17, 2026: 196 active frac crews
- Prior week: 200 active frac crews (down 4 week-over-week)
- Two-week trend: down 9 crews across consecutive reporting periods
A falling frac spread count, when combined with declining oil rig activity, creates a compounding leading indicator that near-term production additions may slow even as existing well inventories continue producing at elevated rates. This dual-phase signal is more informative than either metric in isolation.
The next major ASX story will hit our subscribers first
How Does the Current Rig Count Compare Historically?
The 2020 to 2026 Trajectory: Structural Efficiency Replacing Raw Count
Placing the current data in historical context reveals how profoundly the sector has changed since the pandemic-era collapse.
| Period | Approximate US Oil Rig Count | Key Driver |
|---|---|---|
| March 2020 (COVID crash) | ~600 (declining sharply) | Demand collapse, OPEC price war |
| August 2020 (trough) | ~172 | Historic post-pandemic low |
| End of 2021 | ~480 | Recovery phase, OPEC+ restraint |
| End of 2022 | ~620 | Post-Ukraine invasion supply premium |
| Mid-2023 | ~540 | Capital discipline, price moderation |
| Mid-2025 | ~415 (oil rigs) | Efficiency gains offsetting count decline |
| July 2026 | 450 (oil rigs) | Geopolitical price support, measured recovery |
The structural efficiency story embedded in this table is critical and frequently underappreciated. A rig count of 450 in 2026 delivers materially more production than 450 rigs would have in 2016. Extended horizontal laterals now regularly exceed 15,000 feet in the Permian, compared to typical lengths of 7,000 to 9,000 feet a decade ago. Simultaneous fracking of multiple wells from a single pad, improved proppant placement, and data-driven completion optimisation have each contributed to productivity gains that allow the industry to sustain high output levels with a structurally smaller rig fleet.
"The shale industry is now capable of producing near-record volumes with a fraction of the rig count required during the 2014 drilling boom. This efficiency substitution effect is one of the most underappreciated dynamics in upstream oil analysis."
What the Rig Count Signals About the Oil Price Outlook
Is the Traditional Price-Rig Correlation Breaking Down?
Historically, a sustained period of oil prices above $80 per barrel was sufficient to trigger a meaningful acceleration in US drilling activity. The current environment, with Brent near $96 and oil rigs declining marginally, represents a structural departure from that pattern.
Key factors disrupting the traditional price-rig relationship include:
- Investor mandate shifts forcing public E&P companies to prioritise free cash flow generation over production volume growth
- Private operator capacity constraints that limit the historically price-responsive private drilling sector from filling the gap
- Efficiency substitution, where productivity gains per rig reduce the need for count expansion to achieve output targets
- Geopolitical price distortion, where conflict-driven supply premiums do not necessarily justify long-cycle capital commitments
The broader geopolitical context amplifies this caution. Hormuz tanker crossings have declined to their lowest levels since May as war risk spikes, Saudi Red Sea crude exports have fallen sharply from their March peak, and India has been actively seeking alternative crude sources as Middle Eastern supply routes become increasingly unreliable. This environment elevates near-term prices but creates precisely the kind of demand uncertainty that discourages producers from sanctioning aggressive multi-year drilling programmes.
Furthermore, the recent oil price rally driven by tariff concerns has added yet another unpredictable variable into operator planning frameworks. OPEC's market influence over global supply policy also continues to shape the context in which US producers make their drilling decisions.
Key Applications of Baker Hughes Rig Data Across the Energy Sector
The weekly US oil rig count and Baker Hughes rig data serve distinct analytical purposes across different market participants:
- Production forecasting: Treated as a 3 to 6 month leading indicator for US oil and gas output. Sustained multi-week declines can foreshadow output plateaus or modest production contractions.
- Futures market sentiment: Weekly releases frequently trigger short-term price reactions in WTI and Brent futures when actual data diverges meaningfully from consensus expectations.
- OPEC+ strategy calibration: Member nations monitor US rig counts as part of their broader assessment of non-OPEC supply growth when determining quota policy.
- Oilfield services demand projections: Drilling and completion services companies use rig count trends to project forward demand for equipment, personnel, and consumables across their operations.
FAQ: Baker Hughes Rig Count and US Oil Drilling Activity
What is the Baker Hughes rig count?
The Baker Hughes rig count is a weekly census of active drilling rigs operating across the United States and Canada, published every Friday at noon Central Time. It is the most widely referenced measure of upstream drilling activity in North America and has been published continuously since 1944.
How often is the Baker Hughes rig count updated?
It is updated weekly, with data released each Friday covering the reporting week that ended the prior Thursday.
What is the current US oil rig count?
As of the week ending July 17, 2026, there were 450 active oil rigs in the United States, a decline of 2 from the prior week but 35 above the same period in 2025.
What does a declining rig count mean for oil prices?
A sustained decline in active rigs can signal reduced future production growth. If demand remains stable or expands, this may provide price support over a 3 to 6 month horizon as the production lag works through the system.
What is the difference between a rig count and a frac spread count?
The Baker Hughes rig count measures active drilling units engaged in the drilling phase of well construction. The frac spread count tracks active hydraulic fracturing crews operating in the completion phase. Both are leading indicators for production but capture different stages of the well development process.
Why is the Permian Basin rig count particularly important?
The Permian Basin accounts for the largest share of US oil production and drilling activity. At 258 active rigs, it represents well over 40% of the total US oil rig count. Changes in Permian drilling activity exert an outsized influence on national output trajectories and global supply forecasts.
This article contains forward-looking statements and analytical projections based on available data as of July 2026. Energy market conditions, geopolitical developments, and production figures are subject to rapid change. Nothing in this article constitutes investment advice. Readers should conduct independent research and consult qualified financial advisers before making investment decisions.
Want to Stay Ahead of the Next Major Commodity Discovery?
While understanding rig counts and upstream oil dynamics provides critical market context, the real edge comes from acting on significant mineral discoveries the moment they are announced — Discovery Alert's proprietary Discovery IQ model scans ASX announcements in real time, delivering actionable alerts across more than 30 commodities so investors can position themselves well ahead of the broader market. Explore the historic returns major discoveries have generated and begin your 14-day free trial today.