
August 1, 2026
The Efficiency Revolution Quietly Reshaping U.S. Shale Economics
For most of the twentieth century, rising commodity prices operated as a near-automatic ignition switch for upstream capital spending. When oil climbed, rigs followed. When prices fell, rigs disappeared. That mechanical relationship between price and activity formed the backbone of global supply forecasting for decades, and it shaped how analysts, investors, and policymakers understood the rhythms of the oil market.
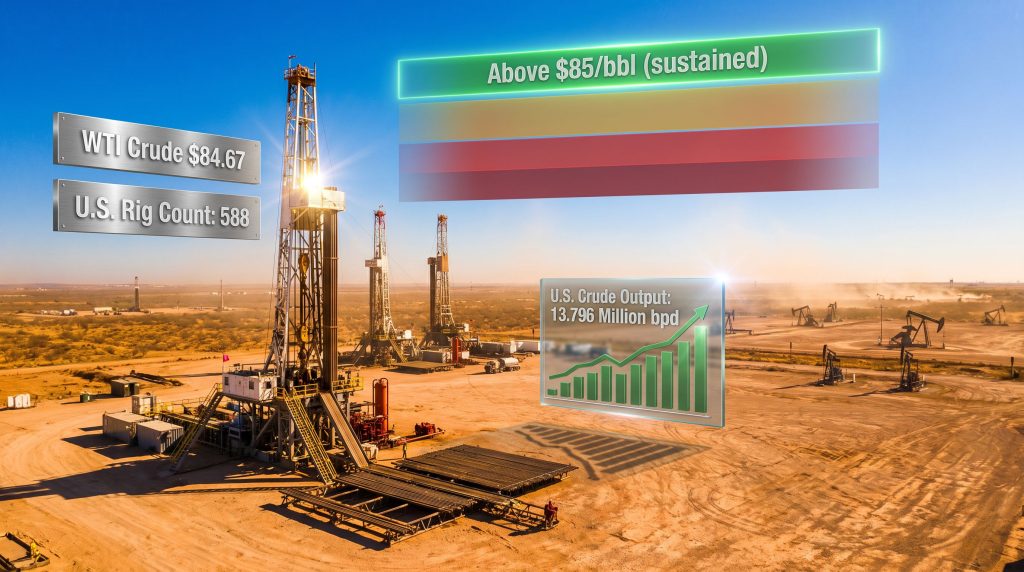
That relationship no longer holds in the same way. The U.S. shale sector has undergone a fundamental transformation in how it responds to price signals, and the current data from Baker Hughes and the U.S. Energy Information Administration offers a precise window into just how different the industry's decision-making architecture has become. With WTI crude trading near $84.67 per barrel and US oil drillers turning cautious as WTI holds near 85 per barrel, the data tells a more nuanced story than simple price charts suggest.
When big ASX news breaks, our subscribers know first
What the Baker Hughes Rig Count Actually Reveals This Week
The latest Baker Hughes weekly survey placed the total active U.S. rig count at 588, representing a gain of 48 rigs compared to the same point one year ago. On the surface, this looks like a meaningful expansion. However, the week-on-week story is far more subdued.
| Metric | Current Period | Year-Ago Level | Change (YoY) |
|---|---|---|---|
| Total U.S. Rig Count | 588 | 540 | +48 |
| Active Oil Rigs | 451 | 410 | +41 |
| Active Gas Rigs | 127 | 124 | +3 |
| Miscellaneous Rigs | 10 | 10 | 0 |
| Permian Basin Rigs | 260 | 259 | +1 |
| Eagle Ford Rigs | 49 | 39 | +10 |
The incremental picture is particularly instructive. Oil rigs rose by just one unit in the most recent reporting period. The Permian Basin, which commands roughly 44% of all active oil rigs and remains the most productive tight oil formation in the world, added two rigs but sits only one above year-ago levels. Furthermore, Eagle Ford's year-on-year recovery of 10 rigs is a more notable development, potentially reflecting improved condensate economics and infrastructure improvements in South Texas, though absolute activity there remains well below historical highs.
Consequently, the U.S. drilling activity decline observed more broadly across recent quarters is reflected in how cautiously operators are responding even as prices hover near key thresholds.
Frac Spread Data: What Completion Activity Is Signalling
Beyond drilling activity itself, well completion trends offer a sharper near-term lens on production intentions. Primary Vision's Frac Spread Count tracks the number of hydraulic fracturing crews actively completing wells at any given time, and this figure climbed by 2 in the week ending July 24 to reach 198 active crews. That followed a prior-week decline of 4 crews.
This choppy, oscillating pattern is significant. Frac spreads are a leading indicator of imminent production additions, since completing a drilled well is the final step before oil begins flowing. The fact that spread counts are neither declining sharply nor accelerating upward suggests producers are in a holding pattern, converting existing drilled wells into barrels at a measured, deliberate pace rather than pushing aggressively to capitalise on elevated prices.
A lesser-known dynamic here is the relationship between drilled-but-uncompleted wells, commonly referred to as the DUC inventory. DUC wells represent a kind of latent production capacity that operators can activate relatively quickly without drilling new wells. When frac crews are running at around 198 and not surging upward, it often signals that operators are deliberately managing their DUC drawdown rate, using the inventory as a buffer rather than a growth engine.
WTI Near $85: Why the Price Level Is Necessary but Not Sufficient
| Benchmark | Price (USD/bbl) | Day-on-Day Change |
|---|---|---|
| WTI Crude | $84.67 | +1.29% |
| Brent Crude | $89.99 | +1.03% |
| WTI Midland | $85.46 | +1.33% |
Prices were broadly higher on the day, but context matters enormously here. WTI had declined by approximately $6 per barrel from levels recorded just one week prior. That kind of intraday strength paired with sharp weekly decline is precisely the volatility profile that reinforces producer caution rather than inspiring capital commitment. In addition, understanding the broader crude oil price trends helps contextualise why operators remain hesitant despite nominally supportive headline numbers.
Industry survey data, including research compiled by the Federal Reserve Bank of Dallas, points to a tiered threshold framework that helps explain operator behaviour at various price levels:
- Below $65/bbl – Balance sheet protection mode; rig count contracts as operators preserve cash flow
- $65 to $75/bbl – Maintenance-level drilling; programmes hold steady without meaningful expansion
- $75 to $85/bbl – Selective and cautious expansion; capital discipline remains the governing principle
- Above $85/bbl, sustained – The threshold at which broader drilling acceleration becomes economically justifiable and strategically rational
The critical qualifier embedded in that final category is the word sustained. A brief intraday touch of $85 WTI carries no operational weight for a producer managing a multi-month capital programme. What operators need to see is multiple consecutive quarters of pricing at or above that level before they can credibly revise budgets, contract additional rigs, and greenlight new well programmes.
Key threshold: Survey data suggests most U.S. shale operators can drill profitably at roughly $65 per barrel WTI, but a material acceleration in drilling activity historically requires pricing consistently above $85 per barrel for an extended period, not just a weekly average.
The Structural Reasons U.S. Producers Are Not Chasing the Price
The Post-2020 Capital Discipline Mandate
Understanding why US oil drillers turn cautious as WTI holds near 85 per barrel requires understanding the institutional transformation that swept through the U.S. upstream sector following the 2020 price collapse. What emerged from that period was a fundamentally new operating philosophy, one that replaced volume maximisation with a returns-first framework.
The pillars of this new model include:
- Shareholder return prioritisation – Dividends and buybacks take precedence over reinvestment into production growth
- Free cash flow as the governing metric – Operators are judged on cash generation, not reserve replacement speed
- Strict budget adherence – Mid-year spending increases are culturally and institutionally difficult, regardless of spot price moves
- Debt reduction as a precondition – Many operators view leverage reduction as a prerequisite before any growth capital is deployed
This shift was not spontaneous. It was demanded by institutional equity investors who spent the 2010s watching shale operators spend heavily, grow production aggressively, and still generate negative free cash flow. The post-2020 capital discipline era is, in many respects, a market-imposed correction for the industry's earlier growth-at-all-costs posture. For instance, peak shale dynamics explored by industry analysts further illustrate how structural constraints now govern operator behaviour more than spot prices alone.
The Budget Cycle Constraint That Few Discuss
One underappreciated structural factor is the mechanics of annual capital budgeting in the upstream sector. U.S. oil and gas companies typically finalise their capital expenditure plans in the final quarter of the preceding year. These budgets are then communicated to investors, embedded into operational plans, and used to secure service company contracts.
A mid-year price increase, even a substantial one, does not automatically unlock additional spending authority. Revising a capital budget mid-cycle requires executive approval, board sign-off, and often investor communication. Unless price strength persists across multiple quarters, the institutional inertia of the existing budget framework acts as a genuine brake on drilling expansion. Operators in the Permian Basin and North Dakota have been widely observed maintaining their pre-set 2024 programmes despite the recent improvement in WTI pricing.
Time-to-Production: The Hidden Lag Operators Cannot Ignore
Even if an operator decides today to deploy additional rigs in response to $85 WTI, the path from that decision to flowing barrels involves a series of time-consuming steps:
- Contracting a drilling rig typically involves a lead time of weeks depending on market availability
- Spudding and drilling a horizontal well in a tight oil formation takes additional weeks to months
- Moving a frac crew to the location and completing the well adds further time
- From spud to first production in major shale plays, the total elapsed time commonly ranges from three to six months
By the time new barrels enter the market, the price environment may have shifted materially. This lag creates a rational basis for caution: committing capital at $85 WTI today means betting that prices will remain supportive when those barrels actually arrive, which may be deep into a different market quarter.
U.S. Production Near Record Highs Despite Measured Drilling
| Production Metric | Current Week | Prior Week | Year-Ago Level |
|---|---|---|---|
| U.S. Crude Output (bpd) | 13.796 million | 13.798 million | ~13.314 million |
| Week-on-Week Change | -2,000 bpd | – | – |
| Year-on-Year Gain | +482,000 bpd | – | – |
EIA data shows U.S. crude oil production averaging 13.796 million barrels per day in the week ending July 24, essentially flat week-on-week, and up a substantial 482,000 bpd year-on-year. That year-on-year production gain is a product of prior drilling campaigns, not current rig additions, illustrating how the lagged production model works in practice. Meanwhile, U.S. oil production trends continue to be shaped more by efficiency gains than by headline rig count movements.
Production insight: The U.S. is sustaining near-record output with a rig count that remains well below the peaks of previous cycles. This is the efficiency dividend from technological improvements including extended lateral drilling, advanced completion designs, and multi-well pad operations, all of which have structurally reduced the number of rigs needed to maintain or grow production.
The extended lateral trend is particularly notable from a technical standpoint. Wells in the Permian Basin are now routinely drilled with horizontal sections exceeding 10,000 feet, and some operators are pushing beyond 15,000 feet in certain formations. Longer laterals mean more reservoir contact per well, higher initial production rates, and better economics per rig deployed. This is one reason why today's 588-rig environment can support production near 13.8 million bpd, a level that would have required significantly more rigs under the completion practices of a decade ago.
Regional Basin Performance: Not All Activity Is Equal
Permian Basin Dominance and Its Implications
The Permian Basin's position as the gravitational centre of U.S. oil production reflects its geological advantages: stacked pay zones across multiple formations including the Wolfcamp, Bone Spring, and Spraberry, combined with relatively shallow depths and well-understood reservoir characteristics that enable highly predictable well performance. Its breakeven costs are generally lower than other major U.S. plays, making it the most resilient basin in a volatile price environment.
The Permian's flat year-on-year rig count, at just one unit above prior-year levels, reflects the efficiency dynamic more than any lack of confidence. Operators there are simply extracting more value from each rig than they could previously.
Gas-Directed Drilling: A Separate Problem Entirely
The gas rig count of 127, up just three year-on-year, reflects a distinct set of challenges. Natural gas prices have remained persistently weak through much of 2024, driven by a combination of oversupply and demand uncertainty. Gas-directed basins including the Haynesville in Louisiana and Texas, and the Marcellus in Appalachia, face a profoundly different economics equation than oil-weighted plays. Until Henry Hub pricing recovers to levels that justify new well economics, gas rig activity is likely to remain constrained.
The next major ASX story will hit our subscribers first
Three Scenarios That Could Shift the Current Equilibrium
Scenario 1: WTI Sustains Above $85 for a Full Quarter (Bull Case)
If prices hold above the $85 threshold for a complete quarter, formal budget revision conversations at major E&P companies become politically and institutionally viable. DUC inventories in the Permian would likely be the first resource unlocked, with frac spread counts rising ahead of new rig deployments. A meaningful rig count acceleration could emerge within 60 to 90 days of confirmed price stability. Furthermore, a sustained oil price rally of this nature would likely trigger the first broad-based drilling expansion since the post-2020 reset.
Scenario 2: Price Volatility Continues Around Current Levels (Base Case)
Operators maintain existing programmes with rig counts growing at a measured one to three units per week. Frac spread counts oscillate narrowly around the 195 to 205 crew range. Production holds near 13.8 million bpd with gradual efficiency-driven incremental gains. This is the most probable near-term outcome given current market conditions.
Scenario 3: WTI Retreats Below $75 (Bear Case)
Budget reviews trigger activity reductions in higher-cost basins first. Gas-directed rigs face disproportionate pressure. Permian activity proves most resilient given structural cost advantages. Eagle Ford and Bakken activity softens as economics thin at lower price realisations.
The External Forces Complicating Producer Confidence
Beyond the internal capital discipline framework, several external forces are amplifying operator caution:
- OPEC+ policy uncertainty continues to create ambiguity about the effective price floor. Producers are aware that coordinated OPEC+ supply increases could compress WTI differentials within a relatively short timeframe
- Geopolitical risk premiums embedded in current prices are widely viewed by operators as temporary. Supply disruptions related to Middle East shipping routes and regional conflict have added short-term price support that may not reflect durable fundamental demand strength
- Chinese demand signals remain mixed, limiting conviction that current global consumption levels will continue to underpin prices through the balance of the year
- Equity investor mandates create a structural ceiling on management discretion. Publicly listed E&P companies face ongoing pressure to sustain dividend commitments and buyback programmes, with markets in the post-2020 environment consistently penalising companies that redirect capital windfalls into production growth rather than shareholder returns
In addition, the trade war impact on oil markets has introduced a further layer of uncertainty, with shifting tariff regimes adding unpredictability to the global demand outlook that operators must factor into any capital allocation decisions.
Frequently Asked Questions
What does the Baker Hughes rig count measure?
The Baker Hughes rig count is a weekly census of active drilling rigs operating across the United States. It is widely considered the most authoritative near-term indicator of upstream capital deployment and future production trajectory. A rising count signals growing operator confidence; a falling count indicates retrenchment.
Why is $85 WTI considered a threshold for drilling acceleration?
Data from Dallas Federal Reserve surveys of E&P executives indicates that while most U.S. shale operators can drill profitably at around $65 per barrel, the economic justification for material programme expansion, beyond simply maintaining existing output, typically requires pricing consistently at or above $85 per barrel over a sustained period.
What is a DUC well and why does it matter?
A drilled-but-uncompleted well has been drilled to its target depth but has not yet been hydraulically fractured and connected to production infrastructure. DUC inventories represent a form of latent supply capacity that can be activated more quickly than drilling new wells. The rate at which operators draw down DUC inventories provides insight into their production intentions independent of rig count signals.
How is U.S. production near record highs with a relatively modest rig count?
Efficiency improvements across the shale sector, particularly longer horizontal laterals, improved completion designs, and multi-well pad drilling, have dramatically increased the productive output per rig compared to previous cycles. This efficiency dividend means fewer rigs can sustain or grow production at levels that would previously have required far greater capital intensity. WTI price dynamics in recent months have further tested whether this efficiency model can hold as US oil drillers turn cautious as WTI holds near 85 per barrel and operators reassess their forward-looking programmes.
Disclaimer: This article is intended for informational and educational purposes only and does not constitute financial, investment, or trading advice. Forecasts, scenario projections, and market analyses contained herein are speculative in nature and subject to change based on market conditions. Readers should conduct their own independent research before making any investment decisions.
Want to Identify the Next Major Mineral Discovery Before the Broader Market Does?
While shale economics and crude price thresholds dominate headlines, significant mineral discoveries on the ASX can generate transformative returns entirely independent of oil market cycles — and Discovery Alert's proprietary Discovery IQ model delivers real-time alerts the moment those discoveries are announced, turning complex geological data into actionable opportunities for investors at every experience level. Explore historic examples of exceptional discovery-driven returns and begin your 14-day free trial today to position yourself ahead of the market.