
June 25, 2026
The Structural Forces Behind America's Nuclear Fuel Awakening
Long before uranium prices became a topic of mainstream financial conversation, the architecture of global nuclear fuel supply was quietly fracturing. For decades, the United States built its civilian nuclear programme on the assumption that imported uranium would remain accessible, affordable, and politically uncomplicated. That assumption has been systematically dismantled, and the 2025 production data published by the US Energy Information Administration (EIA) offers the clearest numerical evidence yet that US uranium production up again is becoming a measurable industrial reality.
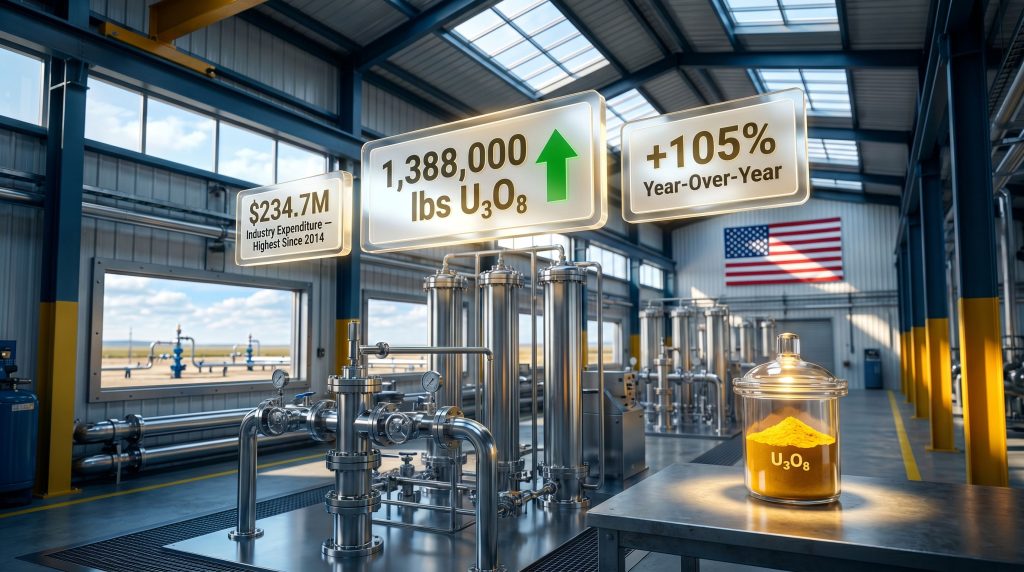
The numbers themselves are striking: 1,388,000 pounds of uranium oxide (U₃O₈) extracted from domestic sources in 2025, more than double the 677,000 pounds recorded in 2024, and the highest annual output since 2016. However, raw volume figures only tell part of the story. To understand why this recovery matters, and where it still falls critically short, it is worth tracing the arc from collapse to cautious resurgence.
When big ASX news breaks, our subscribers know first
From Fukushima to Near-Zero: The Long Road Down
How a Single Event Hollowed Out an Entire Industry
The 2011 Fukushima Daiichi disaster triggered one of the most severe demand contractions in uranium market history. Japan, which had operated dozens of reactors as a cornerstone of its energy mix, took its entire nuclear fleet offline in the aftermath. The ripple effect was global: uranium spot prices collapsed, long-term contracting stalled, and producers across the world were forced to make hard decisions about operating economics.
For US uranium miners, the timing was particularly brutal. Domestic production had already been losing ground to lower-cost offshore suppliers, and the post-Fukushima price crash removed any remaining margin of viability. One by one, US operations were idled, placed on standby, or abandoned entirely.
The Statistical Suppression That Defined the Trough
By 2020, the situation had deteriorated to a historically unusual point. US uranium output had fallen so sharply that the EIA took the rare step of withholding production figures entirely, citing the risk of inadvertently disclosing individual company data given the tiny number of active producers. According to World Nuclear Association data, total US production in 2020 was approximately 6 metric tonnes of uranium (tU) — a figure so low it barely registers on a chart scaled to national demand.
The last year domestic production crossed the one-million-pound threshold before the recent recovery was 2017. What followed was effectively a half-decade of industrial dormancy, leaving US reactor operators overwhelmingly reliant on imports from Kazakhstan, Canada, Russia, and Uzbekistan. Furthermore, the uranium supply challenges created during this period continue to reverberate throughout the fuel chain today.
What the 2025 EIA Data Actually Reveals
Breaking Down the Recovery Metrics
The EIA's Domestic Uranium Production Report, released in June 2025, captures a sector in the early stages of genuine industrial reactivation rather than a simple price-driven blip. According to EIA annual production data, the figures confirm a multi-year high across several key metrics simultaneously.
| Metric | 2024 | 2025 | Change |
|---|---|---|---|
| Total US Production (lbs U₃O₈) | 677,000 | 1,388,000 | +105% |
| Full-Time Employment (person-years) | 506 | 711 | +41% |
| Total Industry Expenditure | Undisclosed | USD $234.7M | Highest since 2014 |
| Exploration Drilling Activity | Baseline | Highest since 2013 | Multi-year peak |
Employment reaching 711 full-time person-years marks the highest workforce total since 2014. Total industry expenditure of $234.7 million across land acquisition, exploration, drilling, production, and reclamation similarly represents the highest annual spend in over a decade. Exploration and development drilling activity achieved its highest level since 2013 by both number of holes drilled and total footage, a leading indicator that future resource definition is accelerating.
The combination of rising employment, record capital deployment, and peak drilling activity occurring simultaneously suggests this recovery has more structural underpinning than previous short-lived rebounds driven purely by spot price movements.
The Context the Headline Number Needs
While 1,388,000 pounds U₃O₈ is an impressive year-over-year gain, context is essential. The 2016 production figure of 2,545,000 pounds still stands well above 2025 levels. More critically, total estimated US annual reactor demand sits in the range of 40 to 50 million pounds U₃O₈, meaning domestic production currently covers somewhere between 2% and 4% of national consumption. Consequently, import dependency remains the defining reality of the US nuclear fuel chain despite the headline improvement, and understanding the broader uranium market dynamics is essential for placing these figures in proper context.
The Technology Doing the Heavy Lifting: In-Situ Recovery Explained
Why ISR Dominates US Uranium Mining
Understanding the recovery requires understanding the extraction method enabling it. In-situ recovery (ISR), also referred to as in-situ leach (ISL), is a technique that dissolves uranium directly within the underground ore body rather than physically excavating rock. A network of injection wells introduces a specially formulated leaching solution into the ore horizon, mobilising uranium in place. The uranium-bearing solution is then pumped to the surface through extraction wells and processed at a central facility to produce dried uranium concentrate (yellowcake).
ISR carries a significantly lower capital cost and environmental surface disturbance footprint compared to conventional open-cut or underground mining. It does not require ore haulage, crushing, or traditional milling, which makes it far more economical to operate at scale in the sandstone-hosted uranium deposits that characterise Wyoming and Texas. The in-situ leaching benefits are particularly relevant in these geological settings, which feature permeable, relatively shallow, roll-front uranium deposits in sedimentary aquifer systems naturally suited to ISR.
The Five Operating ISR Projects Powering 2025 Output
At the close of 2025, five ISR facilities were active, all concentrated in the uranium-rich geological provinces of Wyoming and Texas:
- Alta Mesa (Texas)
- Lost Creek (Wyoming)
- Smith Ranch-Highland Operation (Wyoming)
- Ross Central Processing (Wyoming)
- Willow Creek (Wyoming)
These five operations collectively hold a combined annual production capacity of 13.3 million pounds U₃O₈, modestly below the industry-wide ISR capacity of 14.1 million pounds recorded in 2024. The decline in headline capacity reflects operational reconfiguration rather than contraction in intent.
The Wider Capacity Picture
Beyond active operations, the latent supply potential within the US ISR sector is substantial. In addition, US uranium ISR production figures demonstrate that the gap between permitted capacity and actual throughput remains one of the sector's most defining characteristics.
| Capacity Category | Annual Capacity |
|---|---|
| Active ISR operations (2025) | 13.3 million lbs U₃O₈ |
| ISR plants on standby | 8.8 million lbs U₃O₈ |
| ISR plants in planning phase | 10.5 million lbs U₃O₈ |
| Total potential ISR capacity | ~32.6 million lbs U₃O₈ |
| Actual 2025 production | 1.388 million lbs U₃O₈ |
| Estimated annual US demand | ~40-50 million lbs U₃O₈ |
Seven new ISR plants across South Dakota, Texas, and Wyoming are in various planning stages, representing a 10.5 million pound per year addition to the pipeline. On the conventional milling side, only one facility remains operational: Energy Fuels' White Mesa Mill in Utah, which provides the sole domestic conventional processing pathway. Two additional conventional mills sit on standby, while the Sheep Mountain heap leach facility in Wyoming has achieved partial permitting and licensing status.
The Policy Architecture Accelerating Domestic Supply
Bipartisan Consensus on Nuclear Fuel Security
One of the more notable features of the current uranium production environment is the degree of policy alignment across administrations. Since 2022, successive US governments have treated domestic nuclear fuel supply chain integrity as a strategic priority, resulting in a layered set of legislative and executive actions that collectively tilt the economics in favour of domestic producers.
Key policy interventions shaping the landscape include:
- The Russian uranium import ban, enacted through federal legislation, which severed a significant import channel and created structural procurement urgency for US reactor operators.
- Federal funding commitments totalling approximately $2.7 billion directed toward enrichment and conversion infrastructure, addressing upstream bottlenecks beyond the mining stage.
- A strategic uranium stockpile request of approximately $1.5 billion, aimed at creating a domestic reserve buffer analogous to the Strategic Petroleum Reserve model.
- Executive orders prioritising domestic critical mineral and nuclear fuel supply chains.
These policy measures do not directly fund individual mining projects, but they create a demand signal and price floor expectation that materially changes the investment calculus for producers weighing the cost of reactivating standby capacity.
The AI-Driven Electricity Demand Wildcard
An emerging demand driver that was largely absent from uranium market analysis even three years ago is the accelerating electricity consumption of data centres and artificial intelligence infrastructure. Major technology companies have been entering long-term power purchase agreements with nuclear operators, directly incentivising reactor licence extensions and new reactor construction.
Each gigawatt of sustained nuclear capacity requires a steady, multi-decade supply of enriched uranium fuel, and that demand flows back to uranium miners. This technology-driven demand layer adds a structural dimension to uranium consumption forecasts that traditional nuclear fleet modelling did not capture. According to EIA energy analysis, data centre electricity demand is projected to grow substantially through the end of the decade, reinforcing the long-term demand case for domestic uranium supply.
The Stubborn Gap Between Capacity and Reality
Why Permitted Capacity Does Not Equal Production
One of the most important and least appreciated dynamics in the US uranium sector is the distinction between licensed capacity and operational throughput. The five active ISR operations alone hold permitted capacity of 13.3 million pounds annually, yet actual 2025 production was barely 10% of that figure. Several factors explain this divergence:
- Well field development lead times: ISR operations require substantial underground well field drilling and pattern establishment before meaningful production flows. This process can take one to three years per new well field sector.
- Workforce depth constraints: Skilled uranium hydrogeologists, solution mining engineers, and wellfield technicians represent a thin labour pool that does not scale rapidly.
- Processing plant throughput optimisation: Central processing facilities require consistent solution chemistry management, and ramp-up to nameplate capacity is rarely instantaneous.
- Regulatory reporting and compliance cycles: Environmental monitoring requirements at ISR operations impose operational pacing constraints.
The Five-to-Ten-Year Ramp Reality
For investors and policymakers expecting rapid supply response, the ISR sector's genuine ramp timeline is a critical variable. Even under favourable price and regulatory conditions, moving a planned ISR project from permitting approval through well field development to meaningful production typically spans five to ten years. Standby operations can reactivate more quickly, potentially within one to two years of a restart decision, but their combined capacity of 8.8 million pounds still falls far short of closing the demand gap independently.
The next major ASX story will hit our subscribers first
Structural Barriers the Data Doesn't Fully Capture
The Permitting Bottleneck
Capital availability is no longer the binding constraint for US uranium development in the current environment. The more durable impediment is regulatory lead time. Obtaining the full suite of federal and state permits required for a new ISR operation — including Nuclear Regulatory Commission source material licences, EPA underground injection control permits, and state-level environmental approvals — routinely takes five to seven years from initial application. This timeline cannot be compressed simply by increasing expenditure.
Mill Infrastructure Scarcity as a Hidden Constraint
The reliance on a single operating conventional mill at White Mesa creates a concentration risk that receives insufficient attention in mainstream coverage. Conventional uranium ore from underground or open-cut sources cannot be processed through ISR facilities. Any expansion of conventional mining activity competes for a single processing bottleneck. Reactivating the two standby mills would require substantial capital, regulatory reapproval, and workforce recruitment, adding further lead time to any conventional mining recovery.
Scenario Pathways Through 2030
Three Trajectories for US Output
| Scenario | Key Assumptions | Projected Output by 2028-2030 |
|---|---|---|
| Incremental Growth | Current policy maintained, standby ISR reactivations proceed | 3-4 million lbs U₃O₈/year |
| Accelerated Buildout | Planned ISR plants fully permitted and constructed, mill reactivations proceed | 10+ million lbs U₃O₈/year |
| Policy Reversal or Price Collapse | Uranium spot prices fall below operating thresholds, standby plants return to dormancy | Below 1 million lbs U₃O₈/year |
Disclaimer: Scenario projections involve significant uncertainty and should not be interpreted as forecasts. Uranium markets are subject to geopolitical, regulatory, and macroeconomic variables that cannot be reliably predicted. This analysis is informational in nature and does not constitute investment advice.
Even under the most optimistic buildout scenario, total domestic production is unlikely to satisfy US reactor demand before 2030 without parallel investment in enrichment and conversion capacity. The nuclear fuel chain has multiple interdependent links, and production at the mining stage is a necessary but insufficient condition for fuel self-sufficiency.
Frequently Asked Questions: US Uranium Production Recovery
Why Did US Uranium Production Nearly Disappear After 2017?
The post-Fukushima uranium price collapse, combined with abundant and cheaper offshore supply from Kazakhstan and Canada, made US domestic production economically unviable for most operators. Without long-term contracts at sufficiently high prices, producers could not justify ongoing expenditures and progressively idled their operations through the late 2010s.
What Is In-Situ Recovery and Why Does It Dominate US Uranium Mining?
ISR is a technique that dissolves uranium underground using injected solution and recovers it through extraction wells, bypassing the need for conventional excavation. It suits the sandstone roll-front deposit geology prevalent in Wyoming and Texas, offering lower capital costs and reduced surface disturbance relative to conventional methods.
How Much Uranium Does the US Produce Compared to What It Needs?
At 2025 production levels, domestic output covers roughly 3% to 4% of total US reactor fuel requirements. Import dependency exceeds 90%, with uranium sourced primarily from Kazakhstan, Canada, Australia, and other international suppliers.
Which States Are the Primary Hubs of US Uranium Mining Activity?
Wyoming is the dominant centre of US uranium production, hosting four of the five active ISR operations as well as several standby and planned facilities. Texas hosts the Alta Mesa ISR operation, while Utah hosts the White Mesa conventional mill. Planned ISR expansion also targets South Dakota.
Could US Uranium Output Realistically Replace Imports Within a Decade?
Full import replacement within ten years is unlikely under any plausible scenario. Even deploying the entire pipeline of standby and planned ISR capacity would yield a theoretical maximum well below total annual demand. However, reducing import dependency to below 50% would represent a significant achievement, requiring sustained capital investment, regulatory streamlining, and workforce development over the full decade.
Key Takeaways: Reading the 2025 Numbers Accurately
The signal embedded in the 2025 EIA data is real, but it demands careful interpretation. US uranium production up again is a headline worth noting, yet the gap between production momentum and supply adequacy remains enormous.
- US uranium output in 2025 surpassed 1.38 million pounds U₃O₈, more than doubling 2024 volumes and reaching a nine-year high.
- Employment at 711 person-years and industry expenditure at $234.7 million both reached their highest levels since 2014, signalling genuine industrial rebuilding.
- Exploration drilling intensity hit its highest point since 2013, a leading indicator of future resource conversion and supply growth.
- Combined standby and planned ISR capacity exceeds 19 million pounds per year, representing significant latent potential if regulatory and capital conditions remain supportive.
- Actual production remains a small fraction of the 40 to 50 million pound annual demand of US reactors, with import dependency still the defining feature of the fuel chain.
- Structural constraints including permitting lead times, conventional mill scarcity, and workforce depth are the binding variables that capital spending alone cannot resolve.
The recovery underway is meaningful. Whether it becomes transformative depends on decisions being made now in boardrooms, regulatory agencies, and legislative chambers — the outcomes of which will not be visible in production statistics for years to come.
Want to Stay Ahead of Significant Mineral Discoveries Before the Broader Market?
Discovery Alert's proprietary Discovery IQ model delivers real-time alerts on significant ASX mineral discoveries across uranium and over 30 other commodities, translating complex data into clear, actionable investment insights — explore the historic returns major discoveries have generated and begin your 14-day free trial today to position yourself ahead of the market.