
June 15, 2026
USA crude oil stocks experienced significant declines in early January 2026, reflecting complex market dynamics that highlight the intricate balance between commercial inventories, refinery operations, and broader energy security considerations. The usa crude oil stocks drop observed during this period demonstrates how multiple converging factors can create substantial inventory movements that influence both short-term pricing and long-term strategic positioning.
Understanding the Strategic Petroleum Reserve vs. Commercial Stock Dynamics
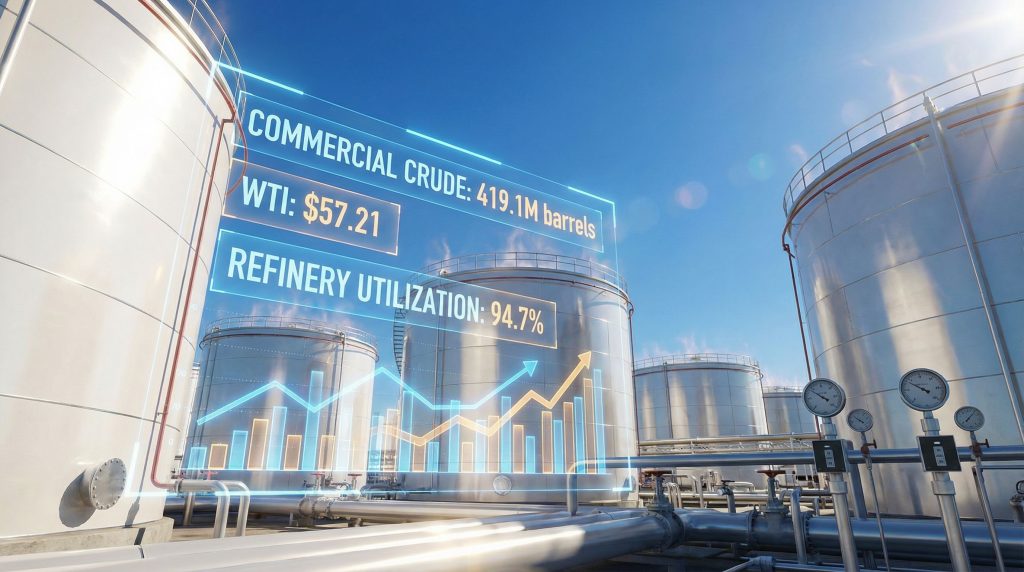
The fundamental distinction between commercial crude oil stocks and Strategic Petroleum Reserve holdings reflects different operational purposes within the broader energy infrastructure ecosystem. Commercial inventories totalled 419.1 million barrels as of January 2, 2026, representing working stocks managed by private companies for operational flexibility, trading opportunities, and supply chain optimisation.
Meanwhile, the Strategic Petroleum Reserve maintained 413.5 million barrels during the same period, showing a modest weekly increase of 0.3 million barrels and a substantial year-over-year growth of 19.7 million barrels from the 393.8 million barrels recorded in January 2025. This recovery reflects ongoing government efforts to rebuild emergency stockpiles following historical drawdowns implemented during previous supply disruption periods.
How Commercial Inventories Differ from Government Reserves
Commercial crude oil storage serves immediate market functions, responding dynamically to refinery demand patterns, import timing variations, and trading strategies employed by energy companies. These inventories fluctuate based on operational requirements, with companies maintaining sufficient stocks to ensure continuous refinery operations whilst optimising storage costs and transportation logistics.
The Strategic Petroleum Reserve operates under entirely different parameters, designed specifically for national energy security rather than commercial profit optimisation. Furthermore, these underground salt dome formations along the Texas and Louisiana Gulf Coast provide emergency supply capability during major supply disruptions.
Key operational differences include:
• Response mechanisms: Commercial stocks adjust continuously based on market signals, whilst SPR releases require presidential authorisation
• Capacity utilisation: Commercial facilities operate at varying levels based on economic optimisation, whilst SPR maintains maximum feasible storage levels
• Geographic distribution: Commercial storage spans numerous locations nationwide, whilst SPR concentrates in four major Gulf Coast sites
• Access speed: Commercial stocks provide immediate availability, whilst SPR releases require several weeks for full market impact
Weekly Reporting Cycles and Market Expectations
The U.S. Energy Information Administration's Wednesday morning data releases have evolved into critical market-moving events that influence global energy trading patterns. Released at 10:30 AM Eastern Time, these reports provide comprehensive inventory data for the week ending the previous Friday, creating a standardised information flow that enables systematic market analysis.
This reporting schedule interacts with American Petroleum Institute preliminary data released Tuesday evenings, creating a two-tier information structure. Whilst API data derives from voluntary industry reporting with different methodology than the mandatory government survey, traders often position based on these preliminary numbers.
The January 2026 inventory decline of 3.8 million barrels exceeded analyst forecasts, with market research teams having predicted a draw of approximately 3.5 million barrels. Consequently, this 300,000 barrel differential between expectation and reality demonstrates how relatively small variations from consensus can trigger significant oil price movements in energy markets.
When big ASX news breaks, our subscribers know first
What Factors Contributed to January 2026's Inventory Decline?
Multiple converging factors contributed to the substantial usa crude oil stocks drop observed during the first week of January 2026, reflecting both seasonal patterns and specific operational circumstances that intensified normal inventory dynamics.
Refinery Utilisation Rates and Processing Demand
U.S. refineries operated at 94.7 percent of operable capacity during the week ending January 2, 2026, representing exceptionally high utilisation rates for this typically slower period. Crude oil inputs averaged 16.9 million barrels per day, marking an increase of 62,000 barrels per day from the previous week's processing levels.
This elevated processing activity occurred during a period when refineries typically reduce throughput for maintenance activities, suggesting either delayed maintenance schedules or exceptionally attractive processing economics. The high utilisation rates created substantial demand for commercial crude stocks, directly contributing to inventory drawdowns.
Processing metrics for the period included:
• Daily crude inputs: 16.9 million barrels
• Capacity utilisation: 94.7 percent
• Gasoline production: 9.0 million barrels per day
• Distillate production: 5.3 million barrels per day (up 81,000 barrels daily)
Import Flow Disruptions and Supply Chain Adjustments
Crude oil imports averaged 6.3 million barrels per day during the week, representing a significant increase of 1.4 million barrels per day from the previous week. However, this weekly surge occurred against a backdrop of reduced import levels over longer time periods.
According to recent market analysis, four-week average imports declined 9.7 percent year-over-year. Market analysts specifically noted unusually low import volumes from Canada, which typically represents the largest single source of U.S. crude imports.
Transportation infrastructure limitations can create regional supply imbalances even when aggregate national crude supply appears adequate. Furthermore, pipeline systems connecting Canadian production to U.S. Gulf Coast and Midwest refineries operate near maximum capacity during strong production periods.
Downstream Product Inventory Build-Up Patterns
The simultaneous occurrence of crude inventory declines alongside significant petroleum product inventory increases provides clear evidence of intensive refinery processing activity. Motor gasoline inventories increased by 7.7 million barrels during the week, whilst distillate fuel inventories grew by 5.6 million barrels.
This inventory pattern reflects strategic positioning by refiners ahead of anticipated seasonal demand periods. For instance, gasoline stock builds typically occur in late winter as refineries prepare for summer driving season when consumption peaks.
Product inventory movements included:
• Gasoline build: 7.7 million barrels
• Distillate build: 5.6 million barrels
• Propane/propylene draw: 2.2 million barrels
• Crude oil draw: 3.8 million barrels
How Do Current Stock Levels Compare to Historical Benchmarks?
Evaluating current inventory levels against historical benchmarks requires sophisticated analysis frameworks that account for seasonal variations, structural market changes, and evolving supply-demand dynamics.
| Product Category | Current Level (Million Barrels) | Five-Year Average Comparison | Seasonal Context |
|---|---|---|---|
| Commercial Crude | 419.1 | 3% below average | Winter processing period |
| Motor Gasoline | 242.0 | 3% above average | Pre-driving season build |
| Distillate Fuel | 129.3 | 3% below average | Heating season demand |
| Propane/Propylene | Variable | 29% above average | Storage cycle peak |
Five-Year Average Analysis Framework
The five-year average comparison methodology provides essential context by incorporating recent market structure changes whilst smoothing short-term volatility. Commercial crude oil inventories at 419.1 million barrels stand approximately 3 percent below the five-year average for this time period.
This positioning suggests inventory levels remain within normal operating ranges whilst providing limited cushion for unexpected supply disruptions. However, the positioning creates vulnerabilities that OPEC production impact decisions could potentially exploit through coordinated supply management strategies.
The propane/propylene inventory position represents the most significant deviation from historical norms, standing 29 percent above five-year averages. This substantial surplus reflects various factors including increased domestic production from natural gas processing and reduced export opportunities.
Year-Over-Year Inventory Growth Patterns
Total petroleum stocks reached 1.707 billion barrels on January 2, 2026, representing increases of 8.4 million barrels week-over-week and 78.7 million barrels year-over-year. In addition, this substantial annual inventory growth demonstrates significant supply accumulation across multiple product categories during 2025.
The Strategic Petroleum Reserve contributed meaningfully to year-over-year growth, adding 19.7 million barrels compared to January 2025 levels. Commercial crude inventories showed more modest year-over-year growth of 4.5 million barrels, from 414.6 million barrels to 419.1 million barrels.
Annual inventory changes by category:
• Total petroleum stocks: +78.7 million barrels
• Commercial crude: +4.5 million barrels
• Strategic Petroleum Reserve: +19.7 million barrels
• Combined inventory growth: Reflects supply buildup and demand moderation
What Do Refinery Operations Reveal About Market Fundamentals?
Refinery operational metrics provide crucial insights into underlying market fundamentals, revealing demand expectations, processing economics, and supply chain optimisation strategies that influence inventory dynamics across the petroleum complex.
Processing Input Metrics and Capacity Optimisation
The 16.9 million barrels per day crude oil input rate observed during the week ending January 2, 2026 approached historical maximum processing levels. This processing intensity created substantial demand for crude oil from commercial storage facilities, contributing significantly to the usa crude oil stocks drop.
Refinery utilisation rates exceeding 90 percent typically indicate tight processing capacity with limited spare capability. The observed 94.7 percent utilisation rate suggests refiners were operating near maximum sustainable levels, potentially indicating either delayed maintenance activities or exceptionally attractive crack spreads.
Refinery performance indicators:
• Crude oil inputs: 16.9 million barrels per day
• Capacity utilisation: 94.7 percent of operable capacity
• Week-over-week increase: 62,000 barrels per day
• Processing intensity: Near historical maximum levels
Product Yield Distribution and Market Demand Signals
The distribution of refinery outputs provides important signals about anticipated demand patterns and market positioning strategies. Gasoline production averaged 9.0 million barrels per day despite showing a weekly decrease, whilst distillate fuel production increased by 81,000 barrels per day.
This product mix reflects typical seasonal adjustments as refiners optimise yields for expected demand patterns. The increased distillate production supports both heating oil requirements during winter months and builds inventory ahead of spring agricultural activities.
Crack spread economics significantly influence these production decisions, with refiners adjusting processing intensity based on relative pricing between crude oil input costs and refined product output values. When crack spreads widen due to strong product prices relative to crude costs, refiners maximise throughput to capture enhanced margins.
How Do Import Patterns Affect Domestic Inventory Management?
Import flow patterns create complex interactions with domestic inventory levels, influenced by international supply availability, transportation logistics, pricing differentials, and strategic sourcing decisions that affect regional supply balances.
Weekly Import Volume Fluctuations
The 6.3 million barrels per day import rate during the week ending January 2, 2026 represented a substantial 1.4 million barrels per day increase from the previous week. However, this weekly surge occurred against a backdrop of structural changes in U.S. crude supply patterns.
The four-week average import level of approximately 6.0 million barrels per day showed a 9.7 percent decline compared to the same period in the previous year. This reduction suggests increased reliance on domestic production or strategic inventory drawdowns.
Import pattern analysis:
• Weekly imports: 6.3 million barrels per day
• Weekly increase: 1.4 million barrels per day
• Four-week average: 6.0 million barrels per day
• Year-over-year decline: 9.7 percent
Geographic Source Diversification Strategies
Market analysts specifically highlighted unusually low import levels from Canada during this period, noting this as a contributing factor to tighter crude balances. Canadian crude supplies can experience volatility due to pipeline capacity constraints, production variations, and weather-related transportation challenges.
The relationship between import timing and inventory levels operates with typical lag periods of one to two weeks. Large tanker deliveries can cause significant week-to-week fluctuations that smooth out over longer averaging periods, requiring careful analysis to distinguish between temporary timing effects and underlying supply trend changes.
Transportation infrastructure capacity constraints can create regional supply imbalances even when aggregate national crude supply appears adequate. Pipeline systems connecting production areas to refining centres operate near maximum capacity during strong demand periods.
What Price Signals Emerge from Inventory Data?
Petroleum pricing mechanisms reflect complex relationships between inventory levels, supply-demand fundamentals, market expectations, and broader economic conditions that influence energy costs throughout the distribution chain.
WTI Crude Oil Pricing Dynamics
West Texas Intermediate crude oil traded at $57.21 per barrel on January 2, 2026, representing a weekly increase of $0.61 but remaining $17.43 lower than year-ago levels. This pricing pattern reflects the inventory dynamics observed during the period.
The correlation between weekly inventory changes and short-term price movements demonstrates how the usa crude oil stocks drop can create immediate upward pressure on pricing. However, the substantial year-over-year price decline indicates that longer-term fundamentals continue to influence pricing more significantly than short-term inventory fluctuations.
These pricing dynamics align with broader market concerns reflected in oil price stagnation insights that examine how multiple factors contribute to energy market uncertainty.
WTI pricing metrics:
• Current price: $57.21 per barrel
• Weekly change: +$0.61
• Annual decline: $17.43
• Market response: Inventory correlation evident
Retail Fuel Price Transmission Mechanisms
Retail gasoline prices averaged $2.796 per gallon nationally on January 5, 2026, showing a $0.015 weekly decrease and $0.251 annual decline compared to 2025 levels. This pricing behaviour reflects complex transmission mechanisms between wholesale crude costs and retail markup structures.
Diesel pricing followed similar patterns at $3.477 per gallon, declining $0.023 weekly and $0.084 annually. The relatively smaller diesel price movements compared to gasoline reflect different demand patterns affecting distillate markets.
Retail price structure:
• Regular gasoline: $2.796 per gallon
• Diesel fuel: $3.477 per gallon
• Weekly gasoline change: -$0.015
• Annual gasoline decline: $0.251
The next major ASX story will hit our subscribers first
How Accurate Are Market Forecasting Models?
The precision of inventory forecasting models reveals important insights about market transparency, analytical methodologies, and predictive challenges inherent in complex energy supply-demand systems.
Analyst Prediction Performance Analysis
Market strategists forecasted a crude inventory decline of 3.5 million barrels for the week ending January 2, 2026, following a 1.9 million barrel draw in the prior week. The actual decline of 3.8 million barrels exceeded predictions by 300,000 barrels, representing approximately 8.6 percent forecast error.
This forecasting differential emerged despite analysts noting tight crude balances alongside unusually low import levels, particularly from Canadian sources. The ability to identify contributing factors whilst maintaining slight prediction errors demonstrates both analytical sophistication and inherent forecasting challenges.
Forecasting performance metrics:
• Predicted draw: 3.5 million barrels
• Actual draw: 3.8 million barrels
• Prediction error: 300,000 barrels (8.6%)
• Directional accuracy: Correctly predicted drawdown
Seasonal Adjustment Factors in Inventory Modeling
Seasonal demand patterns create significant modelling challenges that require sophisticated adjustment mechanisms to account for weather impacts and industrial activity cycles. Winter heating demand creates increased distillate consumption in northern regions, whilst gasoline demand typically moderates following holiday travel periods.
The January 2026 inventory movements largely followed expected seasonal patterns, with crude draws supporting product builds. However, the magnitude of changes exceeded seasonal norms, suggesting additional factors beyond typical patterns influenced supply-demand balances.
Weather-related demand volatility introduces particular forecasting challenges, as temperature variations can significantly affect heating fuel consumption. Extended cold periods increase distillate demand whilst potentially constraining pipeline operations and refinery logistics.
What Are the Broader Market Implications?
The January 2026 inventory dynamics provide important insights into broader energy market resilience, supply chain functionality, and strategic considerations that influence long-term energy security and investment decision-making processes.
Supply Chain Resilience Assessment
Current inventory positioning at 3 percent below five-year averages for commercial crude stocks suggests adequate but not abundant supply cushions. This moderately tight positioning requires careful monitoring to ensure sufficient flexibility for responding to potential market shocks.
The 78.7 million barrel year-over-year increase in total petroleum stocks demonstrates significant supply accumulation during 2025. However, the concentration of this growth in specific categories, particularly the 29 percent above-average propane inventory levels, suggests uneven supply distribution.
Supply resilience indicators:
• Crude inventory cushion: Moderate (3% below average)
• Total stock buildup: Substantial (+78.7 million barrels annually)
• Product distribution: Uneven across categories
• Emergency reserve status: Rebuilding (+19.7 million barrels SPR)
Investment and Trading Strategy Considerations
The correlation between inventory levels and pricing dynamics creates opportunities for sophisticated energy market participants whilst requiring careful risk management strategies. The ability of weekly inventory changes to influence short-term pricing suggests active trading opportunities for participants capable of accurately forecasting inventory movements.
Crack spread economics revealed by intensive refinery processing activity indicate strong margins that incentivised maximum crude oil throughput. These margin opportunities can persist for extended periods when supply-demand fundamentals support favourable processing economics.
The substantial year-over-year price decline of $17.43 per barrel for WTI crude, despite moderately tight inventory conditions, suggests fundamental supply-demand balance shifts. This disconnect between current positioning and pricing indicates potential value opportunities for longer-term investors.
Policy and Regulatory Environment Effects
The Strategic Petroleum Reserve rebuilding program demonstrated by the 19.7 million barrel annual increase represents significant government market participation. Federal reserve management policies create periodic demand for crude purchases when rebuilding stockpiles, whilst potential release decisions during supply emergencies can rapidly increase available supply.
Environmental regulations affecting refining operations, transportation infrastructure, and storage facilities continue evolving in ways that influence inventory management strategies. Compliance requirements for emissions control and environmental protection create ongoing capital investment needs.
Infrastructure investment priorities, particularly regarding pipeline capacity expansion and storage facility development, significantly influence regional inventory management capabilities. Federal and state policy decisions regarding energy infrastructure development affect long-term strategic positioning.
Looking Forward: Inventory Trend Projections
Future inventory dynamics will reflect evolving seasonal patterns, structural market changes, and strategic positioning decisions that influence energy supply security and market stability throughout 2026 and beyond.
Seasonal Demand Cycle Expectations
Spring refinery maintenance season typically begins in March and April, when processing facilities conduct major turnarounds. This seasonal pattern normally allows crude inventory accumulation as processing rates decline temporarily, potentially reversing the January 2026 drawdown trends observed.
Summer driving season preparation requires substantial gasoline inventory builds beginning in late spring, creating intensive crude oil demand. The current 3 percent above-average gasoline inventory positioning provides a foundation for this seasonal buildup, though continued crude processing will be necessary.
Seasonal projection factors:
• Spring maintenance: Temporary processing reduction expected
• Summer preparation: Intensive gasoline production requirements
• Hurricane season: Contingency planning for Gulf Coast operations
• Winter 2026-27: Distillate inventory accumulation needs
Long-Term Storage Infrastructure Development
Capacity expansion projects across key petroleum storage regions continue advancing to accommodate growing domestic production levels and enhanced supply chain flexibility requirements. The concentration of SPR facilities in Gulf Coast salt dome formations creates regional concentration risks that infrastructure diversification efforts aim to address.
Technology improvements in inventory management systems, including advanced monitoring capabilities and automated inventory optimisation systems, enhance operational efficiency. These technological advances enable more precise inventory management that can maintain adequate supply security with reduced buffer stock requirements.
Strategic location optimisation trends focus on developing storage capacity in key transportation hubs that provide maximum flexibility for supply distribution. The integration of pipeline networks, marine terminals, and rail connections at major storage facilities enhances logistical options whilst reducing transportation costs.
The WTI/Brent futures outlook suggests continued volatility in energy markets, requiring adaptive inventory management strategies. Furthermore, as reported by Trading Economics, the latest data confirms the ongoing importance of monitoring weekly inventory changes for market participants and policymakers alike.
Investment Disclaimer: This analysis contains forward-looking statements and projections based on current market conditions, historical data, and industry trends. Petroleum inventory levels, pricing dynamics, and supply-demand fundamentals are subject to significant volatility due to geopolitical events, weather patterns, economic conditions, and regulatory changes. Investors should conduct independent analysis and consider multiple scenarios when making energy sector investment decisions. Past performance and current positioning do not guarantee future results in commodity markets characterised by substantial price and volume uncertainty.
Ready to Capitalise on Energy Market Volatility?
The complex dynamics driving crude oil inventory movements and their pricing implications present both significant opportunities and risks for energy sector investors. Discovery Alert's proprietary Discovery IQ model delivers real-time alerts on significant energy and commodity discoveries, instantly empowering subscribers to identify actionable opportunities ahead of the broader market and begin your 30-day free trial today to secure your market-leading advantage.