July 21, 2026
The Energy Trade Realignment No One Fully Predicted
When historians eventually chronicle the transformation of global energy trade in the 2020s, the rise of American liquefied natural gas will occupy a central chapter. What began as a modest pivot away from import dependency has evolved into something far more consequential: the United States now commands the largest share of global LNG supply ever held by a single nation, and the numbers underlying that dominance continue to surprise even the analysts closest to the data.
USA LNG growth exceeding all expectations is not merely a headline. It is a structural reality reflected in export volumes, investment commitments, economic multipliers, and geopolitical leverage that were, until recently, considered aspirational rather than achievable within this timeframe.
When big ASX news breaks, our subscribers know first
From Net Importer to World Supplier: The Decade That Changed Everything
The shale revolution is the foundation beneath every LNG export terminal currently operating along the U.S. Gulf Coast. Before hydraulic fracturing unlocked the Marcellus, Haynesville, and Permian Basin gas formations at scale, the United States was actively building import infrastructure. Terminals designed to receive foreign LNG were subsequently converted to export facilities, a logistical irony that underscores just how dramatically the resource picture changed.
What makes the American gas story particularly unusual is the combination of geological abundance and infrastructure scale. The U.S. operates more than 300,000 miles of natural gas transmission pipelines, creating the world's most interconnected gas network. This infrastructure density allows gas produced in Appalachia, Texas, or Louisiana to reach export terminals with a level of supply reliability that few competing nations can replicate.
The consequence is a domestic market that, despite absorbing a 70% increase in total gas demand since 2010, has seen prices trend downward over the same period. That dynamic is counterintuitive to most energy observers trained to expect supply-demand tightening to translate into price appreciation. For a broader view of where things are heading, the LNG supply outlook heading into the mid-2020s helps contextualise the scale of this shift.
The Scale of What Has Already Been Built
A $44 Billion Industry That Barely Existed a Decade Ago
According to analysis from S&P Global, the U.S. LNG sector has grown into a $44 billion annual industry in roughly a decade, a pace of industrial scaling rarely observed outside of technology sectors. To contextualise that figure: the entire U.S. LNG export industry effectively did not exist in commercial terms before 2016, when Sabine Pass in Louisiana shipped its first cargo.
2025: A Record Year That Redefined Global LNG Benchmarks
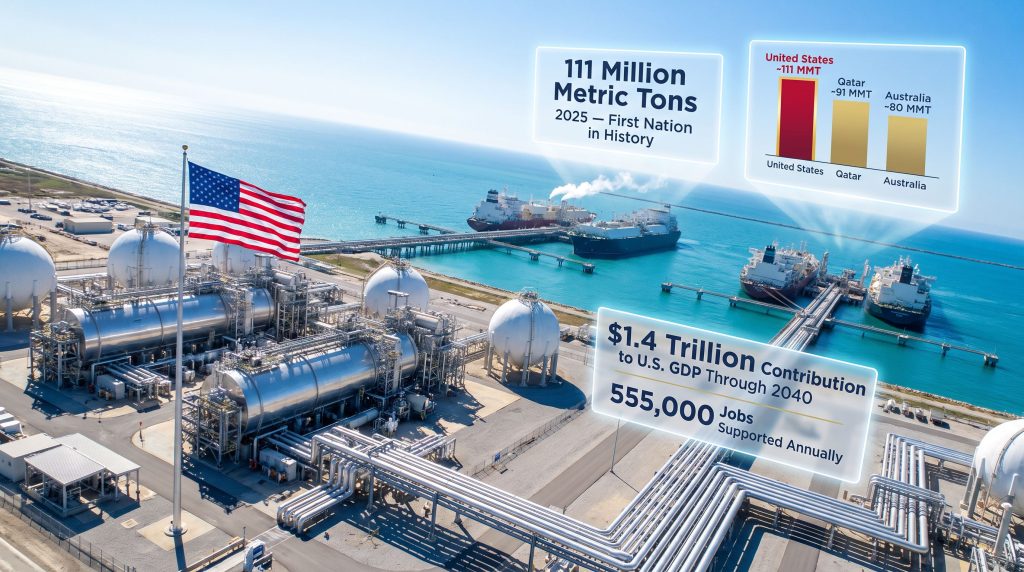
The year 2025 marked a watershed moment for U.S. export volumes. The United States became the first country in history to export more than 100 million metric tons of LNG in a single calendar year, with total volumes reaching approximately 111 million metric tons (MMT). That figure exceeded Qatar's output by nearly 20 MMT, a gap that reflects not just volume growth but a fundamentally different production trajectory between the two nations.
| Supplier | 2025 Export Volume (MMT) | Global Market Share Trend |
|---|---|---|
| United States | ~111 | Approaching 33%+ |
| Qatar | ~91 | Stable / Moderate growth |
| Australia | ~80 | Plateauing |
Australia, which held the top export position for several years, has seen volumes plateau as its major offshore projects reach plateau production. Qatar, while expanding its North Field development, faces longer lead times before new capacity comes online. The U.S. structural advantage, rooted in onshore shale gas production and modular liquefaction technology, allows capacity additions at a pace that offshore LNG megaprojects cannot match.
What the Revised Economic Projections Through 2040 Actually Reveal
The revised S&P Global Energy study, updated to reflect the surge in investment that followed the lifting of the U.S. LNG permitting pause in January 2025, presents a materially more optimistic economic picture than its December 2024 predecessor across every major metric.
| Economic Indicator | Projected Figure (Through 2040) | Increase vs. December 2024 Baseline |
|---|---|---|
| Annual Jobs Supported | 555,000 | +55,000 |
| Contribution to U.S. GDP | $1.4 trillion | +$100 billion |
| Total Business Revenues | $2.9 trillion | +$400 billion |
| Federal & State Tax Revenue | $206 billion | +$40 billion |
| Labor Income | $630 billion | +$130 billion |
These are not marginal revisions. A $400 billion upward revision to total business revenues in the space of approximately seven months reflects the scale of investment that was unlocked following the policy environment shift in early 2025. Seven new projects reached final investment decision (FID) in the period following the pause's removal, with several additional projects expected to follow within the next six to twelve months.
Independent economic modelling now positions U.S. LNG exports to rank second only to civilian aircraft and parts among all U.S. net export categories by 2031, a structural reclassification with significant trade balance and policy implications.
Export Volume Trajectory: The Numbers Behind the Growth Curve
The U.S. Energy Information Administration's short-term energy outlook provides granular visibility into the near-term export ramp. Gross LNG exports came in at 15.1 billion cubic feet per day (Bcf/d) in 2025, with the trajectory accelerating sharply through 2026 and 2027. Furthermore, US natural gas prices have remained surprisingly stable throughout this expansion phase, reinforcing the domestic supply buffer.
| Period | Projected LNG Gross Exports (Bcf/d) |
|---|---|
| 2025 (Actual) | 15.1 |
| Q3 2026 | 16.7 |
| Q4 2026 | 18.0 |
| Full Year 2026 (Average) | 17.4 |
| Q1 2027 | 18.7 |
| Q4 2027 | 19.6 |
| Full Year 2027 (Average) | 18.6 |
| 2030 Projection | ~21.5 |
Year-on-year export growth of 24 to 25% in 2025 reflects both the commissioning of new liquefaction trains and the operational ramp-up of facilities that had already reached mechanical completion. According to IEA's global LNG capacity tracker, S&P Global projects feedgas demand for LNG exports to double to 36 Bcf/d within five years, which would represent approximately 25% above previous base case projections.
Crossing One-Third of Global Market Share
The threshold of one-third global LNG market share carries strategic significance beyond a statistical milestone. At that level of market penetration, the United States gains meaningful influence over global spot price formation, cargo routing decisions, and the effective floor under which competing suppliers must price to remain competitive. No single country has previously approached this level of LNG market dominance.
Infrastructure Driving the Capacity Ramp
The New Wave of Sanctioned Projects
The post-pause investment surge has been substantial. Over 80 billion cubic metres per year of new liquefaction capacity was sanctioned in 2025 alone, which industry observers note may represent an all-time annual record for the LNG sector globally. Key projects contributing to near-term capacity additions include:
- Golden Pass LNG Train 1, which shipped its first cargo in April 2025 and contributed approximately 0.9 Bcf/d of new capacity alongside Corpus Christi Stage 3
- Corpus Christi Train 6, scheduled for commissioning in summer 2026, adding a further 0.2 Bcf/d of nominal export capacity
- Multiple additional projects sanctioned in 2025 expected to contribute a combined 13.9 Bcf/d of new liquefaction capacity between 2025 and 2029
The modular nature of U.S. LNG expansion, built around mid-scale and large-scale liquefaction trains rather than single mega-project developments, allows a more distributed risk profile and shorter construction timelines than the floating LNG and offshore megaprojects favoured by competing suppliers.
The next major ASX story will hit our subscribers first
The Domestic Price Question: Does Export Growth Hurt American Consumers?
This is perhaps the most politically sensitive dimension of the LNG export debate, and the data consistently challenges the conventional assumption. The S&P Global study projects that expanded exports will result in an average increase in end-user gas costs of just 1.6% per household between 2026 and 2031, a figure characterised as negligible relative to the economic benefits generated.
The reason domestic prices remain insulated is structural rather than coincidental:
- U.S. domestic gas production has grown at three times the rate of LNG export volume expansion since 2010
- More than 45 years of identified commercial gas reserves exist at current production levels
- The shale resource base continues to expand as drilling technology improves recovery rates in existing plays
Despite a 70% increase in total U.S. gas demand since 2010, domestic natural gas prices have trended downward, a dynamic underpinned by a production growth rate that has consistently outpaced even optimistic demand forecasts.
In addition, gas price recovery forecasts suggest that any modest upward pressure on domestic prices remains well within manageable bounds for consumers and industrial users alike.
The Iran Conflict as a Real-World Stress Test
The most recent geopolitical stress test of the U.S. domestic gas market came during the Iran conflict period, when global LNG prices rose sharply on Strait of Hormuz disruption fears. Notably, U.S. Henry Hub prices moved in the opposite direction, declining during the same period. This divergence between domestic and international price behaviour illustrates the insulating effect that the combination of abundant supply and flexible export infrastructure provides to American consumers and industrial gas users.
Pipeline Constraints: The Binding Bottleneck
While resource supply and liquefaction capacity are expanding in tandem, the S&P Global study identifies pipeline infrastructure as the primary constraint on price stability in specific regional markets. The Northeast presents the clearest case study: seasonal heating demand spikes combined with growing winter power generation loads create extreme price volatility in New England and New York markets during cold snaps.
The study models that expanded pipeline capacity into the Northeast could reduce peak winter month gas prices by more than 20% in key markets during the 2028 to 2031 period. The challenge, as identified in the analysis, is not resource availability or market demand but the regulatory and permitting process that governs pipeline construction approvals. The ability to build new pipeline capacity is identified as the main constraint on resolving regional price volatility, not the gas itself.
Global Energy Security: What Curtailment Would Actually Cost the World
The Extended Pause Scenario
Perhaps the most consequential section of the S&P Global study examines what would happen to global energy markets if the investment surge since January 2025 had not occurred. Under an extended pause scenario, the findings are stark:
- Global LNG markets would tighten significantly by 2031
- European and Asian gas prices would rise approximately 50% above base case levels
- Up to $76 billion per year would be transferred to non-U.S. energy suppliers filling the demand gap
- Displaced volumes would largely be replaced by alternative fossil fuels, with coal identified as a primary substitute
- Russia is identified as the primary beneficiary of any meaningful reduction in U.S. flows to Europe, given that the U.S. is currently Europe's largest LNG supplier
These findings reframe the U.S. LNG debate from a narrow trade economics discussion to a broader question of global energy security architecture. The ability of European nations to diversify away from Russian pipeline gas is directly dependent on the continued expansion of American export capacity. Moreover, the LNG import tax structure in key importing nations such as India plays an important role in shaping how quickly demand can absorb expanding U.S. supply. Consequently, the broader question of US LNG tariff pressures across Asian markets adds another layer of complexity to the long-term demand picture.
Frequently Asked Questions: USA LNG Growth Exceeding All Expectations
Why Is USA LNG Growth Described as Exceeding All Expectations?
Because every major forecast model, including those produced by the EIA and independent consultancies, has been revised upward repeatedly as actual volumes, investment decisions, and economic multipliers have come in above projections. As Yergin notes, the pace of capacity addition following the January 2025 policy shift accelerated beyond what most models had incorporated.
What Is the U.S. LNG Industry Worth Annually in 2026?
The sector has grown into a $44 billion annual industry, a figure that encompasses liquefaction, shipping, terminal operations, and the upstream gas production associated with export volumes.
When Will U.S. LNG Become the Second Largest U.S. Net Export Industry?
S&P Global projects this transition will occur by 2031, when LNG is expected to rank second only to civilian aircraft and parts among all U.S. net export categories.
Does Expanding LNG Exports Raise Gas Bills for American Households?
The projected impact is a 1.6% average increase in end-user gas costs per household between 2026 and 2031, which the S&P Global study characterises as negligible given the scale of economic benefits generated elsewhere in the economy.
What Would Happen to Global Gas Prices If U.S. LNG Expansion Stopped?
European and Asian prices would be approximately 50% higher than base case projections by 2031, with up to $76 billion per year redirected to non-U.S. suppliers, predominantly in the form of increased fossil fuel consumption including coal.
The Strategic Outlook: What Comes Next
The near-term milestones to watch are well-defined: Corpus Christi Train 6 commissioning in summer 2026, the progression of post-FID projects through construction toward first cargo, and the crossing of the one-third global market share threshold expected within the current five-year projection window. USA LNG growth exceeding all expectations has fundamentally altered the strategic calculus for importing nations and competing exporters alike.
Longer term, the structural case for continued U.S. LNG dominance rests on a resource base that remains among the most prolific on the planet. With more than four decades of identified commercial reserves at current production rates, and ongoing improvements in horizontal drilling and completion technology continuing to improve recovery economics in shale formations, the supply side of the equation appears robust.
The variables most likely to determine whether current projections are achieved or exceeded are not geological but institutional: pipeline permitting timelines, liquefaction project financing conditions, and the stability of the policy environment governing new export authorisations. For investors, policymakers, and trading partners alike, monitoring these institutional factors will be as important as tracking the volume data itself.
Disclaimer: This article contains forward-looking projections sourced from third-party research and government data. Economic forecasts, export volume projections, and market share estimates are subject to change based on evolving market conditions, regulatory decisions, and geopolitical developments. Nothing in this article constitutes financial or investment advice.
Want to Capitalise on the Commodity Discoveries Driving the Next Wave of Resource Investment?
Discovery Alert's proprietary Discovery IQ model delivers real-time alerts on significant ASX mineral discoveries, instantly translating complex resource data into actionable investment insights for both short-term traders and long-term investors — explore historic examples of major discovery returns to understand the scale of opportunity, and begin your 14-day free trial today to position yourself ahead of the broader market.