July 15, 2026
The Structural Case for Gold Mining Equities in 2026
Investor sentiment toward precious metals has always moved in cycles, but something measurably different is taking shape in 2026. The VanEck gold mining stocks standout trade has become one of the most discussed themes in precious metals investment circles, and for good reason. The divergence between physical gold and gold mining equities has widened to a degree that challenges conventional assumptions about how the two assets move in relation to each other. For decades, retail and institutional investors alike have defaulted to bullion or gold-backed ETFs as their primary precious metals allocation.
The data from the past twelve months is now making a compelling case that this default position may be leaving significant performance on the table. Understanding why this gap has emerged, and whether it is durable, requires looking beyond price charts and into the structural mechanics of how mining companies generate earnings at various gold price levels.
When big ASX news breaks, our subscribers know first
Cross-Asset Performance: Where Mining Equities Stand in 2026
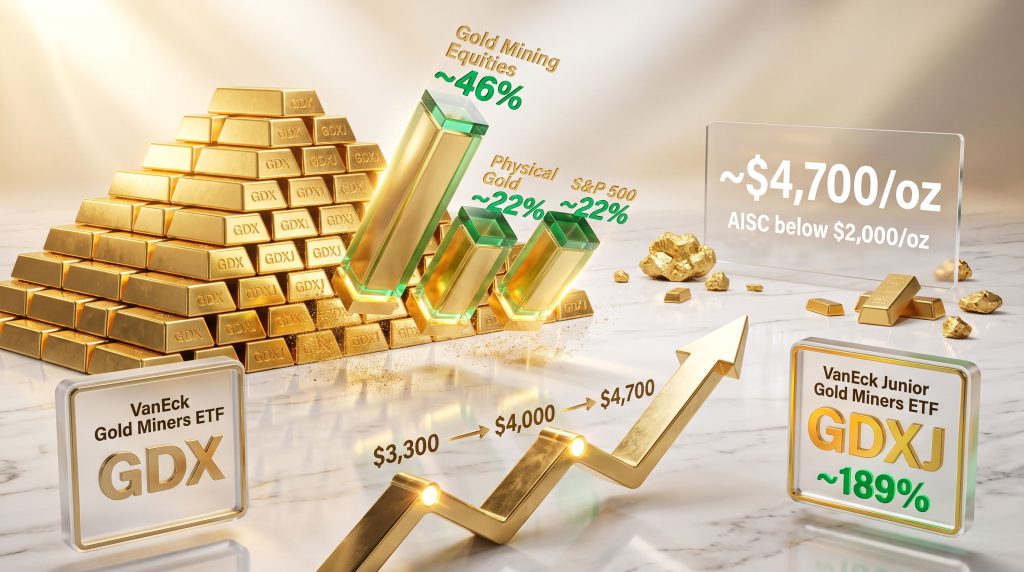
The twelve-month performance comparison across major asset classes tells a story that few commentators anticipated entering the year. Gold mining equities as a broad sector have returned approximately 46% over the past year, a figure that stands well above every comparable asset class tracked over the same period.
| Asset Class | 12-Month Return (to mid-2026) |
|---|---|
| Gold Mining Equities (broad sector) | ~46% |
| Broader Commodities Index | ~26% |
| Physical Gold | ~22% |
| S&P 500 | ~22% |
The outperformance of mining equities relative to physical gold is not a minor rounding difference. It represents a structural re-rating of how the market is pricing operational leverage within the sector. Furthermore, physical gold and the S&P 500 are essentially tied on a trailing twelve-month basis, which itself is a notable data point, but the mining equity premium is the figure that deserves the most analytical attention. For a deeper understanding of how the gold price and mining equities interact, the mechanics behind this divergence are worth examining closely.
What Drives the Gap Between Miners and Bullion?
The core mechanism behind this divergence is a concept known as operational leverage. When gold prices rise, mining company revenues increase proportionally, but their cost bases do not move at the same rate. The result is margin expansion that compounds rapidly at elevated gold price levels.
In 2026, this dynamic has been amplified by a particularly wide spread between revenues and costs:
- Gold has traded at an average price of approximately $4,700 per ounce so far in 2026, according to analysis published by VanEck's precious metals portfolio management team via Kitco News
- All-in sustaining costs (AISC) across the sector are estimated to average below $2,000 per ounce in 2026
- This creates a gross margin of more than $2,700 per ounce produced, a historically exceptional position for the sector
- Even at a conservative $4,000 gold price, which represents the current floor in consolidation, the margin per ounce still exceeds $2,000
At current gold prices, mining companies are generating record cash flow. Q1 2026 earnings confirmed this across the sector, enabling capital returns to shareholders and organic growth financing simultaneously.
This combination of high margins and strengthening balance sheets has begun attracting a new cohort of institutional investors who previously avoided mining equities due to the sector's historical reputation for poor capital discipline. The shift is meaningful: capital allocation practices within large and mid-tier producers have materially improved over the past three to four years, moving away from empire-building acquisitions and toward disciplined shareholder returns.
VanEck Gold Mining Stocks and the Standout Trade Thesis
The phrase VanEck gold mining stocks standout trade has become shorthand in precious metals investment circles for the outperformance argument being made most forcefully by VanEck's precious metals team. Two ETF vehicles sit at the centre of this thesis. Understanding the types of gold mining stocks available is essential before deciding which vehicle best suits your investment objectives.
| ETF | Focus | Risk Profile | Key Characteristic |
|---|---|---|---|
| VanEck Gold Miners ETF (GDX) | Large-cap producers | Moderate | Defensive, dividend-oriented |
| VanEck Junior Gold Miners ETF (GDXJ) | Small-to-mid cap miners | Higher / Growth-oriented | Higher beta, amplified returns |
| Physical Gold (GLD) | Bullion exposure | Lower | No operational leverage |
The GDXJ outperformed GDX by approximately 13 percentage points in 2025, and this gap has continued into 2026. During one notable trading session, GDXJ surged 5.81% while physical gold gained approximately 2.5%, a near 2.3-to-1 amplification ratio in a single day that illustrates the leverage effect in real time. The VanEck Gold Miners ETF snapshot provides current holdings and performance data for investors evaluating this vehicle.
Why Junior Miners Sit at the Core of the Trade
Junior and mid-tier miners occupy a unique position in the capital structure of the precious metals industry. Their smaller production bases mean that incremental gold price gains flow more directly to the bottom line, without the bureaucratic drag and hedging programmes that can dampen earnings sensitivity at the major producer level.
Historically, junior miners have returned three to five times the underlying metal's gain during sustained precious metals bull markets. Key contributors to this amplification include:
- Newly operational high-margin projects reaching nameplate capacity during periods of peak gold prices
- Lower absolute cost bases in some cases, particularly for single-asset operators in favourable jurisdictions
- Acquisition premium potential as major producers seek reserve replenishment through M&A
- Investor rotation dynamics, where capital moves from physical ETFs into equity vehicles as the leverage argument gains traction
Standout performers within the junior and mid-tier space have included companies such as IAMGOLD (IAG), Alamos Gold (AGI), Hecla Mining (HL), and First Majestic Silver (AG), each benefiting from varying combinations of operational execution, newly commissioned production, and elevated precious metals prices.
The Macroeconomic Architecture Supporting Gold Miners
The macro backdrop supporting gold mining equities in 2026 is not a single variable but a convergence of several reinforcing dynamics that individually would be meaningful and collectively create a structurally supportive environment. The gold price outlook for miners reflects this multi-factor tailwind in considerable detail.
Inflation, Real Rates, and the Fed's Policy Posture
The most technically precise framework for understanding gold's behaviour in the current cycle is the relationship between gold prices and real interest rates, defined as nominal rates minus inflation. When real rates are low or negative, the opportunity cost of holding non-yielding assets like gold diminishes, historically driving gold and gold-related equities higher.
Current data points within this framework:
- Headline CPI (latest reading): 3.5% year-over-year, down from 4.2% the prior month, driven primarily by a sharp decline in energy prices
- Monthly consumer price movement: -0.4%, one of the most significant single-month declines in recent memory
- Core CPI (annual): 2.6%, down from 2.9%, but still meaningfully above the Federal Reserve's 2% target
- CME FedWatch pricing: Markets assigning approximately a 50/50 probability to a September rate hike, with one hike priced into 2026 overall
The nuanced insight here is that a prolonged pause by the Federal Reserve, even without rate cuts, can be structurally bullish for gold over time. If inflation remains persistently above target while the Fed holds rates steady, real rates compress automatically, reproducing the same mathematical dynamic that drove gold appreciation during earlier low-real-rate regimes.
As articulated by VanEck's precious metals portfolio management team and reported by Kitco News, a sustained Fed-on-hold environment could contribute to lower or even negative real rates over time, a backdrop that has historically been among the most favourable conditions for gold price appreciation.
Geopolitical Risk as a Structural, Not Cyclical, Premium
One dimension of gold's current price floor that deserves more analytical attention than it typically receives is the embedded geopolitical risk premium. Unlike interest rate expectations, which fluctuate with each data release, geopolitical risk tends to embed itself into commodity prices on multi-year timescales.
The prolonged economic spillover effects of the Middle East conflict have not resolved. Supply chain disruptions, elevated energy price volatility, and shifts in global reserve management behaviour by central banks all contribute to a structural demand underpinning for gold that purely rate-based models may underestimate.
Investors who focus exclusively on Fed policy as the primary driver of gold may be missing a significant portion of the structural demand story embedded in central bank behaviour and geopolitical risk premiums.
Valuation Signals: The Disconnect That Defines the Opportunity
Perhaps the most compelling and least widely appreciated aspect of the current gold mining equity environment is the persistent valuation discount at which mining stocks trade relative to the underlying gold price. Despite record cash flows confirmed in Q1 2026 earnings, equity valuations continue to embed more conservative gold price assumptions than those implied by spot and futures markets. This phenomenon is explored in depth through the lens of undervalued mining stocks and the paradox it presents.
This creates a potential mispricing scenario that can be quantified across several dimensions:
- Current equity prices appear to price in gold closer to the $3,500 to $4,000 range, well below the $4,700 average observed in 2026
- Companies are actively deploying free cash flow across three channels: organic growth investment, dividend distributions, and share buyback programmes
- The buyback activity is particularly notable, as it signals management confidence in sustained cash generation rather than a temporary windfall
Analyst Consensus Gold Price Projections
| Year | Consensus Mean Gold Price Estimate |
|---|---|
| 2026 | ~$4,700/oz |
| 2027 | ~$4,700/oz |
| 2028 | Above $4,000/oz |
| 2029 | Above $4,000/oz |
These projections, referenced by VanEck's precious metals team via Kitco News, reflect analyst consensus after downward revisions by multiple banks in response to near-term inflation and rate uncertainty. The fact that even revised estimates sit at $4,700 for the next two years provides a durable earnings floor assumption for mining company financial modelling.
Portfolio Construction: Three Roles Mining Equities Can Play
For investors approaching the sector from an asset allocation perspective, gold mining equities can serve meaningfully different functions depending on portfolio construction goals. Moreover, understanding the broader gold-stock market relationship provides important context for how these positions interact with a diversified portfolio across secular cycles.
- Inflation hedge with operational leverage – Unlike physical gold, which offers passive inflation protection, mining equities amplify that protection through earnings mechanics, generating higher returns per dollar of gold price appreciation
- Geopolitical risk buffer – Central bank gold accumulation trends and sustained demand from reserve-diversifying economies provide a demand floor that is less sensitive to short-term rate movements
- Equity market diversifier – With the S&P 500 trading near record valuations, the mining sector offers exposure to an asset class with historically lower correlation to broad equity markets, particularly during periods of credit stress
Risk Factors That Cannot Be Dismissed
A balanced assessment of this trade requires honest acknowledgement of the risks that could test the thesis:
- Rate hike execution risk: A September Federal Reserve tightening move could compress gold prices and temporarily weigh on mining equity valuations
- Disinflation acceleration: If energy-driven price declines extend into core inflation more rapidly than expected, the real rate argument weakens
- Operational execution risk: Junior miners carry project development and commissioning risk that large-cap producers do not, and production delays at key assets can destroy value rapidly
- Broad equity correlation risk: In severe risk-off events, mining equities can temporarily correlate with broad equity market selloffs before their fundamental decoupling reasserts itself
Large-Cap vs. Junior: Matching Risk Profile to Investor Objective
| Investor Profile | Preferred Vehicle | Rationale |
|---|---|---|
| Income-focused, lower risk tolerance | GDX (large-cap) | Dividend yields, lower beta, defensive characteristics |
| Growth-oriented, higher risk tolerance | GDXJ (junior/mid-tier) | 3x-5x gold price amplification, margin expansion upside |
| Tactical allocation | Blended GDX/GDXJ | Balances defensive positioning with growth optionality |
For investors seeking independent analysis on how these vehicles are positioned, Morningstar's coverage of GDX offers detailed fund data and analyst commentary.
The next major ASX story will hit our subscribers first
Frequently Asked Questions
What makes VanEck gold mining stocks the standout trade in 2026?
The VanEck gold mining stocks standout trade characterisation reflects the sector's approximately 46% twelve-month return, more than double physical gold's 22% gain over the same period. The combination of record margins, historically low relative valuations, and a structurally supportive macro environment creates a convergence of tailwinds that is unusual in its breadth and durability.
Why do junior miners outperform large-cap producers during gold bull markets?
Junior miners carry higher operational leverage to gold prices because their fixed cost bases are smaller relative to their revenue sensitivity. As gold prices rise, a greater proportion of incremental revenue flows directly to earnings. With AISC below $2,000 per ounce and gold averaging $4,700 in 2026, margin expansion at smaller, newly operational mines has been particularly dramatic compared to large-cap peers.
Is the current consolidation above $4,000 gold a warning sign?
Analyst consensus, even after downward revisions, projects gold prices averaging approximately $4,700 per ounce through 2027 and remaining above $4,000 through 2029. At the $4,000 floor level, sector margins still exceed $2,000 per ounce, placing the mining industry in a structurally profitable position regardless of near-term price volatility.
How does the macroeconomic environment support gold mining equities specifically?
Above-target inflation at 3.5% annually, a Federal Reserve positioned for a prolonged pause, and embedded geopolitical risk premiums from ongoing global conflicts create a multi-factor supportive environment. The real rate framework is particularly relevant: sustained inflation above the Fed's 2% target while rates remain static compresses real yields over time, historically one of the most favourable conditions for gold and gold mining equities.
Key Takeaways for Investors
- Gold mining equities have returned approximately 46% over twelve months, outperforming physical gold (22%), the S&P 500 (22%), and the broader commodities index (26%)
- The VanEck Junior Gold Miners ETF (GDXJ) represents the highest-beta expression of the trade, with historical amplification of three to five times the underlying metal's return during bull markets
- With gold averaging $4,700/oz in 2026 and AISC below $2,000/oz, sector margins are at historically exceptional levels, generating record cash flows
- Analyst consensus projects gold prices at approximately $4,700/oz through 2027 and above $4,000/oz through 2029, even after downward revisions
- Mining equities continue to trade at a discount to intrinsic value relative to prevailing gold prices, creating a potential re-rating opportunity
- Short-term volatility driven by Fed rate expectations and CPI data is broadly characterised as noise against the backdrop of a multi-year structural bull market in precious metals
This article is for informational purposes only and does not constitute financial advice or a solicitation to buy or sell any securities. Past performance is not indicative of future results. Investing in mining equities, particularly junior miners, involves significant risk including the potential loss of capital. Readers should conduct their own due diligence and consult a qualified financial advisor before making investment decisions. Gold price forecasts and consensus estimates are subject to revision and may not be achieved.
For ongoing coverage of gold price movements, mining sector developments, and macroeconomic analysis relevant to precious metals investors, Kitco News at kitco.com provides comprehensive daily reporting from experienced precious metals journalists.
Want to Know When the Next Major ASX Mineral Discovery Hits the Market?
Discovery Alert's proprietary Discovery IQ model delivers real-time alerts on significant ASX mineral discoveries, transforming complex mineral data into actionable insights for both short-term traders and long-term investors — begin your 14-day free trial today and position yourself ahead of the broader market, or visit Discovery Alert's dedicated discoveries page to understand how historic mineral discoveries have generated extraordinary returns for early investors.