
July 27, 2026
Market dynamics across global shipping lanes reveal increasingly complex patterns as vessel economics reshape international trade flows. The transportation infrastructure connecting crude oil producers with refineries worldwide operates through intricate systems where capacity constraints, regulatory frameworks, and geopolitical risks create cascading effects throughout energy markets. Understanding these mechanisms becomes essential as traditional shipping patterns face unprecedented disruption, particularly when very large crude carrier rates surge beyond historical norms.
Understanding Very Large Crude Carrier Economics and Market Significance
The global crude oil transportation system relies heavily on specialised vessels designed to move massive volumes efficiently across ocean distances. Very large crude carriers (VLCCs) represent the backbone of this system, with individual vessels capable of transporting over 2 million barrels of crude oil per voyage. This enormous capacity places them at the centre of international energy trade, where approximately 800 active VLCCs operate globally to service major shipping routes.
Technical Specifications and Fleet Composition
VLCCs operate within strict technical parameters that define their market role. These vessels typically measure between 330-340 metres in length, with cargo capacity ranging from 280,000 to 320,000 deadweight tons. The scale of these operations becomes apparent when considering that VLCCs transport approximately 60% of seaborne crude oil, making them critical infrastructure for global energy security.
Fleet ownership patterns reveal significant market concentration, with the top 10 operators controlling roughly 40% of the global VLCC fleet. This concentration creates market dynamics where operational decisions by major shipping companies can influence global freight rates and oil supply chains. The remaining fleet operates through various ownership structures, including independent owners, oil company fleets, and chartered vessels.
Rate Calculation Systems and Market Mechanisms
VLCC freight rates operate through sophisticated pricing mechanisms that reflect multiple market variables. The Worldscale points system provides standardised rate calculations, while daily charter rates offer alternative pricing structures for different voyage types. Market participants track various metrics including freight-to-oil price ratios, which serve as key indicators of shipping market conditions relative to commodity values.
Recent market conditions demonstrate extreme rate volatility, with specific routes reaching unprecedented levels. The Mideast Gulf to China VLCC route achieved rates of $15.32 per barrel on March 3, 2026, representing just over 20% of the free-on-board (FOB) value for Basrah medium crude. This rate level represents a more than 100% increase from February 27's already elevated level of $6.82 per barrel.
| Rate Metric | March 3, 2026 | February 27, 2026 | Year-over-Year Change |
|---|---|---|---|
| $/Barrel Rate | $15.32 | $6.82 | ~300% increase |
| FOB Percentage | 20.1% | 10.0% | 100% increase |
| Weekly Change | +124% | N/A | Extreme volatility |
When big ASX news breaks, our subscribers know first
Geopolitical Risk Transmission Through Shipping Networks
Geographic chokepoints create systemic vulnerabilities in global oil transportation networks. The Strait of Hormuz represents the world's most critical petroleum shipping lane, with physical constraints that amplify geopolitical risks. At its narrowest point, the strait measures only 21 miles wide, with shipping lanes just 2 nautical miles wide in each direction. Vessels must transit at 10-12 knots and navigate turns at the narrowest point adjacent to Iranian territorial waters.
Critical Infrastructure Vulnerabilities
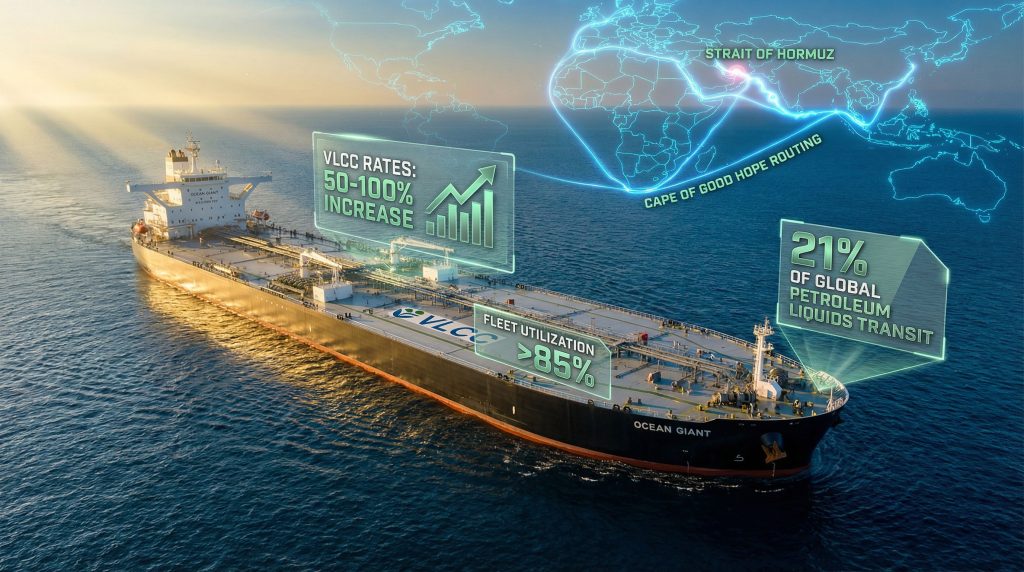
Daily throughput through the Strait of Hormuz typically handles 21% of global petroleum liquids transit, making disruptions immediately impactful on worldwide energy markets. The March 2026 crisis demonstrated this vulnerability dramatically, with tanker traffic falling 94% from 50 vessels on February 28 to only 3 tankers on March 1.
The Joint Maritime Information Center (JMIC) documented this collapse in real-time, showing how quickly geopolitical tensions translate into operational constraints. Furthermore, these developments often coincide with broader oil price trade war dynamics that reshape global energy markets. Market participants reported that approximately 700 ships became unable to exit the Mideast Gulf region following conflict escalation, representing a substantial portion of the global active fleet.
Insurance Market Response Mechanisms
Financial markets create additional constraint layers through insurance coverage decisions. Protection and indemnity (P&I) clubs' re-insurers cancelled war risk coverage in certain Mideast Gulf areas and the Gulf of Oman, effectively creating what market participants described as a de-facto closure of the waterway. This mechanism demonstrates how insurance market dynamics generate hard operational constraints independent of physical navigation challenges.
The insurance response preceded formal governmental restrictions, showing how financial risk assessment drives operational decisions. Even with high earning potential from elevated rates, VLCC spot market discussions remained largely muted as market participants adopted wait-and-see approaches due to heightened risk perceptions.
Economic Factors Beyond Geopolitical Events
Structural market conditions create the foundation for rate volatility that geopolitical events then amplify. Fleet utilisation patterns, ownership concentration, and demand-side drivers establish baseline conditions that determine how dramatically shipping markets respond to disruptions, particularly when considering tariffs economic implications affecting global trade flows.
Fleet Consolidation and Supply Constraints
Market concentration among major shipping companies creates oligopolistic conditions where capacity decisions significantly impact rates. The top 10 VLCC operators' 40% market share enables coordinated responses to market conditions, though competitive pressures still drive individual vessel deployment decisions.
Newbuilding delivery schedules and scrapping rates influence medium-term fleet availability. However, the March 2026 crisis revealed that tanker availability was already scant before the conflict started, with long-haul voyage demand from American oil producers to Asian refiners occupying diminishing available capacity.
Shadow fleet dynamics add complexity to capacity calculations, as vessels operating in sanctioned trade circuits remove tonnage from mainstream commercial markets. These vessels often operate with different insurance arrangements and commercial terms, creating parallel markets that affect overall fleet availability calculations.
Demand-Side Market Drivers
Global refinery operations create the fundamental demand for crude oil transportation services. Refinery run rates and crude inventory cycles generate seasonal and cyclical demand patterns that interact with geopolitical events to create rate volatility. In addition, these patterns often correlate with broader US oil production decline trends affecting demand for crude imports.
Strategic petroleum reserve movements represent another demand component, as government agencies occasionally conduct large-scale crude oil purchases or sales that require substantial shipping capacity. These operations can temporarily tighten vessel availability and influence regional rate differentials.
Critical Threshold Analysis: When very large crude carrier rates surge beyond 15% of crude oil FOB values, refineries typically begin adjusting procurement strategies, potentially affecting regional fuel price stability and supply chain optimisation.
Historical Rate Analysis and Market Precedents
Understanding current rate levels requires context from previous market cycles and disruption events. The March 2026 rates reaching $15.32 per barrel represent extreme conditions, but historical analysis reveals comparable periods of shipping market stress.
Recent Historical Context
The 2019-2020 IMO sulfur regulation period created significant rate volatility as vessel supply temporarily contracted due to scrubber installation requirements and fuel specification changes. However, the regulatory transition occurred gradually compared to sudden geopolitical disruptions.
COVID-19 pandemic effects demonstrated different shock patterns, with demand collapse initially suppressing rates before storage demand and supply chain disruptions created subsequent rate spikes. The pandemic period revealed how fundamental demand changes interact with operational constraints to create complex rate dynamics.
The 2022-2024 sanctions-driven market restructuring following Russian oil export restrictions created precedents for how regulatory constraints affect fleet availability and trade flow patterns. These sanctions removed substantial tonnage from mainstream markets while creating alternative trading patterns that influenced global rate structures.
Inflation-Adjusted Comparisons
Real versus nominal rate increases provide important perspective on current conditions. The February 2026 rate of $6.82 per barrel was already characterised as approximately four times the rate at the same time last year, indicating year-over-year volatility of roughly 300% before the March crisis escalation.
Operating cost inflation factors include bunker fuel price correlations, crew costs, port charges, and regulatory compliance expenses. These baseline cost increases establish minimum viable rate levels that shipping companies require for profitable operations, creating floor prices during normal market conditions.
Downstream Economic Impact Analysis
Elevated VLCC rates create cascading effects throughout petroleum supply chains, influencing refinery economics, regional price differentials, and consumer fuel costs. Understanding these transmission mechanisms helps predict broader economic implications from shipping market disruptions, particularly when considering comprehensive oil price rally insights that affect multiple market sectors.
Refinery Margin Impacts
Crude acquisition cost increases from elevated freight rates directly impact refinery economics, particularly for facilities dependent on long-haul crude imports. Refineries with access to domestic or nearby crude supplies gain competitive advantages during periods of high international shipping rates.
Regional refining economics shifts occur as freight differentials make previously uneconomical crude sources attractive. The March 2026 crisis prompted Indian refiners to shift toward Russian crude supplies to offset Mideast Gulf import disruptions, demonstrating how shipping costs drive sourcing decisions.
Product price pass-through mechanisms vary by regional market structures and competitive conditions. In markets with limited refining capacity, elevated crude freight costs translate more directly into consumer fuel prices compared to regions with excess refining capacity or strategic inventory buffers.
Consumer Price Transmission
Transportation cost components in fuel pricing typically represent small percentages under normal conditions but can become material during extreme rate periods. When freight costs reach 20% of crude FOB values, these components significantly influence retail fuel price calculations.
Regional price differential expansion occurs as freight constraints affect different geographic markets unequally. Areas dependent on specific shipping routes experience greater price volatility compared to regions with diversified supply sources or alternative transportation options.
Alternative Transportation Economics
Extreme shipping rate conditions create opportunities for alternative transportation methods that prove uneconomical under normal circumstances. Pipeline systems, smaller vessel segments, and regional sourcing strategies become commercially viable during periods of VLCC rate distress.
Pipeline Versus Tanker Break-Even Analysis
Overland pipeline transportation typically costs more per barrel-mile than seaborne shipment under normal conditions. However, when very large crude carrier rates surge to extreme levels, pipeline economics become competitive for suitable route combinations.
Strategic pipeline capacity utilisation increases during shipping disruptions as refineries and trading companies seek alternatives to seaborne transport. Long-term infrastructure investment implications emerge when shipping rate volatility demonstrates the value of transportation diversification.
Vessel Segment Arbitrage Opportunities
The March 2026 crisis created unprecedented economics reversals between vessel segments. Traditionally, VLCCs offer $/barrel discounts compared to smaller vessels due to economies of scale. However, the crisis period saw VLCC rates flip to a $6.72/barrel premium over Aframax rates, compared to a 12-month average of $1.10/barrel discount.
This reversal occurred because traders began paying more on a $/barrel basis for larger ships that typically have longer lead-times and less loading or discharge flexibility. The analysis reveals that flexibility and speed became more valuable than traditional cargo economies of scale during constrained supply conditions. VLCC rates surge to 6-year high amid Middle East tensions as market dynamics fundamentally shifted.
Aframax (700,000 barrel capacity) and Suezmax (1 million barrel capacity) vessels gained commercial advantages as traders became more likely to look to smaller tankers for their cargoes. Port infrastructure constraints and cargo parcel optimisation strategies supported this shift toward smaller vessel utilisation.
The next major ASX story will hit our subscribers first
Financial Market Response Patterns
Shipping rate volatility creates investment opportunities and risks across multiple asset classes. Equity markets, commodity derivatives, and freight-specific financial instruments respond differently to shipping market conditions, creating complex arbitrage and hedging relationships.
Equity Market Correlations
Shipping company equity valuations experience direct impacts from freight rate changes, though the relationships vary by company business models and fleet exposure. Companies with modern, well-maintained fleets benefit most from rate increases, while those with older vessels or high operating costs may see margins compressed despite higher revenues.
Oil major stock prices show mixed correlations with shipping rates, depending on upstream versus downstream business concentrations. Integrated oil companies with substantial refining operations may experience margin pressure from elevated freight costs, while pure upstream producers benefit from higher wellhead netbacks due to tight shipping markets.
Commodity Price Interactions
Crude oil futures curves reflect freight cost expectations through regional price spreads and calendar spread relationships. The ICE front-month May Brent contract traded at $82.30/barrel on March 4, up 90¢/barrel from March 3's settlement, which had ended $3.66/barrel higher. Similarly, Nymex front-month April crude reached $75.22/barrel, up 66¢/barrel from the previous day's $3.33/barrel increase.
These day-over-day movements demonstrate rapid price transmission from shipping disruption to crude futures markets. Regional price basis relationships expand during shipping constraints as freight differentials become material components of delivered crude costs. Iran tensions drive oil tanker rates to record highs as these market dynamics intensify.
Risk Management and Operational Adaptations
Market participants employ various strategies to manage shipping rate exposure and operational risks during volatile periods. These approaches range from financial hedging instruments to physical operational adjustments that reduce exposure to shipping market disruptions, including comprehensive market volatility hedging strategies.
Hedging Mechanisms and Financial Tools
Forward freight agreements (FFA) provide standardised contracts for hedging shipping rate exposure, though liquidity constraints can limit effectiveness during extreme market conditions. These instruments work best for routine hedging rather than crisis-level volatility management.
Time charter versus spot market exposure management represents a fundamental strategic decision. Companies with long-term time charter commitments gain protection from spot rate volatility but forfeit opportunities to benefit from favourable rate movements.
Insurance coverage adaptations become critical during geopolitical risk periods. The March 2026 P&I coverage cancellations demonstrated how insurance constraints can override commercial rate incentives, making coverage availability more important than rate levels for operational decisions.
Operational Strategy Modifications
Cargo scheduling optimisation helps minimise exposure to volatile shipping markets through improved voyage planning and inventory management. Companies adjust loading and discharge timing to take advantage of favourable rate windows while avoiding peak cost periods.
Alternative sourcing strategies emerged prominently during the March 2026 crisis, with crude buyers attempting to source crude from closer suppliers to mitigate sky-high freight costs. This geographic diversification reduces dependence on specific shipping routes and provides operational flexibility during disruptions.
Record demurrage costs of $310,000 per day (compared to a 12-month average of approximately $86,000/day) during the March crisis highlighted the importance of efficient port operations and cargo handling procedures. These costs represent additional operational risks beyond base freight rates.
Regulatory Framework Implications
International maritime regulations continue evolving in response to environmental, safety, and security concerns. These regulatory changes interact with market dynamics to create additional complexity layers in shipping economics and operational requirements.
International Maritime Organization Developments
Environmental regulations affecting fleet efficiency create ongoing compliance costs and operational modifications. Fuel specification requirements, emissions controls, and energy efficiency standards influence vessel design, operations, and replacement cycles.
Safety protocol enhancements respond to security threats and operational risks demonstrated during crisis periods. The March 2026 events highlighted physical geography challenges where shipping lanes are 2 nautical miles wide each direction and vessels must turn at the narrowest point adjacent to Iranian islands.
Port state control implications affect vessel operations through enhanced inspection requirements and compliance verification procedures. These measures can create additional delays and costs during already constrained market conditions.
National Security and Trade Policy
Strategic petroleum reserve policies influence shipping demand through government purchasing and storage operations. Large-scale reserve movements can temporarily affect vessel availability and regional rate structures.
Naval convoy protection protocols create complex operational frameworks during security threats. Analysis suggests that US law does not allow the country's navy to escort ships that are not US-flagged or -owned, or have no US crew, creating legally constrained escort capabilities even when naval resources are available.
Long-Term Structural Evolution Patterns
Current market conditions may accelerate structural changes in global shipping patterns, fleet investment priorities, and supply chain design. Understanding these potential evolution pathways helps anticipate future market dynamics and investment opportunities.
Fleet Investment and Technology Trends
Newbuilding order book analysis reveals shipyard capacity constraints and delivery timeline extensions that limit near-term fleet expansion possibilities. Current crisis conditions may accelerate orders for modern, efficient vessels while encouraging scrapping of older, less efficient tonnage.
Technology adoption acceleration includes navigation systems, fuel efficiency improvements, and cargo handling automation. These technological advances help mitigate operational risks while reducing manning requirements and operating costs.
Alternative fuel transition timelines face acceleration from regulatory requirements and environmental objectives. However, the infrastructure requirements and technical challenges suggest gradual implementation rather than rapid transformation.
Trade Flow Rebalancing Scenarios
Crude oil sourcing diversification strategies emerge from shipping market disruptions as refineries seek to reduce dependence on vulnerable shipping routes. This diversification creates new trading patterns and regional supply relationships that may persist beyond immediate crisis periods.
Regional refining capacity adjustments respond to changing transportation economics and supply security concerns. Areas with constrained shipping access may invest in local refining capacity to reduce import dependence and shipping cost exposure.
Supply chain resilience investments encompass storage capacity, alternative transportation infrastructure, and backup supply arrangements. These defensive investments create additional costs during normal periods but provide valuable insurance during market disruptions.
The March 2026 crisis revealed approximately 12 million barrels of Mideast Gulf crude aboard tankers bound for India idling west of the Strait of Hormuz, demonstrating the scale of commodity value at risk during shipping disruptions. This experience likely influences future supply chain design decisions and inventory management strategies when very large crude carrier rates surge beyond sustainable levels.
Disclaimer: This analysis is based on market data and industry reports available at the time of writing. Shipping market conditions remain highly volatile and subject to rapid changes based on geopolitical, economic, and operational factors. Investors and market participants should conduct independent analysis and consider current market conditions before making decisions.
Ready to Capitalise on Commodity Market Volatility?
Discovery Alert's proprietary Discovery IQ model provides instant notifications on significant ASX mineral discoveries, empowering investors to identify actionable opportunities as shipping disruptions and geopolitical tensions reshape global commodity markets. Start your 14-day free trial today to gain real-time insights that could position you ahead of market-moving announcements in the resources sector.