June 21, 2026
The Hidden Value Problem in Pre-Production Mining Assets
Every preliminary economic assessment tells a story frozen in time. The price assumptions baked into a PEA at the moment of publication begin drifting away from reality the instant commodity markets move, and in volatile cycles like the one that has defined gold and copper since 2020, that drift can represent billions of dollars in unrecognised project value. For investors, analysts, and project evaluators working with static PDF documents, the challenge is not finding good assets, it is accurately pricing them under conditions that bear little resemblance to the spreadsheet assumptions used when the study was written.
This is the analytical challenge at the centre of understanding the Whistler project value at current gold and copper prices, specifically for the Whistler gold-copper project in Alaska's Skwentna region, owned by US GoldMining. At base-case PEA prices, Whistler is already a substantial development asset. At current market prices for gold and copper, the project's economics tell an entirely different, and significantly more compelling, story.
When big ASX news breaks, our subscribers know first
Why Gold-Copper Polymetallic Projects Carry Amplified Price Leverage
Single-commodity mining projects move with one price signal. A gold-only operation is exposed to gold; a copper mine tracks copper. Polymetallic systems like Whistler, however, carry compounded price sensitivity because two independently volatile commodities are both capable of simultaneously driving value uplift or compression.
Gold has functioned as a monetary hedge against fiscal uncertainty, currency debasement, and geopolitical risk, sustaining elevated price levels through a period of unprecedented central bank buying and institutional re-allocation toward hard assets. Furthermore, the gold price forecast for 2025 and beyond suggests continued upward momentum driven by these same structural forces. Copper, by contrast, is structurally tied to the global energy transition: electrification infrastructure, electric vehicle manufacturing, grid upgrades, and renewable energy deployment all require substantial copper inputs.
According to the International Energy Agency, demand for copper from clean energy applications alone is projected to roughly double by 2040 under accelerated transition scenarios. Consequently, the critical minerals energy transition narrative continues to underpin copper's long-term demand outlook in ways that distinguish it from historically cyclical base metals.
Projects with significant exposure to both metals therefore occupy a uniquely advantaged position in the current commodity environment, capturing upside from two demand regimes that are structurally independent of each other.
The Skwentna Region and Whistler's Geological Context
The Whistler project sits in Alaska's Skwentna region, a geologically prospective corridor that has attracted increasing attention as North American critical minerals exploration has intensified. The deposit is characterised by a large-tonnage, bulk-mineable porphyry system, the same geological architecture that underpins many of the world's largest copper-gold mines, including Grasberg in Indonesia and Cadia in Australia.
Porphyry copper-gold systems are significant because their value is driven by scale rather than exceptional grade. Indeed, this is analogous to a major copper system in Argentina that has similarly demonstrated the value of large-tonnage porphyry architecture. The Whistler resource demonstrates this characteristic clearly:
- Indicated resource: 294 million tonnes at 0.68 g/t gold-equivalent (AuEq)
- Inferred resource: 198 million tonnes at 0.65 g/t AuEq
- Combined resource base: Nearly 500 million tonnes of mineralised material
At these grades, the project is not a high-grade underground system. It is a large-tonnage open-pit or bulk underground target where economics are driven by throughput volume and commodity prices, which is precisely why price sensitivity analysis matters so profoundly for understanding its true value range.
Breaking Down the Whistler PEA Base-Case Economics
The preliminary economic assessment provides a foundation for understanding Whistler's economic structure. The base-case modelling uses the following assumptions:
| Metric | Base-Case Value |
|---|---|
| Gold Price | $3,200/oz |
| Copper Price | $9,920/t (~$4.50/lb) |
| Silver Price | $37.50/oz |
| After-Tax NPV (5% discount rate) | ~$2.0 billion |
| IRR | 32% |
| Payback Period | ~30 months |
| Life-of-Mine Revenue | ~$10.9 billion |
| Life-of-Mine EBITDA | ~$5.9 billion |
Several aspects of these metrics deserve closer examination.
A 32% IRR is a particularly meaningful figure for a large-scale greenfield project. Most institutional capital allocated to mining development requires hurdle rates in the range of 15% to 25%, meaning the base case alone already clears most investment committee thresholds. A 30-month payback period is relatively compressed for a project of this scale, suggesting that capital recovery risk — one of the most significant concerns in large greenfield development — is manageable even under conservative commodity assumptions.
The life-of-mine production profile that supports these economics includes:
- Over 2.6 million ounces of gold
- Approximately 600 million pounds of copper
- Nearly 6.6 million ounces of silver
- Total gold-equivalent production of roughly 3.6 million ounces across a 14-year mine life
The base case already reflects a substantial gold-copper development project. But the real analytical value emerges from stress-testing those assumptions across the full range of plausible commodity price environments, not just the single point-in-time scenario captured in the original study.
Whistler Project Value at Current Gold and Copper Prices: The Spot-Price Scenario
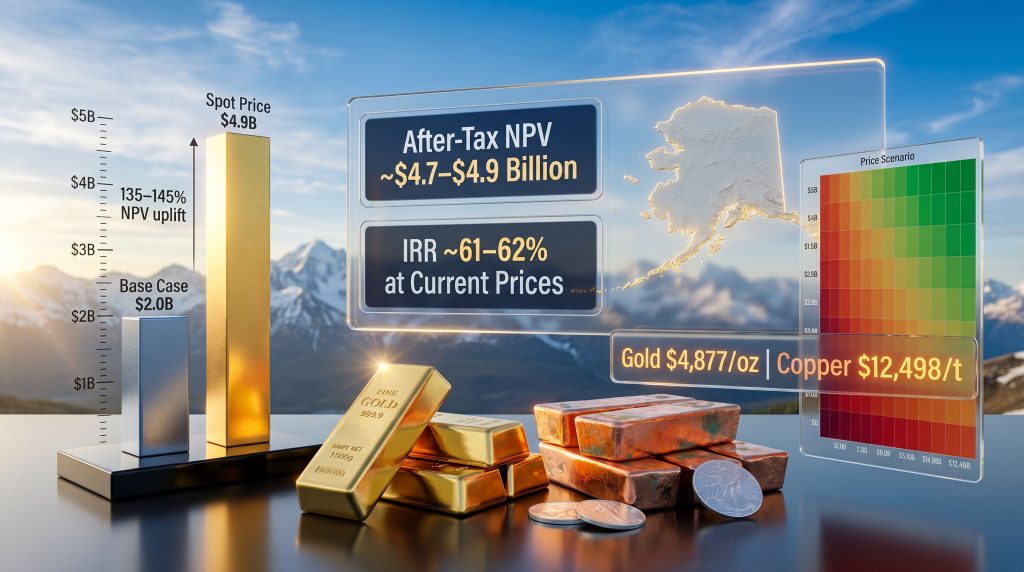
When independent modelling is applied using commodity prices reflective of conditions in early 2026, the Whistler project value at current gold and copper prices changes dramatically. Using gold at approximately $4,877/oz, copper at $12,498/t (~$5.65/lb), and silver at $74.92/oz, the project's value profile expands substantially:
| Metric | Current/Spot Price Scenario |
|---|---|
| Gold Price | $4,877–$5,000/oz |
| Copper Price | $12,498/t (~$5.65–$5.85/lb) |
| Silver Price | $70–$74.92/oz |
| After-Tax NPV (5% discount rate) | ~$4.7–$4.9 billion |
| IRR | ~61–62% |
| Payback Period | ~19 months |
| Life-of-Mine Revenue | ~$16.1 billion |
| Life-of-Mine EBITDA | ~$11.0 billion |
The scale of the uplift between the two scenarios is substantial across every key metric:
- NPV uplift: Approximately $2.7–$2.9 billion, representing a 135–145% increase over the base case
- IRR expansion: From 32% to approximately 61–62%, nearly doubling the project's return profile
- Payback compression: From ~30 months to ~19 months, reducing capital recovery risk by approximately 37%
- Revenue uplift: Life-of-mine revenues increase by approximately $5.2 billion
- EBITDA uplift: Life-of-mine earnings increase by approximately $5.1 billion
The EBITDA expansion is particularly instructive from an operating leverage perspective. Fixed capital costs remain largely predetermined and do not scale with commodity prices. Every additional dollar of revenue generated by higher gold and copper prices, above what is required to cover fixed and variable costs, flows through to margin at a disproportionately high rate.
This is the mechanical explanation for why life-of-mine EBITDA nearly doubles — from $5.9 billion to $11.0 billion — while revenues increase by a proportionally smaller amount. Moreover, favourable copper market trends in 2025 suggest that elevated copper prices may persist, further supporting the spot-price scenario's relevance.
Quantifying Price Sensitivity: How Each Variable Moves the Needle
Independent sensitivity analysis reveals that the Whistler project's NPV is highly responsive to commodity price assumptions, with gold and copper identified as the dominant external value drivers. The following table summarises NPV outcomes across a range of price factor adjustments from the base case:
| Price Factor Change | Approximate After-Tax NPV |
|---|---|
| -10% overall price factor | ~$1.44 billion |
| Base case (0% change) | ~$2.0 billion |
| +10% overall price factor | ~$2.59 billion |
Several important observations emerge from this data:
- A 10% price reduction destroys approximately $560 million in NPV relative to the base case
- A 10% price increase creates approximately $590 million in additional NPV
- The full NPV range across a modest 20% price swing exceeds $1.1 billion, underlining the project's price sensitivity
- The asymmetry between the upside and downside impact reflects operating leverage in action, where higher margins at elevated prices produce proportionally greater NPV gains
Importantly, heatmap analysis across a broad matrix of price and operating-cost combinations indicates that the Whistler project maintains meaningfully positive economics under a wide range of scenarios. This suggests the project carries structural resilience rather than narrow economic viability confined to optimistic assumptions.
Operating Costs as a Secondary Value Lever
While commodity prices dominate the sensitivity profile, operating cost discipline emerges as a critical secondary driver, particularly in downside scenarios. When prices compress, the ability to manage processing costs, labour inputs, and reagent consumption becomes the difference between a project that retains value and one that deteriorates rapidly.
For porphyry systems like Whistler, operating costs are strongly influenced by:
- Ore grade continuity at depth and across ore domains, which affects processing throughput efficiency
- Strip ratio management in open-pit scenarios, where waste-to-ore ratios directly affect mining costs per tonne processed
- Energy costs, which are particularly material in remote Alaskan operations where power supply infrastructure is a significant cost component
- Metallurgical recovery rates for both gold and copper, which determine how much payable metal is extracted per tonne of ore processed
Each of these factors can materially influence the project's position on the cost curve, and by extension, its resilience under lower commodity price environments.
A Multi-Scenario Valuation Summary
| Scenario | Gold Price | Copper Price | After-Tax NPV | IRR | Payback |
|---|---|---|---|---|---|
| Base Case | $3,200/oz | ~$4.50/lb | ~$2.0B | 32% | ~30 months |
| Current Market Prices | $4,877–$5,000/oz | ~$5.65–$5.85/lb | ~$4.7–$4.9B | ~61–62% | ~19 months |
| Downside Stress (-10%) | ~$2,880/oz | ~$4.05/lb | ~$1.44B | Compressed | Extended |
| Upside Scenario (+10%) | ~$3,520/oz | ~$4.95/lb | ~$2.59B | Expanded | Compressed |
The wide NPV range — spanning from approximately $1.44 billion in a mild downside scenario to nearly $4.9 billion at current market prices — reflects a reality that static PEA reporting is structurally incapable of capturing. Project economics exist on a continuous spectrum tied to commodity markets, and any single-scenario estimate provides only a partial picture of the asset's true value distribution.
The next major ASX story will hit our subscribers first
Why Static PEA Reporting Systematically Understates Value in Rising Markets
Preliminary economic assessments serve a necessary function in mining project development. They provide a structured, audited snapshot of project economics at a defined point in time using declared price assumptions. The problem is not the methodology itself but the tendency for investors and analysts to treat static documents as permanent representations of project value rather than time-stamped estimates.
In a period where gold prices have moved from below $1,800/oz in early 2022 to above $4,800/oz in 2025, and copper has similarly advanced through multiple cycle highs, the gap between a PEA's base-case price deck and prevailing market conditions can represent billions of dollars in unrecognised value for large-scale projects.
The evolution toward dynamic, interactive mining valuation platforms represents a structural improvement in how pre-production mining assets are analysed and communicated to investors. The ability to interrogate project economics across multiple price and cost scenarios provides a more complete picture of risk and upside than any single static document.
The limitations of point-in-time valuation are particularly acute for polymetallic projects because two or more commodities must simultaneously be evaluated, and the compounding effect of concurrent price changes in gold, copper, and silver is not captured by examining each variable in isolation.
AI-First Valuation Platforms and the Democratisation of Mining Analysis
The analytical gap created by static reporting has driven the emergence of AI-assisted, dynamic valuation platforms capable of processing machine-readable data from public technical reports and restructuring it into interactive scenario models. These tools enable users to:
- Adjust individual commodity price inputs and observe real-time changes to NPV, IRR, and payback metrics
- Run sensitivity heatmaps across multiple price and cost combinations simultaneously
- Benchmark individual projects against peers using consistent analytical frameworks
- Screen development assets more efficiently than traditional static document review allows
This capability was previously confined to the research departments of major investment banks and mining majors. Its broader availability represents a meaningful shift in how sophisticated project analysis is conducted across the investor spectrum.
What the Whistler Economics Mean for Different Stakeholders
For development-stage investors:
- The base case provides a credible floor valuation with institutional-grade return metrics
- Current price assumptions suggest the project could be worth more than double its base-case NPV
- Price sensitivity is a feature of polymetallic leverage, not a structural flaw, and provides significant upside optionality in a rising commodity environment
For institutional analysts and project evaluators:
- The wide NPV range across plausible scenarios underscores the importance of price assumption transparency in any valuation exercise
- An IRR of approximately 61–62% at current prices comfortably exceeds most large greenfield project hurdle rates, supporting a development decision under current market conditions
- The compressed payback period of ~19 months at current prices substantially reduces the duration risk associated with capital recovery
For regional and resource sector stakeholders:
- Higher commodity prices translate directly into improved royalty revenue outcomes and enhanced economic activity across the Skwentna region
- The project's economic viability across multiple price scenarios provides confidence in long-term development commitment
North American Critical Minerals Context and Whistler's Strategic Positioning
Alaska's established mining regulatory framework, combined with growing policy emphasis on domestic critical minerals supply chains, provides a favourable backdrop for large-scale copper-gold development in stable jurisdictions. In addition, US critical minerals policy under recent executive orders has further elevated the strategic importance of domestically sourced copper and gold assets.
Copper's classification as a critical mineral in both US and Canadian policy frameworks reflects its centrality to electrification and grid infrastructure buildout, creating a demand narrative that is structurally distinct from the cyclical dynamics that historically governed base metals markets. The Whistler gold-copper project has attracted considerable market attention precisely because it sits at the intersection of these converging structural tailwinds.
At approximately $4.7–$4.9 billion in NPV under current price assumptions, the Whistler project value at current gold and copper prices ranks among the more significant undeveloped gold-copper assets globally by estimated value. Comparable large-scale undeveloped porphyry systems have attracted substantial merger and acquisition interest in recent years, providing an external reference point for evaluating how the market might ultimately price the Whistler asset as it advances through the development sequence.
Disclaimer: This article is intended for informational and educational purposes only. It does not constitute financial advice, an investment recommendation, or a solicitation to buy or sell any security. All NPV, IRR, payback, and revenue figures referenced are derived from independent modelling based on publicly available technical information and should not be relied upon as definitive valuations. Commodity prices are volatile and can move materially in either direction. Readers should conduct their own due diligence and consult a qualified financial adviser before making any investment decisions. Forward-looking statements and scenario projections involve assumptions that may not be realised.
Want to Capitalise on the Next Major Gold-Copper Discovery Before the Market Catches On?
Discovery Alert's proprietary Discovery IQ model delivers real-time alerts on significant ASX mineral discoveries, instantly transforming complex commodity data into actionable investment insights for both short-term traders and long-term investors. Explore how historic mineral discoveries have generated substantial returns on Discovery Alert's dedicated discoveries page, and begin your 14-day free trial today to position yourself ahead of the broader market.