July 28, 2026
The Operating Leverage Case for Dual-Commodity Coal Producers
When commodity cycles turn, the companies that emerge strongest are rarely those that simply rode higher prices. More often, they are businesses that used the preceding years to build operational precision, compress cost structures, and diversify revenue exposure. In the coal sector, this dynamic plays out across production efficiency, mine sequencing, and the critical distinction between managed and equity volumes. Understanding these mechanics is essential before evaluating any quarterly update from a large-scale producer.
Whitehaven Coal FY26 production and cost guidance outcomes, released ahead of the company's formal full-year financial results scheduled for August 2026, illustrate exactly this pattern. The headline numbers tell one story. The mechanics underneath tell a more instructive one.
When big ASX news breaks, our subscribers know first
FY26 Production: What the Numbers Actually Mean
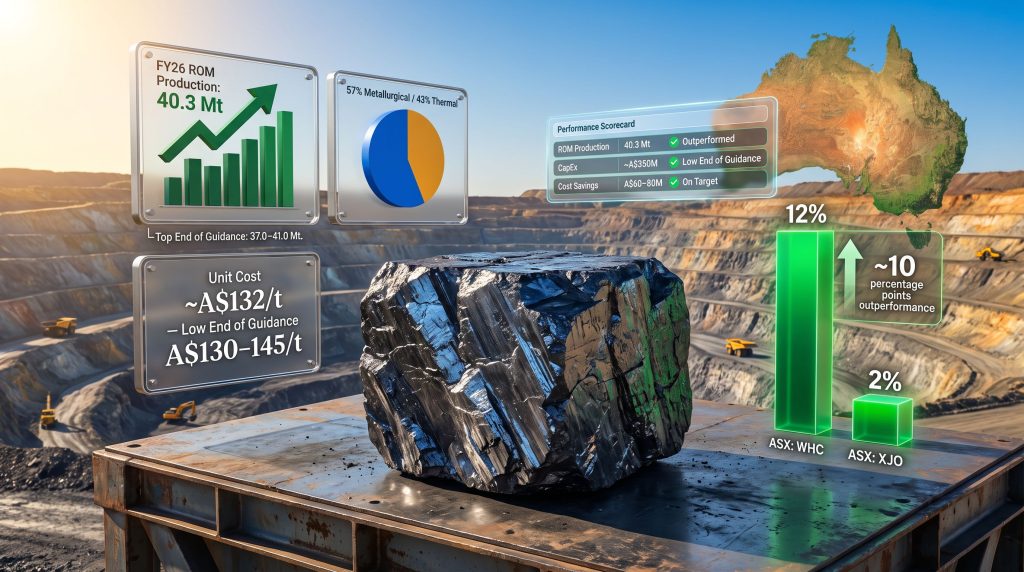
Managed run-of-mine (ROM) coal production for FY26 reached 40.3 million tonnes (Mt), a 3% increase on FY25 and a result positioned firmly at the top end of the guided range of 37.0 to 41.0 Mt. To put this in context, the implied FY25 base is approximately 39.1 Mt, meaning the production increment was roughly 1.2 Mt year-on-year. At an indicative realised price, even a modest per-tonne margin on incremental volume contributes meaningfully to earnings.
It is important to understand the distinction between managed production and equity production. Managed ROM refers to total coal extracted across operations that Whitehaven manages, including partners' shares in joint ventures. Equity sales, on the other hand, represent only Whitehaven's attributable share of production sold. For FY26, equity sales of produced coal were recorded at 26.0 Mt, a figure that is not directly comparable to the managed sales guidance range of 29.5 to 33.0 Mt, which covers a different scope of volumes.
| Metric | FY26 Guidance Range | FY26 Actual Result | Guidance Position |
|---|---|---|---|
| Managed ROM Coal Production | 37.0–41.0 Mt | 40.3 Mt | Top end of range |
| Managed Coal Sales | 29.5–33.0 Mt | 26.0 Mt (equity sales) | Different scope |
| Unit Cost of Coal (excl. royalties) | A$130–145/t | ~A$132/t | Low end of range |
| Capital Expenditure | A$340–440 million | ~A$350 million | Low end of range |
| Annualised Cost Savings | A$60–80 million | Delivered within range | On target |
Key Distinction: Investors comparing equity sales to the managed sales guidance range should be cautious. These metrics measure different things. The 40.3 Mt ROM result is the most directly comparable figure for production guidance purposes.
How Queensland and New South Wales Performed Differently
Queensland: A Sharp Second-Half Recovery
The Queensland portfolio, anchored by the Daunia and Blackwater metallurgical coal mines acquired from BHP Mitsubishi Alliance (BMA), was the standout operational story of the June quarter. ROM production across Queensland jumped 41% quarter-on-quarter, recovering strongly from weather-related disruptions that had affected earlier quarters in FY26. Furthermore, the March 2026 quarterly report had already signalled improving operational momentum ahead of this recovery.
This kind of quarterly swing is not unusual in open-cut coal mining in Queensland's Bowen Basin, where cyclonic weather events and flooding can temporarily interrupt strip mining sequences. What matters for long-term investors is whether the underlying mine plan and equipment availability allow for rapid catch-up production once conditions normalise. The 41% quarterly recovery suggests that mine scheduling and equipment utilisation in the Queensland operations are functioning as intended under Whitehaven's management framework.
June quarter equity sales reached 6.3 Mt, and full-year Queensland production and sales outcomes finished at the top end of guidance. This is notable given that Queensland operations were still being integrated into Whitehaven's operational systems during the period.
New South Wales: Steady Organic Growth
The New South Wales operations, which form the core of Whitehaven's thermal coal base, delivered a 6% year-on-year increase in full-year ROM output. NSW production and sales also landed at the top end of guidance for the region, maintaining a track record of operational consistency that predates the Queensland acquisitions.
The NSW assets provide geographic diversification, different weather exposure, and a different product profile. While Queensland drives the metallurgical weighting, NSW provides the energy coal foundation that serves Asian power generation markets.
The Revenue Mix Debate: Why 57/43 Is More Than a Statistic
FY26 revenue was split 57% metallurgical coal and 43% thermal coal. This ratio reflects the deliberate strategic repositioning that followed the Daunia and Blackwater acquisitions. Before those transactions, Whitehaven was predominantly a thermal coal producer. The acquisitions fundamentally reweighted the portfolio toward higher-margin steelmaking coal. In this context, BHP's coal strategy provides a useful industry comparison for understanding how major producers are repositioning their metallurgical coal assets.
| Coal Type | FY26 Revenue Share | Primary End Market | Key Demand Driver |
|---|---|---|---|
| Metallurgical (Coking) Coal | 57% | Global steel production | Infrastructure, construction, manufacturing |
| Thermal Coal | 43% | Power generation | Asian energy security |
Metallurgical coal commands a significant price premium over thermal coal in most market conditions because it cannot be easily substituted in the blast furnace steelmaking process. Hard coking coal, the highest quality category, requires very specific properties including low sulphur content, low ash yield, and particular caking and fluidity characteristics that allow it to form coke capable of supporting the weight of iron ore inside a blast furnace. Not all coal classified as metallurgical meets hard coking coal specifications; the Daunia and Blackwater mines produce a range of product qualities across the coking coal spectrum.
The 43% thermal coal contribution ensures that revenue is not entirely exposed to steel production cycles. In periods when global manufacturing activity slows and metallurgical coal demand softens, thermal coal demand from Asian power generators can partially offset the impact. However, tracking metallurgical coal prices remains essential for understanding the earnings sensitivity of this portfolio weighting.
Cost Discipline: Understanding the Mechanics Behind A$132/t
What Unit Cost Actually Captures
The unit cost of coal production, reported at approximately A$132 per tonne excluding royalties, covers mine operating costs including labour, explosives, fuel, maintenance, and contractors, but excludes the royalties paid to state governments on coal extracted. Royalties are a significant and variable cost component in both Queensland and New South Wales, calculated as a percentage of coal revenue, meaning they move directly with prices rather than being a controllable operational expense. Their exclusion from unit cost guidance allows management to benchmark operational efficiency independently of commodity price movements.
Against a guidance midpoint of approximately A$137.50/t, the achieved A$132/t represents an outperformance of roughly A$5.50/t. Applied across the 40.3 Mt of ROM production as an illustrative approximation, this differential suggests a potential aggregate cost advantage of around A$221 million versus the guidance midpoint. This should be understood as an indicative calculation rather than an official company figure, since ROM tonnage differs from saleable tonnage and costs are allocated on a per-saleable-tonne basis.
How H1 Performance Fed Into the Full-Year Result
The half-year FY26 results provide important context for how H1 performance set the stage for the full-year cost outcome.
| Period | Unit Cost (A$/t) | Guidance Range | Position Within Range |
|---|---|---|---|
| H1 FY26 | A$135/t | A$130–145/t | Lower half |
| Full Year FY26 | ~A$132/t | A$130–145/t | Low end |
The improvement from A$135/t at the half-year mark to A$132/t for the full year reflects the operational leverage effect of the Queensland production recovery. As Queensland volumes surged in the June quarter, fixed costs were spread across a higher tonnage base, reducing the cost per tonne arithmetically. This is a well-understood phenomenon in mining operations, often described as fixed cost dilution, and it explains why production recovery in the second half translated directly into cost improvement rather than simply higher output at constant costs.
The annualised cost savings program of A$60 to A$80 million was delivered as planned. While the company has not publicly disaggregated these savings by category, they likely encompass procurement efficiencies, contractor renegotiations, and overhead rationalisation following the integration of the acquired Queensland assets.
Operational Leverage Insight: In mining, when fixed costs remain largely stable while throughput increases, each additional tonne of production effectively carries a lower cost burden. This is why production recovery in the June quarter did not just fix the volume shortfall; it actively improved the full-year unit cost outcome.
Balance Sheet Navigation: Managing Debt Alongside Growth
Net Debt and the BMA Payment Schedule
Net debt at 30 June 2026 stood at A$1.3 billion, following the settlement of the second US$500 million deferred acquisition payment to BMA during the June quarter. This is a significant cash outflow that investors need to contextualise against the scale of the Daunia and Blackwater asset base and its contribution to EBITDA generation.
The deferred payment structure, common in large-scale mining acquisitions, allows acquirers to manage immediate cash impact while deferring portions of the purchase consideration to future periods. The trade-off is that cash flow in the periods when payments fall due is partially redirected away from dividends, buybacks, and organic investment.
Further milestone payments remain scheduled for FY27, with the final deferred and contingent consideration due by mid-2027. The contingent component typically varies with commodity prices or production volumes during a reference period, meaning the exact FY27 cash outflow may differ from the fixed deferred amounts already settled. Consequently, the relationship between commodity prices and miners will be particularly relevant to monitoring Whitehaven's contingent payment obligations.
Refinancing: What US$900 Million in Notes Achieves
Whitehaven completed a refinancing of its debt facilities during the quarter, issuing US$900 million in notes. This single transaction accomplished three distinct objectives simultaneously:
- Reduced the cost of debt by replacing existing facilities with notes priced at current market conditions
- Diversified funding sources by accessing capital markets investors beyond traditional bank lending relationships
- Extended debt maturity profiles to reduce the concentration of near-term refinancing obligations
Accessing the US dollar notes market is a meaningful step for an Australian coal producer. It signals sufficient scale and credit quality to attract institutional fixed-income investors globally, and it reduces reliance on the domestic bank market, which can impose more restrictive covenants on resource sector borrowers.
Share Buyback Program: Capital Returns Under Constraint
Despite managing significant acquisition-related cash outflows, Whitehaven repurchased 10.1 million shares at a total cost of A$77 million during FY26. The average implied buyback price is approximately A$7.62 per share, calculated from these figures, though the company executed purchases across the year at varying prices.
Buyback programs in the context of net debt require careful interpretation. They signal management confidence in future cash generation, but they also mean capital is being deployed for share count reduction at a time when debt remains elevated. Whether this represents optimal capital allocation depends on the company's view of its own intrinsic value relative to prevailing market prices.
Investor Watch: The coexistence of active buybacks and rising net debt is not inherently contradictory in resource companies with strong operating cash flows. However, it means investors should monitor the trajectory of net debt closely as FY27 acquisition payments fall due.
The next major ASX story will hit our subscribers first
Share Price Context and Market Outperformance
Over the 12 months to July 2026, Whitehaven Coal (ASX: WHC) shares appreciated approximately 12%, compared to a 2% return from the S&P/ASX 200 Index (ASX: XJO) over the same period. This 10-percentage-point outperformance relative to the benchmark reflects market recognition of the company's production growth, cost discipline, and strategic repositioning toward metallurgical coal.
Resource sector outperformance relative to broad indices tends to attract momentum-driven capital flows, which can amplify price moves in both directions. Investors should be cautious about extrapolating recent share price performance into future returns, particularly given the pending FY27 acquisition payments and the inherent sensitivity of coal earnings to international benchmark prices.
What FY27 Guidance Is Expected to Reveal
Formal FY27 production and unit cost guidance will be released alongside the full-year FY26 financial results in August 2026. The key variables that will shape FY27 guidance include:
- The production ramp profile across Queensland operations as integration matures
- The cost base trajectory following completion of the annualised savings programme
- Capital expenditure requirements for sustaining and development activities across the portfolio
- The quantum of remaining BMA acquisition payments and their timing within FY27
| Catalyst | Expected Timing | Potential Impact |
|---|---|---|
| Full-year FY26 financial results | August 2026 | Revenue, EBITDA, and dividend clarity |
| FY27 production and cost guidance | August 2026 | Operational outlook reset |
| Remaining BMA acquisition payments | By mid-2027 | Balance sheet and cash flow implications |
| Metallurgical coal price movements | Ongoing | Revenue and margin sensitivity |
| Thermal coal demand from Asia | Ongoing | Thermal revenue sustainability |
Management has indicated that underlying market conditions for both metallurgical and thermal coal remain constructive, and that long-term demand from Asian steel producers and power generators continues to support the dual-commodity strategy. Notably, global steel demand from key markets such as India remains a central driver of the metallurgical coal outlook for producers like Whitehaven. This framing is consistent with the prevailing trajectory of Asian steel consumption and the structural role of coal-fired power in the energy mix of developing economies in the region, though commodity markets remain inherently unpredictable.
FY26 Operational Scorecard: A Summary Assessment
| Performance Dimension | Outcome | Assessment |
|---|---|---|
| ROM Production (40.3 Mt) | Top end of guidance | Outperformed |
| Unit Cost (~A$132/t) | Low end of guidance | Outperformed |
| Capital Expenditure (~A$350M) | Low end of guidance | Outperformed |
| Cost Savings (A$60–80M) | Delivered within range | On target |
| Revenue Mix (57% met / 43% thermal) | Met strategic intent | On target |
| Debt Refinancing | Completed | Balance sheet strengthened |
| Share Buyback (10.1M shares, A$77M) | Active program | Progressing |
The convergence of above-midpoint production and below-midpoint costs within the same reporting period is relatively uncommon in large-scale open-cut mining, where weather, equipment availability, and mine sequencing frequently create trade-offs between volume and cost outcomes. That Whitehaven Coal FY26 production and cost guidance outcomes delivered both simultaneously — while also managing a major debt refinancing and a US$500 million acquisition payment — represents a materially positive operational signal heading into the August results.
This article is general in nature and does not constitute financial advice. Past performance is not indicative of future results. Investments in resource companies carry significant risks including commodity price volatility, operational disruption, and balance sheet exposure. Readers should consider their own financial circumstances and consult a licensed financial adviser before making investment decisions. All financial figures referenced are sourced from Whitehaven Coal's June 2026 Quarterly Report as reported via the ASX platform.
Want to Catch the Next Major ASX Resource Discovery Before the Market Does?
Discovery Alert's proprietary Discovery IQ model delivers real-time alerts on significant ASX mineral discoveries, transforming complex resource data into actionable investment insights for both short-term traders and long-term investors — explore historic discoveries and their returns to understand the potential scale of opportunity, then begin your 14-day free trial at Discovery Alert to position yourself ahead of the broader market.