June 5, 2026
The Inventory Buffer That Markets Built: Understanding Why Oil Refuses to Break $100
Supply disruptions in global energy markets have historically triggered sharp, almost reflexive price responses. The 1973 Arab oil embargo sent prices soaring by roughly 300 percent. The Iranian Revolution of 1979 produced a 150 percent price surge from a supply loss of comparable scale. Yet in 2026, the world is experiencing what analysts at Macquarie Group have described as the largest single reduction in global oil supply ever recorded, and front-month Brent crude is trading below $100 per barrel. Understanding why is oil still under $100 requires looking not at what is missing from the market, but at what was already sitting in it before the disruption began.
When big ASX news breaks, our subscribers know first
The $100 Threshold: More Than Just a Round Number
The $100 per barrel level carries outsized psychological weight in oil markets that extends well beyond its numerical significance. For traders, it functions as a resistance ceiling where technical selling pressure intensifies. For policymakers, it represents the approximate threshold at which consumer economies begin experiencing measurable inflation and demand destruction. For producers, it signals a price environment where virtually every known reserve becomes economically viable to develop.
Contextualising current prices requires historical grounding. Brent crude reached an inflation-adjusted peak of approximately $200 per barrel in 2008, a level driven primarily by a demand surge rather than a supply collapse. Today's front-month Brent, sitting roughly one-third above its pre-conflict level, remains half that real-terms peak despite a supply disruption that dwarfs anything in recorded history. That comparison alone raises a fundamental question about what is actually happening beneath the surface of oil price formation. For broader context on how prices move in volatile conditions, the oil price volatility guide provides a useful reference point.
Physical vs. Paper: Why Brent Benchmarks Are Telling Different Stories
A meaningful divergence has emerged between the physical crude market and futures pricing, and that gap is itself a market signal worth understanding. Dated Brent, which reflects the price of physical crude for near-term delivery, has been trading at a significant premium to Brent futures throughout much of the conflict period.
According to BMI analysts at Fitch Solutions, Dated Brent averaged approximately $120 per barrel in April 2026, before slipping to around $110 per barrel through May, while futures-based forecasts for full-year 2026 sit considerably lower. The current crude market overview illustrates just how pronounced this divergence has become.
The current BMI forecasts reflect this divergence clearly:
| Benchmark | 2026 Forecast | 2027 Forecast |
|---|---|---|
| Dated Brent (physical) | $88/bbl | $72.50/bbl |
| Brent Futures | $81.50/bbl | $72.00/bbl |
When physical crude consistently trades at a premium to futures, it typically signals that near-term tightness is more acute than forward markets are pricing. Futures markets reflect probability-weighted outcomes, meaning they assign significant weight to a resolution scenario. Physical markets reflect what buyers must actually pay today to secure barrels. That spread is a live tension worth monitoring closely.
The Strait of Hormuz: Scale of Disruption in Historical Context
The Strait of Hormuz handles approximately 20 percent of global oil supply under normal conditions, making it the single most consequential maritime chokepoint in the energy system. Its effective closure for three months as of early June 2026 has reduced daily global oil supply by an estimated 14 percent, according to Macquarie Group economists. To appreciate the scale of that figure, consider how it compares to every major disruption the market has previously absorbed:
| Disruption Event | Supply Loss | Duration | Peak Price Response |
|---|---|---|---|
| 1973 Arab Oil Embargo | ~5 mb/d | ~5 months | +300% |
| 1979 Iranian Revolution | ~5.6 mb/d | ~12 months | +150% |
| 1990 Gulf War | ~4.3 mb/d | ~7 months | +90% |
| 2011 Libya Conflict | ~1.6 mb/d | Several months | +25% |
| 2022 Russia-Ukraine | ~3 mb/d risk | Ongoing | ~+50% briefly |
| 2026 Hormuz Closure | ~14% global supply | 3+ months ongoing | ~+33% above pre-conflict |
The price response to the 2026 closure is strikingly subdued relative to every historical precedent. A disruption roughly two to three times the scale of prior shocks has produced a price increase of only one-third. That paradox has a specific and instructive explanation.
How Elevated Inventories Became the Market's Shock Absorber
Before the conflict began, global oil inventories were sitting at levels the International Energy Agency characterised as representing untenable surpluses. That phrase, drawn directly from IEA reporting, is significant because it describes not merely adequate stockpiles but an excess that was itself a market problem prior to the supply shock. When the disruption struck, those surpluses became the most valuable asset in the market's structural toolkit.
Macquarie Group economists, led by Chief Economist and Head of Macro Strategy Ric Deverell, framed the situation succinctly in a note circulated in early June 2026: the muted price reaction was primarily a function of the oversupply seen before the war. Large pre-war inventories have meant the world has mostly avoided physical oil and product shortages, despite experiencing the largest supply reduction in recorded history.
This inventory buffer has functioned as a physical bridge between the disruption and end-user demand, allowing refineries to continue operating and consumers to continue accessing fuel without experiencing the acute shortages that historically drive price spikes. However, that bridge is finite.
The Drawdown Clock: Tracking the Inventory Runway
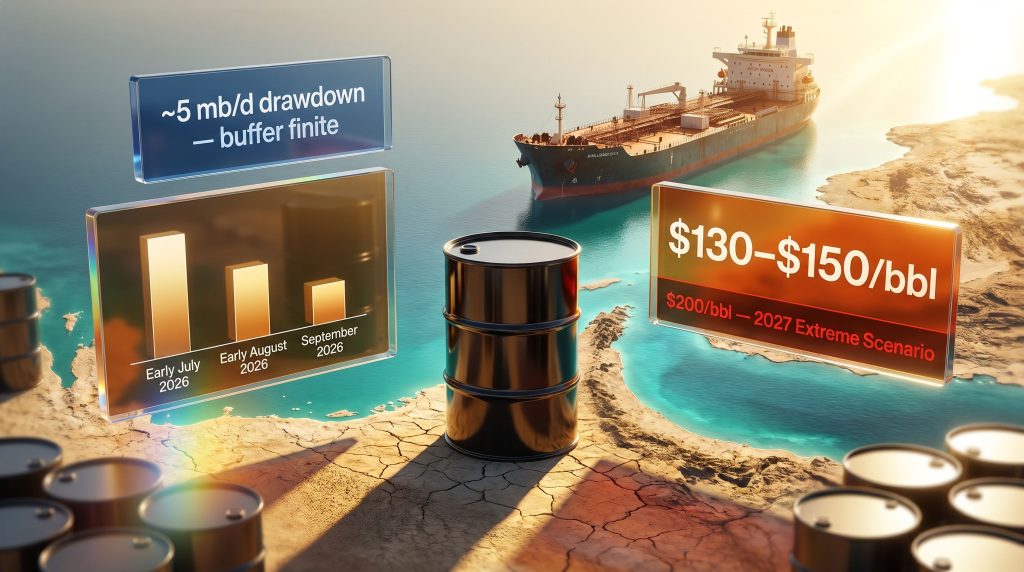
Global inventories have been drawing at approximately 5 million barrels per day over the past month. That rate of depletion creates a measurable timeline against which the market's stability can be assessed. According to Macquarie Group's analysis, the following milestones emerge from projecting current drawdown rates forward:
| Projected Inventory Milestone | Estimated Timing |
|---|---|
| Return to 2025 inventory lows | Early July 2026 |
| Approaching 2022 trough levels | Early August 2026 |
| Below the full range seen this decade | September 2026 |
Commercial crude stocks have been partially cushioned by concurrent draws from Strategic Petroleum Reserves and refined product inventories, moderating the rate at which raw crude figures deteriorate. Furthermore, strategic reserves are themselves finite, and governments face political and logistical constraints on how aggressively they can deploy emergency stockpiles.
The critical structural inflection point in this analysis is Labour Day, September 7, 2026. If the Strait of Hormuz remains closed at that date, the physical availability of crude is projected to tighten materially, removing the primary mechanism that has kept prices below $100.
Three Scenarios: How Oil Prices Could Move From Here
The range of potential outcomes from this point forward is unusually wide, reflecting genuine uncertainty about the geopolitical timeline. Macquarie Group and BMI analysts have outlined scenarios that span from a sharp price decline to a return to 2008's real-terms peak.
Scenario 1: Strait Reopens Before End of Q2 2026
BMI analysts maintain forecasts built around an assumption that a deal is reached in mid-to-late June 2026, enabling broad normalisation of Iranian production and trade flows across the second half of the year. Under this scenario, Dated Brent is forecast at $88/bbl for full-year 2026 and $72.50/bbl for 2027.
The downward revision from a prior $90/bbl 2026 forecast reflects weaker-than-expected price performance through May, when Dated Brent averaged approximately $110/bbl against an April average of $120/bbl. Ongoing trade war oil impact has further complicated the demand-side outlook under this resolution scenario.
Scenario 2: Strait Remains Closed Through Labor Day
If the closure persists into September, Macquarie Group economists project front-month Brent could reach $130 to $150 per barrel. At this level, inventory buffers would be exhausted, physical shortages would emerge across importing regions, and demand destruction would become a significant secondary factor. Analysts at the Financial Times have similarly flagged this threshold as the point at which consumer economies would face severe inflationary pressure.
Scenario 3: Conflict Extends Into 2027
Should the disruption persist through 2027, Macquarie Group's analysis suggests prices of approximately $200 per barrel may be required to balance global supply and demand. This would represent a return to the real-terms peak last seen in 2008, with macroeconomic consequences that would extend well beyond the energy sector.
Why Futures Markets Keep Pricing in a Resolution
One of the more counterintuitive dynamics in the current market is the persistent gap between physical crude tightness and futures market sentiment. The answer lies in how futures markets function structurally. They price probability-weighted outcomes, not current physical reality. When traders assign high probability to a near-term diplomatic resolution, futures prices compress even while physical crude remains genuinely tight.
BMI analysts noted that throughout the conflict, each emergent rally has been repeatedly derailed by signs of progress in negotiations. Postponements of renewed U.S. military activity against Iran and visible movement in U.S.-Iran peace talks have each triggered selling pressure that capped price rallies before they could establish momentum.
Despite repeated delays to any formal agreement and fractures in ceasefire arrangements, Dated Brent has continued drifting downward, reaching approximately $98 per barrel at the time of BMI's analysis. This pattern reveals what analysts describe as investor pricing of optimistic expectations for both a peace deal and a post-conflict recovery period — expectations being validated by neither a concluded agreement nor a tightening physical market. This divergence between sentiment-driven futures and fundamentals-driven physical pricing is, in effect, the market's central tension right now.
Demand Destruction as a Self-Limiting Mechanism
Elevated oil prices carry their own corrective mechanism, and that mechanism is already visible in Asian refining data. BMI analysts reported that refinery run rates across Asia have been severely depressed and crude imports have contracted sharply, loosening apparent market fundamentals even as supply remains disrupted.
This demand-side contraction has reduced the net effective supply deficit, providing additional support for the inventory buffer's longevity. Asian refiners, facing both elevated crude acquisition costs and logistics disruptions from Persian Gulf routing, have responded by reducing throughput rather than absorbing margin compression. That behavioural response has, paradoxically, helped keep prices lower than pure supply arithmetic would suggest.
The next major ASX story will hit our subscribers first
The Spare Capacity Question and U.S. Shale's Structural Limitations
A natural question in any major supply disruption is whether OPEC+ spare capacity can provide meaningful offset. In this instance, the answer is largely constrained by geography. Much of the declared spare capacity within the OPEC+ framework sits within the Persian Gulf region, meaning it is itself affected by the same conflict that closed the Strait. The broader OPEC market influence on global pricing remains significant, but geography has severely limited its effectiveness in this particular disruption.
U.S. shale production, often cited as a structural price ceiling for oil markets, faces a different limitation: time lag. The ongoing US shale slowdown has further constrained the sector's ability to respond rapidly. Shale responds to price signals with a 6 to 12 month development and production lag, meaning it functions as a medium-term price moderator rather than a short-term supply solution for a disruption of this magnitude.
What Makes the 2026 Situation Structurally Unique
Every previous oil price shock occurred against a backdrop of relatively balanced or tight inventories entering the disruption. The current situation is different in a specific and historically unprecedented way: the largest supply disruption ever recorded arrived into a market carrying the largest pre-existing inventory surplus in recent memory.
Three compounding factors distinguish this environment from prior shocks:
- Pre-war IEA-documented surpluses created an unusually deep inventory cushion that prior disruptions lacked
- Simultaneous demand weakness in Asian refining has reduced the net effective supply deficit below what gross supply numbers suggest
- Persistent diplomatic activity has repeatedly suppressed futures market risk premiums before any deal has actually been concluded
The interaction between these three factors explains why is oil still under $100 despite a supply shock that, by any historical comparison, should have produced dramatically higher prices. It also explains why the situation remains genuinely precarious: each of these three moderating factors is temporary and eroding.
The Variables That Will Determine What Comes Next
For investors and analysts tracking this situation, the following indicators represent the most consequential data points to monitor in the weeks ahead:
- Weekly inventory drawdown figures, which function as the leading indicator of how quickly the buffer is being consumed
- Progress in U.S.-Iran negotiations, where any credible movement toward a formal agreement could trigger sharp futures market declines
- Asian refinery run rate data, as any recovery in throughput would signal tightening physical demand and accelerate inventory depletion
- SPR release announcements from IEA member governments, which influence the pace of commercial inventory draws
- The September 7 Labour Day deadline, which Macquarie Group has identified as the structural inflection point at which physical market tightness becomes materially acute
Furthermore, Brent crude supply analysis from Investing.com reinforces the view that relief options remain limited, adding weight to the case that why is oil still under $100 may become an increasingly difficult question to answer as inventories continue drawing down.
The core insight embedded in all of this analysis is that oil is not under $100 because the supply shock is modest. It is historically enormous. Oil remains below $100 because the world entered this crisis with an unusually large buffer, and that buffer is being consumed at a measurable, trackable rate. The clock is running.
Disclaimer: This article contains forward-looking projections and scenario analyses sourced from Macquarie Group and BMI/Fitch Solutions research notes. These projections are subject to significant uncertainty and should not be interpreted as investment advice. Oil price forecasts are inherently speculative and dependent on geopolitical outcomes that cannot be reliably predicted. Readers should conduct independent research before making any investment or commercial decisions.
Want to Capitalise on the Next Major Commodity Discovery Before the Market Does?
While oil markets navigate geopolitical disruption and inventory drawdowns, significant commodity discoveries on the ASX continue to create actionable investment opportunities — and Discovery Alert's proprietary Discovery IQ model delivers real-time alerts the moment they are announced, turning complex data across 30-plus commodities into clear, actionable insights. Explore historic examples of major mineral discoveries and their market returns, then begin your 14-day free trial to ensure you are positioned ahead of the broader market.