May 20, 2026
When a Single Waterway Holds the Global Economy Hostage
The global energy system was never designed with resilience in mind. Decades of infrastructure investment followed the path of least resistance, concentrating export capacity into a handful of geographic chokepoints that now represent structural vulnerabilities of the highest order. The World Bank energy prices forecast due to Middle East war, released in April 2026, makes this reality impossible to ignore. When those chokepoints come under sustained pressure, the consequences do not stay regional — they travel, compound, and eventually reshape the economic conditions facing billions of people.
The 2026 disruption to shipping through the Strait of Hormuz has forced a reckoning with exactly this reality. What began as a regional conflict has evolved into a commodity shock of historic proportions, touching energy markets, fertilizer supply chains, food security systems, and sovereign debt dynamics across dozens of nations simultaneously. Understanding the mechanics of that transmission is essential for investors, policymakers, and anyone attempting to navigate the economic landscape of the next 18 months.
When big ASX news breaks, our subscribers know first
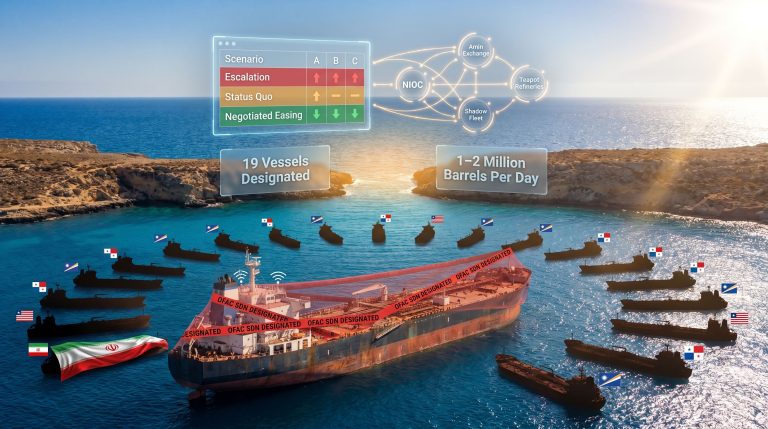
The Strait of Hormuz: Geography as Destiny
Before the current conflict, the Strait of Hormuz served as the transit corridor for approximately 35% of global seaborne crude oil trade. No other waterway on Earth concentrates so much energy trade through such a narrow geographic passage. Unlike the Suez Canal, which handles a broader mix of containerised goods and for which viable alternative routes exist at higher cost, the Strait of Hormuz has no meaningful substitute.
Oil volumes displaced from this corridor cannot simply be rerouted without restructuring the entire logistical architecture of Middle Eastern energy exports. Our crude oil volatility guide outlines why price swings in this environment can be severe and rapid.
That concentration, long recognised as a theoretical vulnerability, became an operational crisis when infrastructure attacks and shipping disruptions translated regional conflict into global supply destruction. The World Bank's April 2026 Commodity Markets Outlook classified the resulting disruption as the largest oil supply shock on record, with an estimated 10 million barrels per day removed from global supply at the peak of the crisis.
For context, global daily oil consumption in 2026 runs at approximately 100 to 105 million barrels per day, meaning the conflict effectively took roughly one in every ten barrels offline simultaneously. The price response was immediate and severe. By mid-April 2026, Brent crude oil prices were trading more than 50% higher than at the start of the year, with June futures settling around $109 per barrel after hitting their highest close in weeks.
Why Is This Shock Categorically Different From Previous Disruptions?
Comparing the 2026 disruption to historical supply shocks reveals both similarities and a critical structural distinction. The 1973 Arab Oil Embargo removed approximately 5 million barrels per day from global markets. The 1990 Gulf War caused a temporary spike of similar magnitude, resolved within 6 to 8 months. The 2022 Russia-Ukraine conflict redirected approximately 3 to 4 million barrels per day rather than eliminating them entirely.
The 2026 disruption differs on two dimensions that elevate its systemic risk profile above all predecessors, and the oil market trade risks present across geopolitical flashpoints make the situation even more complex:
- Volume: At 10 million barrels per day, the supply removal is roughly double any prior single-incident shock
- Simultaneity: The Strait of Hormuz is not just a crude oil corridor — natural gas liquefied exports, petrochemical feedstocks, and fertilizer precursor materials all transit through the same chokepoint, meaning a single disruption cascades across multiple commodity markets at once
- Infrastructure destruction: Unlike temporary shipping blockades, attacks on physical infrastructure create repair timelines measured in months rather than days
- Recovery asymmetry: Supply disruption can occur in hours; supply recovery requires engineering, procurement, installation, and testing phases that typically span 10 to 20 weeks even for moderate facility damage
This combination of scale, simultaneity, and structural recovery constraints is why the World Bank describes the situation with language it has not used for any prior supply event.
The World Bank Energy Prices Forecast Due to Middle East War: Breaking Down the Numbers
The World Bank's April 2026 Commodity Markets Outlook presents two distinct forward scenarios, each carrying different implications for energy markets, inflation trajectories, and economic growth in developing nations. Understanding the architecture of these projections is critical for interpreting what the World Bank energy prices forecast due to Middle East war actually tells us about the range of outcomes facing the global economy.
Baseline Scenario: Gradual Recovery Through 2026
The baseline scenario rests on a single core assumption: that shipping volumes through the Strait of Hormuz gradually return toward pre-conflict levels by October 2026. Under this pathway, the World Bank's Commodity Markets Outlook projects the following:
| Metric | 2025 Level | 2026 Baseline Forecast | Change |
|---|---|---|---|
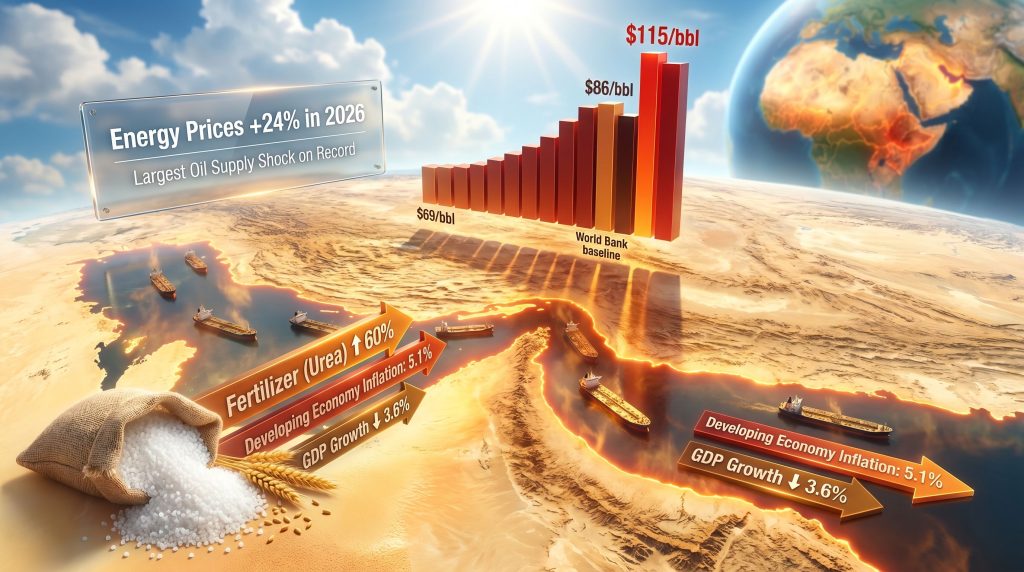
| Brent Crude Oil (avg.) | $69/bbl | $86/bbl | +24.6% |
| Energy Price Index | Baseline | +24% | Highest since 2022 Ukraine invasion |
| Overall Commodity Price Index | Baseline | +16% | Encompasses energy, fertilizers, metals |
| Developing Economy Inflation | 4.7% | 5.1% | +0.4 percentage points |
| Developing Economy GDP Growth | Pre-war: 4.0% forecast | 3.6% | -0.4 percentage points |
The October 2026 recovery timeline is grounded in historical precedent. Post-Gulf War shipping disruptions resolved within approximately 6 to 8 months; from mid-April 2026, October represents roughly 26 weeks, placing this assumption at the upper range of historical recovery timelines for moderate infrastructure damage scenarios.
Escalation Scenario: What the Higher Pathway Looks Like
If sustained damage to critical oil and gas infrastructure suppresses export volumes beyond the October recovery assumption, the escalation scenario activates. Under this pathway:
- Brent crude could average as high as $115 per barrel across 2026, representing a 33.7% premium above the baseline $86 forecast
- Developing economy inflation could reach 5.8%, a level not seen across this cohort since 2022
- GDP growth in developing nations would fall further below the already-downgraded 3.6% baseline
The World Bank explicitly characterises the risk distribution as "markedly tilted" toward higher prices rather than lower. This asymmetric risk framing carries significant analytical weight: it signals that the institution's internal modelling assigns greater probability mass to outcomes above baseline than below it, even while presenting the lower figure as the central projection.
Furthermore, the LNG supply outlook for 2025 had already flagged tightening conditions before the current conflict, suggesting that the market was entering this crisis with limited spare capacity.
The World Bank's Chief Economist, Indermit Gill, described the economic transmission as a sequential cascade rather than a single shock: the conflict strikes the global economy through successive waves of higher energy costs, which then drive food price inflation, which in turn elevates overall consumer prices, eventually forcing interest rates higher and making debt servicing more expensive for the most financially vulnerable nations. (Source: Reuters via Kitco News, April 2026)
This framing identifies five distinct transmission stages between the initial supply shock and its full economic impact, each with its own lag time and amplification mechanism.
The Natural Gas Chain: How Energy Disruption Becomes a Food Crisis
The most underappreciated dimension of the current commodity shock is the linkage between energy disruption and global food security. Most analysis focuses on direct oil price impacts on transport and manufacturing costs. However, the fertilizer transmission channel operates through a more complex but equally consequential mechanism.
Understanding the Urea Production Chain
Urea, the most widely used solid nitrogen fertilizer globally, is produced through a two-stage industrial process that begins with natural gas:
- Natural gas is processed through steam methane reforming to produce ammonia
- Ammonia combines with carbon dioxide under high pressure to produce urea
- Urea is granulated and distributed to agricultural markets worldwide
- Natural gas accounts for 70 to 80% of urea production costs in most facilities
This production chain means that when natural gas prices spike due to Middle East supply disruption, the cost increase flows directly into fertilizer economics with minimal ability for producers to substitute alternative inputs. The Strait of Hormuz disruption therefore simultaneously affects crude oil prices, natural gas prices, ammonia prices, and urea prices — all through the same chokepoint.
The World Bank projects fertilizer prices will increase 31% in 2026 overall, with urea specifically forecast to surge 60%. This is not a marginal agricultural input cost increase. A 60% jump in urea prices represents an existential financial pressure for smallholder farmers in import-dependent developing nations who have no viable nitrogen fertilizer substitute.
The Agricultural Lag Effect
One of the least discussed but most consequential features of fertilizer price shocks is the harvest-cycle lag: the gap between when input costs rise and when reduced crop output reaches markets. Farmers facing unaffordable fertilizer prices have three options:
- Pay the higher price and compress margins or go into debt
- Apply less fertilizer and accept lower yields
- Delay planting decisions while hoping for price relief
All three responses ultimately reduce food supply, but the production shortfall does not appear in market prices until the following harvest cycle, typically 3 to 9 months after the fertilizer price spike. This means the full food security impact of the 2026 fertilizer shock will not become visible in crop output data until late 2026 or early 2027.
The World Food Programme estimates that 45 million additional people could face acute food insecurity if the conflict continues on a prolonged trajectory, concentrated heavily in Sub-Saharan Africa and South Asia.
Energy Prices +24%
       ↓
Natural Gas Costs Surge
       ↓
Ammonia Production Costs Rise
       ↓
Urea Prices +60%
       ↓
Farm Input Costs Compress Margins
       ↓
Reduced Fertilizer Application → Lower Future Yields
       ↓
Food Price Inflation Accelerates
       ↓
Developing Economy CPI: 5.1%–5.8%
       ↓
Interest Rate Pressure + Sovereign Debt Costs Rise
Developing Economies: Absorbing a Compounding Shock
The geographic and economic distribution of damage from the current commodity shock is deeply unequal. Energy-exporting nations experience temporary terms-of-trade improvements, even as regional instability creates offsetting risks. Advanced economies face inflation re-acceleration that could delay anticipated central bank rate-cutting cycles. However, the most severe and sustained damage concentrates in developing and frontier market economies that simultaneously import energy, depend on fertilizer for agricultural productivity, and carry elevated sovereign debt levels.
Inflation and Growth Projections for Emerging Markets
Under the World Bank's baseline scenario, developing economies face an inflation rate of 5.1% in 2026, up from 4.7% in 2025 and a full percentage point above pre-conflict projections. GDP growth in developing economies is now projected at 3.6% in 2026, down from a pre-war forecast of 4.0%.
The 0.4 percentage point reduction may appear modest in isolation, but across the combined output of dozens of emerging market economies, it translates to hundreds of billions of dollars in foregone economic activity, reduced household incomes, and compressed government revenues precisely when fiscal demands are rising.
The Debt-Inflation Trap Mechanism
For highly indebted developing nations, the current shock operates through a particularly damaging feedback loop:
| Stage | Mechanism | Effect |
|---|---|---|
| 1. Energy prices rise | Import costs surge, trade deficits widen | Currency depreciation pressure |
| 2. Food prices rise | Consumer inflation accelerates | Real wage compression |
| 3. Overall CPI rises | Central banks forced to raise policy rates | Borrowing costs increase |
| 4. Interest rates rise | Sovereign debt servicing costs increase | Fiscal space narrows |
| 5. Growth slows | Tax revenue falls | Debt-to-GDP ratio worsens |
This sequence is particularly punishing for nations that borrowed heavily in US dollars during the low interest rate environment of 2020 to 2022 and are now refinancing at materially higher rates while simultaneously facing rising import costs and slowing growth.
Regional Vulnerability Mapping
| Region Type | Primary Vulnerability | Compounding Risk |
|---|---|---|
| Net energy importers (Sub-Saharan Africa) | Direct fuel cost inflation | Currency depreciation + import dependency |
| Agricultural economies (South Asia) | Fertilizer input cost surge | Food price volatility + rural income compression |
| Highly indebted frontier markets | Rising interest rates | Debt servicing cost escalation |
| Middle-income commodity exporters | Temporary revenue windfall | Inflation pass-through + Dutch disease risk |
Metals Markets and the Broader Commodity Complex
While energy and fertilizer dominate the headline projections, the World Bank's April 2026 Commodity Markets Outlook also reports record-high prices across several key metals as of the reporting period. The overall commodity price index forecast of +16% for 2026 reflects the combined weight of energy, fertilizers, and metals across the index composition.
Two structural forces are driving metals prices simultaneously:
- Energy transition demand (structural, long-duration): The surge in critical minerals demand from grid infrastructure, electric vehicles, and battery storage deployment is placing sustained upward pressure on copper, lithium, nickel, and cobalt
- Supply chain disruption (cyclical, conflict-driven): Middle East instability affects petrochemical supply chains, industrial inputs, and shipping logistics that intersect with metals processing and distribution
For energy-intensive metals production such as aluminium and steel, higher input costs from energy price increases compress producer margins, particularly for facilities dependent on grid electricity in regions where power prices track natural gas benchmarks. This cost-push dynamic can reduce supply-side responsiveness precisely when demand signals are strongest, amplifying price moves above what demand fundamentals alone would justify.
In addition, commodities diversification strategies have become increasingly relevant for portfolio managers seeking to manage exposure across this unusually broad commodity shock.
The next major ASX story will hit our subscribers first
Frequently Asked Questions: World Bank Energy Prices Forecast and the 2026 Commodity Shock
What Is the World Bank Energy Prices Forecast Due to Middle East War for 2026?
The World Bank energy prices forecast due to Middle East war projects energy prices will rise approximately 24% in 2026 compared to 2025, representing the highest energy price environment since Russia's full-scale invasion of Ukraine. This is the institution's baseline scenario, built on the assumption that Strait of Hormuz shipping volumes gradually recover toward pre-conflict levels by October 2026.
What Is the Specific Brent Crude Forecast Under Each Scenario?
Under the baseline scenario, Brent crude is forecast to average $86 per barrel in 2026, up from $69 per barrel in 2025. Under the escalation scenario, involving sustained infrastructure damage and slow export recovery, Brent crude could average as high as $115 per barrel. Reuters reports that this would represent the biggest energy price surge in four years.
Why Does the World Bank Say Risks Are Tilted Toward Higher Rather Than Lower Prices?
The asymmetric risk assessment reflects the structural nature of the supply disruption. Infrastructure repair takes significantly longer than infrastructure destruction, meaning the pathway to lower prices requires sustained ceasefire conditions, successful engineering remediation, and export logistics restoration. Conversely, further escalation could occur rapidly and without warning, making upside price scenarios more immediately accessible than downside recovery scenarios.
How Do Fertilizer Prices Connect to Food Insecurity?
Natural gas is the primary feedstock for urea production, accounting for 70 to 80% of production costs. When gas prices surge due to Middle East supply disruption, urea prices follow. A projected 60% jump in urea prices increases agricultural input costs sharply, compressing farmer margins, incentivising reduced fertilizer application, and ultimately threatening future crop yields. The World Food Programme estimates 45 million additional people could face acute food insecurity if the conflict is prolonged.
What Should Investors Monitor as Leading Indicators?
Several data series provide early warning signals beyond headline oil prices:
- Strait of Hormuz shipping volume data, the primary variable underlying the World Bank's October recovery assumption
- Brent crude futures curve shape, where steep backwardation indicates persistent near-term supply tightness
- Urea and ammonia spot prices, providing early warning of food security deterioration ahead of harvest-cycle data
- Developing economy central bank policy rate decisions, signalling how inflation transmission is being managed at the sovereign level
The Long Arc of This Shock: Structural vs. Cyclical Dynamics
The most critical analytical distinction for understanding the 2026 commodity shock is between cyclical disruption and structural damage. Cyclical shocks, such as the 2021 Suez Canal blockade or the 2011 Libya supply disruption, temporarily redirect trade flows but leave underlying infrastructure intact. Recovery is primarily a logistics and market-pricing exercise.
Structural damage, however, where physical energy infrastructure requires engineering remediation before supply can resume, creates fundamentally different recovery dynamics. The supply cannot return to market regardless of price incentives until the physical infrastructure is restored. This supply inelasticity means that price signals, which normally attract additional production and rerouting activity, cannot function as effective adjustment mechanisms in the near term.
The World Bank's baseline assumption of October 2026 recovery represents an optimistic scenario, not a guaranteed outcome. Historical infrastructure repair timelines for significant facility damage run 10 to 20 weeks for moderate cases, and the October assumption falls at the upper boundary of that range. Any additional infrastructure incidents, delays in engineering procurement, or escalation of hostilities would push recovery timelines beyond the October baseline, activating the escalation price scenario or worse.
The 2026 commodity shock is not simply an oil price event. It represents a cascading stress test of the global economy's structural dependence on a single geographic chokepoint for energy supply, food inputs, and industrial materials simultaneously. The full economic impact, running through energy into food into inflation into debt, will not be fully measurable until 2027 or beyond.
For policymakers, the available response levers include strategic petroleum reserve releases as short-term supply buffers, fertilizer subsidy programmes to shield agricultural sectors in vulnerable economies, concessional financing mechanisms for developing nations facing dual inflation and growth shocks, and accelerated investment in supply route diversification to reduce long-term dependence on single-corridor energy trade.
For investors, the asymmetric risk profile described by the World Bank — where downside scenarios require multiple conditions to align while upside scenarios require only continued disruption — suggests that commodity exposure and inflation hedging strategies warrant serious consideration within portfolio construction decisions for the remainder of 2026.
This article is for informational purposes only and does not constitute financial or investment advice. Commodity price forecasts involve significant uncertainty and actual outcomes may differ materially from projections. All financial decisions should be made in consultation with qualified professional advisers. Forecasts cited are sourced from the World Bank's Commodity Markets Outlook (April 2026) as reported by Reuters via Kitco News.
Want to Position Ahead of the Next Major Commodity Discovery?
Discovery Alert's proprietary Discovery IQ model scans ASX announcements in real time, instantly identifying significant mineral discoveries across the commodities most sensitive to global supply shocks — from energy transition metals to critical industrial inputs. Explore how historic discoveries have generated substantial returns on Discovery Alert's dedicated discoveries page, and begin your 14-day free trial today to secure a market-leading edge before the broader market moves.