June 10, 2026
When Shipping Lanes Become Economic Fault Lines
The global energy system has long been quietly vulnerable to a specific category of risk: geographic concentration. Decades of infrastructure investment, trade route development, and supply chain architecture have been organised around a handful of maritime chokepoints, each representing a potential single point of failure for billions of dollars in daily commerce. The World Bank energy prices Middle East war dynamic has brought this structural fragility into sharp relief, exposing how quickly invisible vulnerabilities can become market-moving realities.
The events that unfolded from late February 2026 onward represent precisely this kind of inflection point. The US-Iran conflict that began on February 28, 2026, did not merely create regional instability. It directly threatened the arterial passage through which roughly 35% of all global seaborne crude oil flows: the Strait of Hormuz. The World Bank's April 2026 Commodity Markets Outlook has since characterised the resulting disruption as the largest oil supply shock on record, surpassing the scale and speed of every prior geopolitical energy crisis, including the 1973 Arab oil embargo and the 1990 Gulf War.
Understanding what the World Bank's projections actually say, what they assume, and where they could be wrong is now one of the most consequential analytical exercises available to investors, policymakers, and market observers worldwide.
When big ASX news breaks, our subscribers know first
The Strait of Hormuz: Geography as Economic Destiny
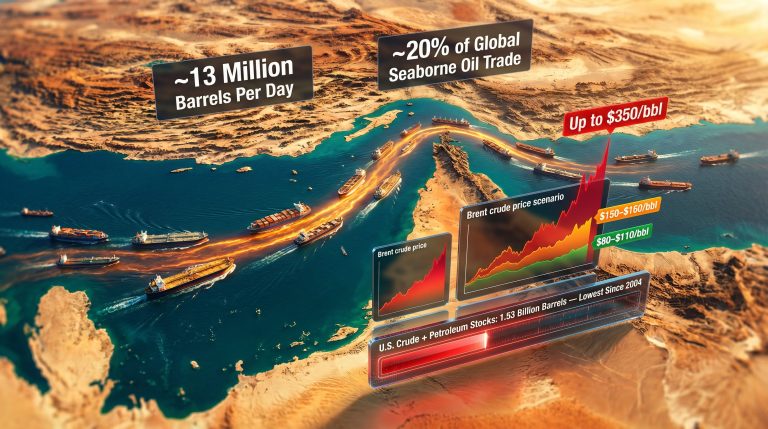
The Strait of Hormuz connects the Persian Gulf to the Gulf of Oman, running between Iran to the north and Oman's Musandam Peninsula to the south. At its narrowest navigable point, the strait spans roughly 21 nautical miles, with shipping traffic organised into two-mile-wide inbound and outbound lanes separated by a two-mile buffer zone. This narrow corridor is the exit point for crude oil produced across Saudi Arabia, Iraq, Kuwait, the UAE, and Iran itself.
In addition, the strait serves as the primary export route for Qatari liquefied natural gas. Before the current conflict escalated, it facilitated approximately 35% of all global seaborne crude oil trade, according to the World Bank's commodity markets reporting. The concentration of trade through this single corridor represents one of the most significant structural vulnerabilities in global commodity markets.
Unlike the Suez Canal, which can be bypassed via the Cape of Good Hope route at significant cost and delay, Hormuz has no equivalent bypass for Persian Gulf producers. Saudi Arabia's East-West Pipeline and the Abu Dhabi Crude Oil Pipeline offer partial alternatives, however their combined capacity cannot absorb even a fraction of Hormuz's normal throughput.
The result of sustained Hormuz disruption is not merely increased shipping costs or delayed deliveries. It is a fundamental removal of supply from accessible global markets, a distinction with profound implications for both price formation and food security.
What the World Bank's 2026 Forecast Actually Says
The World Bank's Commodity Markets Outlook, published April 28, 2026, presents a tiered scenario framework for energy price outcomes across the calendar year. Rather than offering a single forecast, the bank explicitly acknowledges that the range of plausible outcomes depends almost entirely on geopolitical developments that remain outside any institution's ability to predict with certainty.
Baseline Scenario: Conditional on May 2026 Resolution
Under the baseline case, the World Bank projects a 24% surge in energy prices across 2026, with this outcome contingent on the most acute conflict-driven disruptions concluding by May 2026. The bank further assumes that shipping volumes through the Strait of Hormuz would gradually recover toward pre-war norms by October 2026.
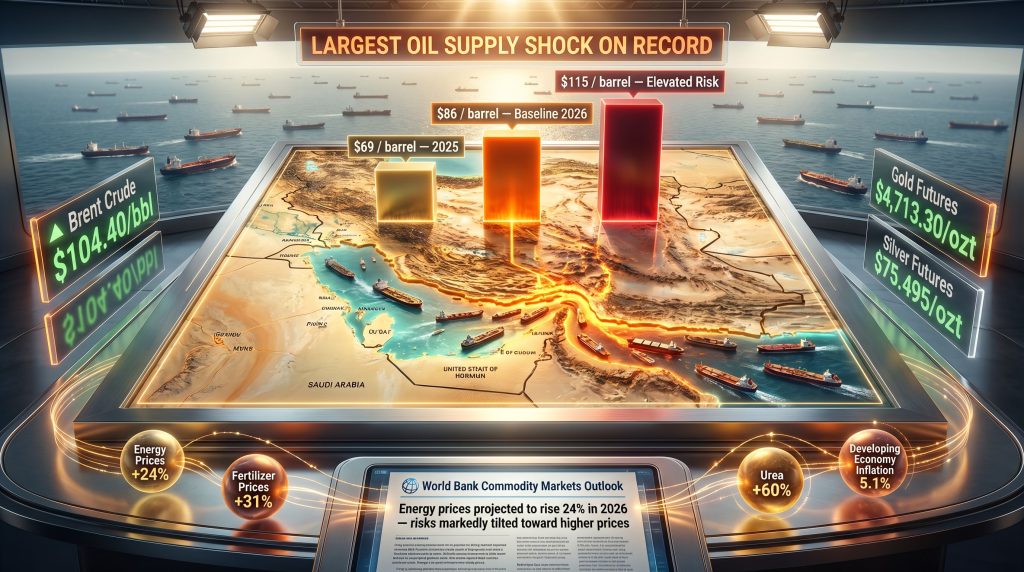
For Brent crude specifically, the baseline projects an annual average of $86 per barrel in 2026, a sharp increase from the $69 per barrel recorded in 2025. Furthermore, the broader commodity price index is projected to rise by 16% in 2026 under this scenario, driven by energy, fertiliser, and metals inflation simultaneously.
The Elevated Risk Scenario and Current Market Reality
The bank's elevated risk scenario, which assumes continued damage to critical oil and gas infrastructure and a slower recovery in export volumes, projects Brent crude averaging as high as $115 per barrel for the full year.
As of late April 2026, Brent crude futures for June were trading at approximately $109 per barrel, placing real-time market pricing squarely between the baseline and elevated risk projections. Brent prices had already risen by more than 50% in mid-April 2026 compared to the start of the year. Consequently, crude oil volatility has become a defining feature of global energy markets, with crude oil volatility compounding the uncertainty facing both producers and consumers.
The following table summarises the scenario architecture:
| Scenario | Brent Crude Average (2026) | Key Assumption |
|---|---|---|
| 2025 Actual | $69/barrel | Pre-conflict baseline |
| Baseline (2026) | $86/barrel | Conflict disruptions end May 2026 |
| Elevated Risk | $115/barrel | Further infrastructure damage, slow recovery |
| Market Price (Late April 2026) | ~$109/barrel | Hormuz largely closed |
One critically underappreciated aspect of the World Bank's communication is its explicit statement that risks are "markedly tilted" toward higher prices, not lower. This framing is unusual for an institution typically cautious about directional language. It signals that the $86 baseline should be understood as a floor estimate, and that the probability distribution of outcomes is substantially skewed toward the $115 elevated scenario rather than symmetrically distributed around the midpoint.
The World Bank explicitly warned that commodity prices could rise even further if hostilities escalated and supply disruptions lasted longer than expected, with the bank stating that risks to its baseline forecast were markedly tilted toward higher, not lower, prices. (Reuters, April 28, 2026)
The Three-Wave Transmission Mechanism
World Bank Chief Economist Indermit Gill characterised the economic impact of the World Bank energy prices Middle East war as operating through a sequential, self-reinforcing transmission mechanism. Rather than delivering a single shock, the conflict propagates its damage in stages, each wave creating the conditions for the next.
Wave One: Energy Price Escalation
The first and most direct impact is the removal of oil and gas supply from global markets through a combination of infrastructure attacks and sustained shipping disruptions. This supply shock is mechanical: less oil and gas reaching buyers means higher prices for what remains accessible. Brent crude prices surged by nearly 40% between February and March 2026, with prices exceeding $116 per barrel at their peak before settling around $109 as of late April.
Wave Two: Fertiliser and Food Security Crisis
The second wave is less immediately visible but potentially more damaging over a longer horizon. Fertiliser production, particularly urea, is chemically and economically dependent on natural gas. The Haber-Bosch process converts natural gas into ammonia, which is then combined with carbon dioxide to produce urea, the world's most widely used solid nitrogen fertiliser.
When natural gas prices rise sharply, ammonia production costs escalate proportionally, directly transmitting energy inflation into agricultural input costs. The World Bank projects that fertiliser prices will increase by 31% in 2026, with urea specifically forecast to jump by 60%. The implications for global food production are severe, with the World Food Programme estimating that a prolonged conflict scenario could push 45 million additional people into acute food insecurity in 2026 alone.
This second-wave food security risk is structurally different from the first-wave energy price shock because it operates on an agricultural calendar. Farmers who cannot afford fertiliser this planting season will produce fewer crops in the next harvest season, meaning the food security consequences of the 2026 energy price shock may not fully materialise until 2027.
Wave Three: Inflation, Debt Stress, and Growth Downgrades
The third wave is macroeconomic and operates through inflation dynamics and sovereign debt markets. As energy and food prices rise simultaneously, consumer price inflation accelerates, particularly in developing economies where food and energy represent a larger share of household spending.
The World Bank now projects developing economy inflation will average 5.1% in 2026 under the baseline scenario, up from 4.7% in 2025 and a full percentage point above pre-war forecasts. Under a prolonged conflict scenario, developing economy inflation could reach 5.8%.
Higher inflation compels central banks to maintain or raise interest rates, increasing the cost of sovereign borrowing at precisely the moment when governments face rising import bills and declining fiscal space. For already heavily indebted developing nations, this combination creates acute debt servicing stress. Developing economies are now projected to grow by just 3.6% in 2026, revised down from a pre-war forecast of 4.0%.
Asymmetric Burdens: Who Bears the Cost?
One of the most analytically important features of the current crisis is that its costs are distributed deeply asymmetrically across the global economy. The World Bank explicitly highlights this asymmetry, noting that energy-importing nations bear disproportionate costs while some Middle East producers simultaneously lose export revenue due to the blockade of their own shipping routes. Understanding the full scope of global trade war impacts alongside this energy disruption is essential for contextualising the compounding pressures now facing developing economies.
| Country Category | Primary Impact | Secondary Impact |
|---|---|---|
| Low-income energy importers | Surging import bills, fiscal strain | Currency depreciation, subsidy pressure |
| Highly indebted developing nations | Elevated debt costs | Reduced fiscal space for social spending |
| Middle East energy exporters | Loss of export revenue (Hormuz blockade) | Infrastructure damage risk |
| Advanced economies | Inflationary pressure | Slower growth, tighter monetary policy |
The cruelest irony of the current shock is that some Middle Eastern producing nations, which in previous oil price spikes were beneficiaries of elevated prices, are now simultaneously experiencing infrastructure damage, shipping disruption, and revenue loss. They face higher prices on paper but are constrained in their ability to capture those revenues.
Qatar's Gas Infrastructure: The Longest-Duration Risk
Among the specific asset-level risks the World Bank scenario framework implicitly encompasses, Qatar's gas production infrastructure represents the single most consequential vulnerability for global LNG supply markets. Qatar is the world's largest LNG exporter, and its production infrastructure, centred on the North Field, is concentrated in a relatively small geographic area.
Modelling of potential infrastructure damage scenarios suggests that significant damage to Qatar's gas fields could result in an estimated 17% output loss, with full restoration requiring approximately three to five years. This timeline asymmetry, where damage can occur rapidly but restoration takes years, is the defining structural feature of the elevated risk scenario. Even a ceasefire and Hormuz reopening would not resolve supply shortfalls caused by physical production facility damage within the 2026 timeframe.
Asian LNG buyers, who have already seen import costs surge dramatically, would be the most acutely exposed market in this scenario given their high dependency on Qatari supplies.
The next major ASX story will hit our subscribers first
Metals Markets: A Parallel Record-Setting Rally
The World Bank's Commodity Markets Outlook also documents record-high prices across several key metals categories, a development that reflects both the broad commodity inflation dynamic and specific supply chain disruptions affecting mining and processing sectors. Consequently, commodity market hedging has become increasingly critical for institutional investors, with commodity market hedging strategies being reassessed across the industry.
The following snapshot captures current pricing across the metals complex, reflecting the acute geopolitical risk premium now embedded in commodity markets:
| Metal | Recent Price | Recent Movement |
|---|---|---|
| Gold Futures | $4,713.30/ozt | +3.84% |
| Silver Futures | $75.495/ozt | +7.47% |
| Platinum | $1,973.85/ozt | +4.22% |
| Palladium | $1,496.50/ozt | +5.39% |
| Copper | $5.6358/lb | +2.72% |
| Aluminum Futures | $3,314.25/ton | -1.21% |
And across energy commodities:
| Energy Commodity | Recent Price | Recent Movement |
|---|---|---|
| Brent Crude Oil | $104.40/bbl | -4.21% |
| Crude Oil (WTI) | $101.85/bbl | -3.06% |
| Natural Gas | $2.89/Btu | +0.10% |
The intraday decline in Brent crude visible in the snapshot above illustrates a phenomenon common to crisis markets: near-term volatility driven by ceasefire speculation sits in direct tension with the longer-term structural supply deficit. When diplomatic overtures suggest possible conflict resolution, prices retreat on expectations of Hormuz reopening. When negotiations stall, prices re-elevate.
Gold's surge to above $4,713 per ounce reflects a separate but related dynamic. Gold safe-haven demand has intensified as geopolitical uncertainty deepens, combined with the de-dollarisation thesis that has gained momentum among central banks globally. Deutsche Bank has separately projected gold could reach $8,000 per ounce under a scenario where bullion's share of global central bank reserves rises from approximately 30% to 40%, a speculative but increasingly discussed structural shift.
The Policy Response and Its Limits
The World Bank has activated financial relief mechanisms targeting governments, private sector firms, and households in the most severely affected nations. Policy support frameworks are being deployed to help energy-importing developing nations manage fiscal pressures arising from surging import costs, and private sector assistance programmes are being coordinated to maintain supply chain continuity in critical sectors.
However, the fundamental constraint facing the World Bank and other multilateral institutions is that financial assistance can help cushion the blow of higher prices but cannot resolve the underlying cause: a physical supply disruption driven by an active military conflict. No amount of balance of payments support eliminates the structural deficit created by sustained Hormuz closure.
This distinction between symptom management and structural resolution is critical for investors and policymakers to internalise. Even under a fragile ceasefire scenario, recovery of Hormuz transit capacity is expected to be delayed by logistical complexity, vessel repositioning requirements, and the time needed to restore damaged infrastructure. Elevated energy prices are therefore likely to persist well into the second half of 2026 regardless of near-term diplomatic progress.
Key Projections at a Glance
| Metric | Baseline (2026) | Elevated Risk Scenario |
|---|---|---|
| Energy price increase | +24% | Materially higher |
| Overall commodity price increase | +16% | Materially higher |
| Brent crude average | $86/barrel | $115/barrel |
| Fertiliser price increase | +31% | Materially higher |
| Urea price increase | +60% | Materially higher |
| Developing economy inflation | 5.1% | 5.8% |
| Developing economy GDP growth | 3.6% | Below 3.6% |
| Additional people at food risk | 45 million | Higher |
The World Bank's own language leaves little ambiguity about the directional bias of its risk assessment. The conditional nature of the baseline scenario, its reliance on a May 2026 conflict resolution that had not materialised as of late April 2026, and the bank's explicit statement that risks are markedly skewed toward worse outcomes all point in the same direction.
For investors, the current environment demands a framework that accounts not just for the central scenario but for the right tail of the distribution. The World Bank energy prices Middle East war dynamic is not a short-duration supply disruption analogous to previous geopolitical shocks. It is a compounding, multi-wave crisis with feedback loops running from energy through food to inflation and sovereign debt. Understanding where one wave ends and the next begins is the analytical challenge that will define commodity market positioning for the remainder of 2026.
Disclaimer: This article is intended for informational purposes only and does not constitute financial, investment, or economic advice. Commodity price forecasts are inherently uncertain and subject to revision based on geopolitical developments, market conditions, and other factors beyond any institution's predictive capacity. Readers should conduct independent research and consult qualified financial advisors before making investment decisions. All projections referenced are sourced from the World Bank's Commodity Markets Outlook (April 2026) and Reuters reporting dated April 28, 2026.
Want to Stay Ahead of Major Commodity Discoveries During Market-Moving Events Like This?
When energy shocks and geopolitical disruptions reshape commodity markets at this speed, identifying significant ASX mineral discoveries ahead of the broader market becomes a critical advantage — Discovery Alert's proprietary Discovery IQ model delivers real-time alerts the moment major discoveries are announced, turning complex data across 30+ commodities into clear, actionable insights. Explore historic mineral discovery returns to understand the opportunity, or start your 14-day free trial today and position yourself ahead of the next major market move.