June 11, 2026
When Commodity Markets Send a Unanimous Signal, History Tends to Reward Those Who Listen
Commodity supercycles do not announce themselves cleanly. They build through a convergence of independent pressures until the weight of evidence becomes impossible to dismiss. Energy markets tighten. Currency confidence erodes. Institutional capital repositions quietly, well ahead of retail recognition. By the time a headline number arrives, the structural forces behind it have typically been in motion for years.
The World Bank precious metals forecast, published in the April 2026 Commodity Markets Outlook, delivers exactly that kind of headline number. Its precious metals price index is projected to surge 42% in 2026 relative to full-year 2025 averages, making precious metals the highest-performing commodity class of the year by a substantial margin. Understanding what that figure actually means, and what is driving it, requires moving beyond the number itself and into the architecture of forces that produced it.
When big ASX news breaks, our subscribers know first
What the World Bank Precious Metals Forecast Actually Measures
Before interpreting the World Bank precious metals forecast, it is worth understanding the methodology behind it. The World Bank constructs its commodity price indices using basket-based averaging, where constituent metals, primarily gold, silver, and platinum group metals, are weighted according to global production volumes and trading significance. The precious metals sub-index is maintained as a distinct analytical category from base metals, energy, and agriculture because it responds to a fundamentally different set of demand drivers.
Base metals reflect construction activity and industrial cycles. Energy follows geopolitical supply dynamics and consumption patterns. Agriculture responds to harvest yields and population-level demand. Precious metals operate across two domains simultaneously: monetary demand driven by safe-haven capital flows and central bank reserve strategy, and industrial demand driven by technology adoption and manufacturing requirements. This dual-engine structure is what separates the precious metals sub-index from every other commodity category in the World Bank's framework.
The 42% projection is also a full-year average comparison, not a spot price target. It measures the average of all 2026 trading days against the average of all 2025 trading days. This distinction carries significant practical implications for investors.
2026 Commodity Performance Projections at a Glance
| Commodity Category | Projected 2026 Price Change |
|---|---|
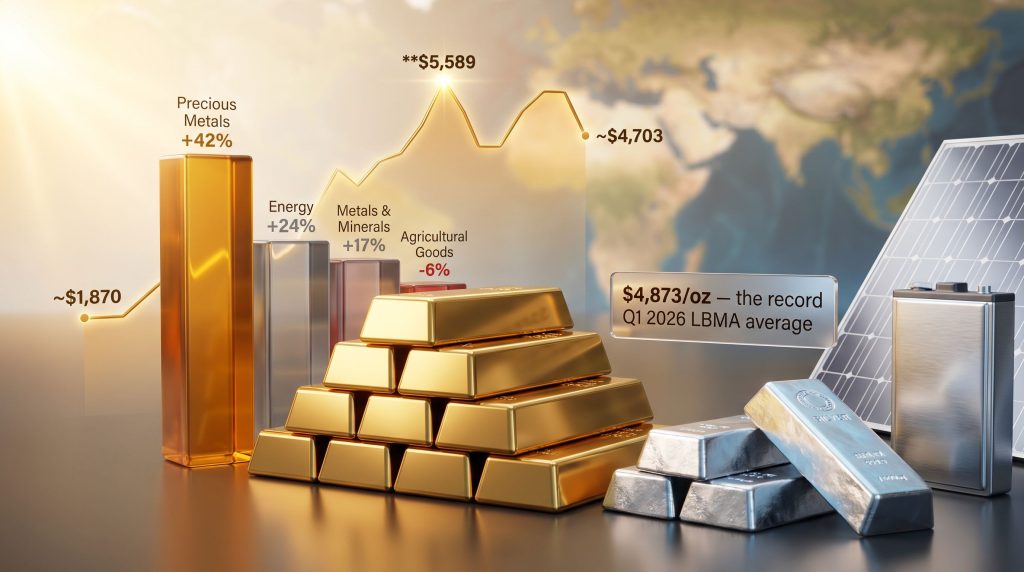
| Precious Metals | +42% |
| Energy | +24% |
| Metals and Minerals | +17% |
| Agricultural Goods | -6% |
| Overall Commodity Index | +16% |
Source: World Bank Group, Commodity Markets Outlook April 2026
The 42% precious metals projection more than doubles the next-best category, energy at 24%, and represents the first broad commodity price increase since 2022. Critically, this is a full-year average methodology, meaning interim price corrections, even significant ones, do not necessarily invalidate the forecast. If the 2025 full-year average gold price was approximately $3,500/oz, a 42% increase implies a 2026 average of roughly $4,970/oz.
Furthermore, looking ahead, the World Bank projects an 8% decline in precious metals prices in 2027, contingent on supply normalisation and a reduction in geopolitical risk premiums. This forward trajectory reveals the institution's baseline assumption: that 2026 represents a peak-influenced year, with conditions stabilising the following year. Whether that stabilisation materialises depends on factors that remain highly uncertain at present.
Where a 42% Annual Gain Sits in Historical Context
For reference, the S&P 500's long-run annual return averages approximately 10-11% annualised. Fixed income typically returns 4-6% annualised. A single-year precious metals projection of 42% is a material outlier even within commodity market history. During the 2020 COVID-19 crisis, gold moved from approximately $1,500/oz to over $2,000/oz within months, a 33% gain in under a year.
During the post-2008 recovery period, gold climbed from approximately $730/oz in October 2008 to nearly $1,900/oz by September 2011, representing a cumulative gain of over 160% from crisis lows. The World Bank's current projection is not unprecedented, but it is historically significant. For a broader perspective on these dynamics, the World Bank's commodity markets research portal provides detailed historical data and methodology documentation.
Four Structural Forces Behind the 2026 Precious Metals Rally
The World Bank's analysis identifies four converging drivers behind its forecast. Crucially, these forces are independent of one another. No single geopolitical outcome resolves all four simultaneously.
The Energy Shock and Its Inflationary Transmission
The Strait of Hormuz carries approximately 35% of global seaborne crude oil. When disruptions to shipping through this chokepoint materialised in early 2026, the consequences propagated rapidly across global energy markets. The initial cut to global oil supply was approximately 10 million barrels per day, triggering an energy price shock of historic proportions.
Brent crude moved from approximately $72/barrel at end of February 2026 to $118/barrel by end of March 2026, representing the largest monthly percentage increase ever recorded in oil market history. Over the same period, the Asian LNG benchmark surged 94% and European natural gas prices rose 59% (World Bank Group, Commodity Markets Outlook April 2026).
Energy costs are embedded in the production, transportation, and distribution of virtually every other good and service in the global economy. When oil moves 64% in a single month, that shock propagates through supply chains as higher shipping costs, elevated manufacturing overhead, and increased raw material expenses. The transmission mechanism from oil market disruption to broad consumer price inflation is well-established, and consequently explains why energy shocks historically accelerate capital rotation into inflation-resistant assets.
Global Inflation Resurgence: The Numbers Behind the Forecast
| Inflation Indicator | Reading |
|---|---|
| US CPI, April 2026 | 3.8% (highest since May 2023) |
| Federal Reserve Target | 2.0% |
| Deviation from Fed Target | 1.8 percentage points |
| Developing Economy Average Inflation (2026 projection) | 5.1% |
| Deviation from Pre-Conflict Forecasts | +1.0 percentage point |
Sources: U.S. Bureau of Labor Statistics; World Bank Group, Commodity Markets Outlook April 2026
With US inflation running at 3.8%, nearly double the Federal Reserve's 2% target, monetary policy faces a structurally constrained environment. Cutting rates to support growth risks amplifying inflationary pressure. Maintaining or raising rates risks suppressing economic activity in an already slowing economy. This policy bind is itself a bullish signal for precious metals, because it implies the Federal Reserve cannot deploy its primary inflation-fighting tool without simultaneously damaging growth prospects.
Gold's structural function as an inflation hedge is worth understanding precisely. Mine supply grows at approximately 1-2% annually regardless of monetary policy decisions. This supply ceiling cannot be rapidly expanded because mine development requires five to ten years from exploration discovery through to production. When monetary demand increases sharply while supply cannot respond, price appreciation is the equilibrating mechanism. The safe-haven investment case for gold is therefore reinforced significantly when inflation remains persistently above central bank targets.
Stagflation Risk: The Macro Configuration That Benefits Hard Assets Most
Stagflation occurs when economic output decelerates while consumer prices continue rising, simultaneously undermining equity earnings and eroding the real returns on fixed income. US Q1 2026 GDP came in at 2.0% annualised (Bureau of Economic Analysis, Q1 2026 Advance Estimate), a figure that appears modest in isolation but masks deteriorating real purchasing power when inflation is running at 3.8%.
Stagflation exists on a spectrum rather than as a binary condition. Even moderate stagflationary pressure is sufficient to shift institutional capital allocation toward hard assets. The current macro configuration exhibits several of its defining characteristics simultaneously, including below-trend real growth, above-target inflation, and a central bank constrained from acting decisively on either front.
In stagflationary environments, equities struggle because input cost inflation compresses earnings even when revenue appears to hold. Bonds suffer because fixed coupon payments are eroded by above-target inflation, producing negative real returns. Gold and silver benefit because they carry no counterparty risk, no cash flow dependent on corporate solvency or government stability, and a centuries-long track record of preserving purchasing power through currency debasement cycles.
Central Bank Accumulation: The Signal Most Retail Investors Overlook
Central banks purchased a net 244 tonnes of gold in Q1 2026, up 3% year-on-year and exceeding both the prior quarter and the five-year average. The LBMA gold price averaged a record $4,873/oz during that same quarter (World Gold Council, Gold Demand Trends Q1 2026). In addition, the broader implications of central bank gold demand on long-term price performance have been well-documented across multiple market cycles.
The significance of this data point is not just the volume, but the price at which accumulation occurred. Central banks do not speculate on geopolitical headlines. They operate on multi-year allocation frameworks constructed around long-term reserve strategy and currency confidence assessments. When institutional buyers maintain active accumulation programmes at all-time high price levels, it signals a strategic reorientation in how they view dollar-denominated reserves.
The distinction between strategic reserve diversification and speculative positioning is critical for understanding what central bank buying means for price sustainability. Speculative buyers chase momentum and exit on corrections. Strategic reserve managers accumulate continuously, providing a durable demand floor beneath market prices that retail sellers cannot easily overwhelm.
Gold Price Performance in 2026: Reading the Rally and the Pullback
Gold's price trajectory from 2021 through mid-2026 reflects a multi-year structural re-rating rather than a single-catalyst spike.
| Period | Gold Price (Approximate) |
|---|---|
| Early 2021 | ~$1,870/oz |
| May 2025 | ~$3,335/oz |
| January 28, 2026 (All-Time High) | $5,589/oz |
| Mid-May 2026 | ~$4,703/oz |
| Year-on-Year Gain (May 2025 to May 2026) | ~41% |
Sources: World Gold Council; Fortune, May 14 2026
Gold reached its all-time high of $5,589/oz on January 28, 2026, before correcting approximately 16% to around $4,703/oz by mid-May. For investors interpreting this correction as a bearish signal, the context of full-year average methodology matters enormously. The 42% World Bank projection compares annual averages, not peak-to-current readings.
Physical demand behaviour through the correction provides an important supplementary signal. Bar and coin demand reached 474 tonnes in Q1 2026, up 42% year-on-year and the second-highest quarterly total ever recorded (World Gold Council, Gold Demand Trends Q1 2026). When prices declined, physical buyers increased their purchasing activity. This is the defining characteristic of structural demand rather than speculative positioning.
J.P. Morgan and Institutional Forecast Alignment
| Institution or Source | Gold Price View |
|---|---|
| World Bank | 42% precious metals index gain for 2026 average versus 2025 average |
| J.P. Morgan | $5,000/oz year-end 2026 target |
| World Gold Council | Record Q1 2026 LBMA average of $4,873/oz confirmed |
| CME Group | Elevated structural demand following a record-breaking 2025 |
J.P. Morgan's year-end 2026 price target of $5,000/oz sits above current mid-May levels of approximately $4,703/oz, implying the institutional view is that the correction represents a pause within a continuing bull market rather than a structural reversal. CME Group's analysis of precious metals market dynamics similarly points to elevated structural demand conditions as the defining feature of the current cycle.
The influence of trade war impact on gold and silver prices has also contributed meaningfully to the current macro backdrop, adding a further layer of institutional caution around risk asset exposure.
Why Silver May Be the Highest-Percentage Performer in This Cycle
The World Bank's precious metals index presents a single headline number, but gold and silver are not responding to identical forces. Silver's case for outperformance on a percentage basis rests on a combination of factors that are structurally distinct from gold's primary drivers.
Silver's Dual-Engine Demand Structure
Unlike gold, which derives demand primarily from monetary and reserve functions, silver operates across two simultaneously expanding demand categories:
- Monetary and safe-haven demand, which accelerates during inflationary and geopolitically uncertain periods alongside gold
- Industrial consumption demand, driven by solar photovoltaic panel manufacturing, electric vehicle components, and increasingly, AI data centre infrastructure requiring silver-intensive conductive materials
Silver's industrial demand base is relatively inelastic to short-term price movements because technology adoption curves do not reverse with commodity price fluctuations. Solar installation targets set by governments and utilities years in advance continue driving silver consumption regardless of whether silver is trading at $30 or $50 per ounce. This inelastic industrial demand provides a demand floor that gold does not possess.
The Six-Year Supply Deficit: A Supply-Side Dynamic Most Investors Miss
Silver is entering its sixth consecutive year of physical market deficit in 2026 (Silver Institute, World Silver Survey 2026). The persistent silver supply deficits driving this dynamic are more consequential than they appear at first glance, because of a structural feature of silver mining that is not widely understood.
Approximately 70-80% of annual silver production is extracted as a by-product of copper, lead, and zinc mining operations. This means silver supply does not respond to silver's own price signal the way a primary mine would. Supply is therefore structurally constrained regardless of how strong silver demand becomes.
Six consecutive deficit years imply progressive drawdown of above-ground silver inventories. Unlike gold, where above-ground stocks are estimated in the tens of thousands of tonnes accumulated over centuries of mining history, silver's above-ground investable inventory is substantially smaller relative to annual consumption. Persistent deficits compress available inventory, creating conditions where demand shocks can produce more pronounced price responses than equivalent shocks in the gold market.
Pattern Recognition: Silver's Historical Tendency to Lag Then Accelerate
Across multiple major precious metals bull markets, silver has consistently lagged gold in the early stages of the rally before accelerating past it once the broader trend is firmly established. This pattern held during the 2008-2011 cycle, when silver's peak gain from crisis lows substantially exceeded gold's on a percentage basis, and it repeated during the 2018-2020 cycle.
Silver's lower absolute price relative to gold creates greater percentage upside potential from equivalent demand shifts. The gold-silver ratio has historically mean-reverted from elevated levels, with ratio compression generating amplified silver gains relative to gold's performance.
However, the risk consideration is equally important: silver's industrial demand exposure means it can decline more sharply than gold during periods of acute growth concern. On May 14, 2026, silver fell disproportionately relative to gold following inflation data, demonstrating that consecutive inflation beats can reprice industrial demand expectations. This asymmetric volatility profile distinguishes silver from gold as a portfolio allocation and requires investors to factor in higher short-term price variance.
Assessing the Risk Factors That Could Alter the Forecast
No commodity forecast operates without material uncertainty on both sides of the projection.
Upside Risk Scenarios
- Middle East disruptions prove more severe or prolonged than the World Bank's baseline assumption, extending the energy price shock and safe-haven premium
- US inflation remains persistently above the Federal Reserve's 2% target, delaying rate normalisation and maintaining negative real interest rate conditions favourable to precious metals
- Central bank gold accumulation accelerates beyond the current 244 tonnes quarterly pace as reserve diversification away from dollar-denominated assets broadens to additional central banks
- Financial market volatility escalates, amplifying institutional and retail safe-haven capital flows into physical precious metals
Downside Risk Scenarios
- Faster-than-expected geopolitical resolution unwinds the conflict-driven safe-haven premium embedded in current precious metals prices
- Industrial activity weakens materially in major manufacturing economies, reducing silver and platinum group metal demand below structural deficit levels
- A sharp global growth slowdown compresses commodity demand broadly, as occurred in 2008 before the subsequent recovery
The World Bank's own assessment characterises risks to the precious metals price outlook as tilted toward the upside, citing the asymmetric nature of geopolitical and inflationary risks in the current environment (World Bank Group, Commodity Markets Outlook April 2026). For further institutional commentary on where precious metals ceilings may form, Kitco's analysis of World Bank projections provides a useful supplementary perspective.
Critically, three of the four structural drivers behind the forecast, being inflation above target, central bank accumulation at scale, and silver's physical supply deficit, do not resolve with a ceasefire. These forces are independent of any single geopolitical outcome and would continue exerting upward pressure on precious metals prices even in a scenario where Middle East tensions ease materially.
The next major ASX story will hit our subscribers first
Portfolio Positioning in a Stagflationary Environment
The historical behaviour of precious metals within diversified portfolios during periods of simultaneous growth deceleration and price acceleration provides meaningful context for current positioning considerations. During the 1970s stagflationary period, gold appreciated by over 2,000% across the decade as real interest rates turned deeply negative and inflation eroded the purchasing power of both equities and fixed income.
For investors considering entry into precious metals after a 41% year-on-year gain from May 2025 to May 2026, the practical challenge is managing timing risk through a period of elevated volatility. Dollar-cost averaging addresses this directly by committing a fixed allocation on a regular schedule regardless of prevailing price. This systematic approach removes the requirement to identify precise entry points and builds a position through volatility rather than depending on predicting its direction.
The structural case for the World Bank precious metals forecast does not require geopolitical conditions to persist indefinitely, inflation to remain at current levels, or central bank buying to accelerate further. Even under more moderate versions of the current macro environment, the convergence of above-target inflation, constrained monetary policy, inelastic precious metals supply growth, and silver's physical market deficit creates conditions historically associated with sustained precious metals appreciation.
Frequently Asked Questions: World Bank Precious Metals Forecast 2026
What does the World Bank's 42% precious metals forecast actually measure?
The World Bank projects its precious metals price index will average 42% higher across all of 2026 compared to the full-year 2025 average. This is a full-year average comparison rather than a peak-to-trough or year-start to year-end measurement. Interim corrections during 2026 do not automatically invalidate this projection, because remaining months can average at higher levels to maintain the annual average target.
Which metals are included in the World Bank's precious metals index?
The World Bank's precious metals sub-index captures gold, silver, and platinum group metals. Gold and silver are the primary drivers of the 2026 projection given their combined monetary and industrial demand characteristics. Gold typically represents the largest weighting within the index given its trading volume and reserve asset status.
Why did gold fall from its January 2026 high if the macro case remains bullish?
Gold reached an all-time high of $5,589/oz on January 28, 2026, before correcting approximately 16% to around $4,703/oz by mid-May. Corrections of this magnitude are structurally normal within commodity bull markets. For historical comparison, gold fell sharply during the 2008 financial crisis before subsequently rallying to new highs over the following three years. The full-year average projection methodology means the forecast can remain valid even after a meaningful interim pullback.
Is silver expected to outperform gold in 2026?
Based on the structural analysis underpinning the World Bank precious metals forecast, silver carries greater percentage upside potential than gold in the current cycle. Silver is entering its sixth consecutive year of physical supply deficit while simultaneously benefiting from both safe-haven monetary demand and accelerating industrial consumption driven by solar, electric vehicles, and data centre buildout. Its lower absolute price relative to gold amplifies the percentage impact of equivalent demand increases.
What does the World Bank project for precious metals in 2027?
The World Bank projects an 8% decline in precious metals prices in 2027, contingent on supply normalisation and reduced geopolitical risk premiums. This projection assumes a degree of conflict resolution and macroeconomic stabilisation that is not yet visible in current data. Structural factors including central bank reserve diversification and silver's physical deficit are unlikely to resolve within a single year regardless of geopolitical developments.
How does central bank gold buying affect the forecast's durability?
Central banks purchased a net 244 tonnes of gold in Q1 2026 at a record average LBMA price of $4,873/oz. Sustained accumulation at all-time high prices indicates strategic reserve diversification rather than speculative positioning. Central banks operate on multi-year allocation frameworks and do not reverse strategic reserve decisions based on short-term price movements, providing a durable and institutionally consistent demand base beneath the market.
This article is intended for informational and educational purposes only. It does not constitute financial or investment advice. All projections, forecasts, and price targets referenced reflect published institutional research and are subject to change. Past performance is not a reliable indicator of future results. Readers should consult a qualified financial adviser before making any investment decisions. Commodity markets involve significant risk and investments may result in partial or total loss of capital.
Ready to Position Yourself Ahead of the Next Major ASX Mineral Discovery?
While the World Bank's 42% precious metals forecast signals a significant structural shift in commodity markets, Discovery Alert's proprietary Discovery IQ model delivers real-time alerts the moment significant ASX mineral discoveries are announced, transforming complex geological data into actionable investment insights for both short-term traders and long-term investors. Explore historic returns generated by major mineral discoveries and begin your 14-day free trial today to secure a market-leading edge before the broader market catches on.