June 6, 2026
Global energy markets operate within a delicate balance of supply chains, transportation routes, and geopolitical stability that can shift dramatically when international tensions escalate. The interconnected nature of modern energy infrastructure means that disruptions in strategic regions create cascading effects throughout the global economy, influencing everything from commodity prices to monetary policy decisions. When WTI soars after Trump vows more weeks of attacks, it exemplifies how political rhetoric can trigger immediate market volatility even before physical supply impacts materialise.
Understanding the Macro-Economic Impact of Energy Supply Disruptions
Energy supply disruptions represent one of the most immediate and far-reaching threats to global economic stability. When geopolitical tensions interrupt established trade flows, the effects extend well beyond temporary price spikes, creating structural changes in how economies function and interact.
The transmission mechanisms through which energy shocks propagate across economies operate through multiple channels. Direct transmission occurs when transportation and manufacturing sectors face immediate cost increases, typically within 24-48 hours of a supply disruption. These industries, heavily dependent on fuel inputs, must either absorb increased costs or pass them through to consumers, creating inflationary pressures.
Secondary transmission effects emerge over longer timeframes, typically 2-3 months, as consumer goods pricing adjusts and disposable income constraints reduce economic activity. Currency markets also react, with energy-importing nations experiencing depreciation pressure while energy exporters may see offsetting revenue gains.
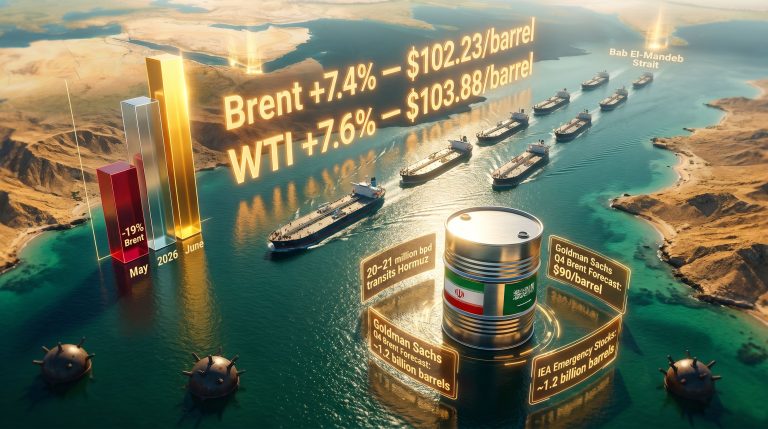
Historical data demonstrates the severity of these impacts. During the 2008 oil crisis, crude prices peaked near $147 per barrel in July, followed by a global recession beginning in Q4 2008. Furthermore, the recent oil price rally demonstrates how WTI soars after Trump vows more weeks of attacks scenarios continue to shape market dynamics.
Economic Elasticity and Market Response
The economic concept of elasticity reveals why energy disruptions create such acute volatility. Short-term elasticity of oil demand ranges from -0.1 to -0.3, meaning demand is highly inelastic. When prices increase by 10%, consumption typically decreases by only 1-3%, explaining why supply disruptions generate extreme price movements rather than proportional demand adjustments.
This inelasticity stems from several factors:
- Infrastructure lock-in effects where existing transportation and heating systems cannot quickly substitute alternative energy sources
- Economic necessity as energy powers essential services regardless of price
- Time constraints preventing rapid behavioural adaptation to price changes
Central banks face particular challenges during supply-driven energy inflation. Traditional monetary policy tools become less effective because interest rate changes cannot directly address supply constraints. The Federal Reserve and European Central Bank have historically struggled with the trade-off between controlling inflation and maintaining economic growth during energy crises.
When big ASX news breaks, our subscribers know first
Strategic Waterways and Global Energy Vulnerabilities
The concentration of global energy flows through narrow maritime passages creates systemic vulnerabilities that can reshape international economics overnight. These chokepoints handle disproportionate volumes of crude oil and refined products, making their disruption a catalyst for worldwide economic instability.
| Waterway | Daily Oil Flow | Global Trade Share | Primary Routes |
|---|---|---|---|
| Strait of Hormuz | 21 million bpd | 20-21% | Persian Gulf crude exports |
| Strait of Malacca | 15+ million bpd | 25-30% | Asian-bound crude |
| Suez Canal | 3.8 million bpd | 3-4% | Russian/African crude to Europe |
| Panama Canal | 0.5 million bpd | <1% | Limited crude flows |
The Strait of Hormuz represents perhaps the most critical single point of failure in global energy security. With a transit corridor approximately 21 nautical miles wide and shipping lanes only 2 nautical miles wide in each direction, this passage handles the bulk of Persian Gulf crude exports with no practical alternative routing.
Alternative Transportation Economics
When traditional supply routes become unavailable, the true cost of energy security becomes apparent through alternative transportation methods. Cape of Good Hope routing adds 10,000 kilometres and 25-30 days transit time compared to Suez Canal passage, increasing fuel consumption by 20-30% and transportation costs by 40-60%.
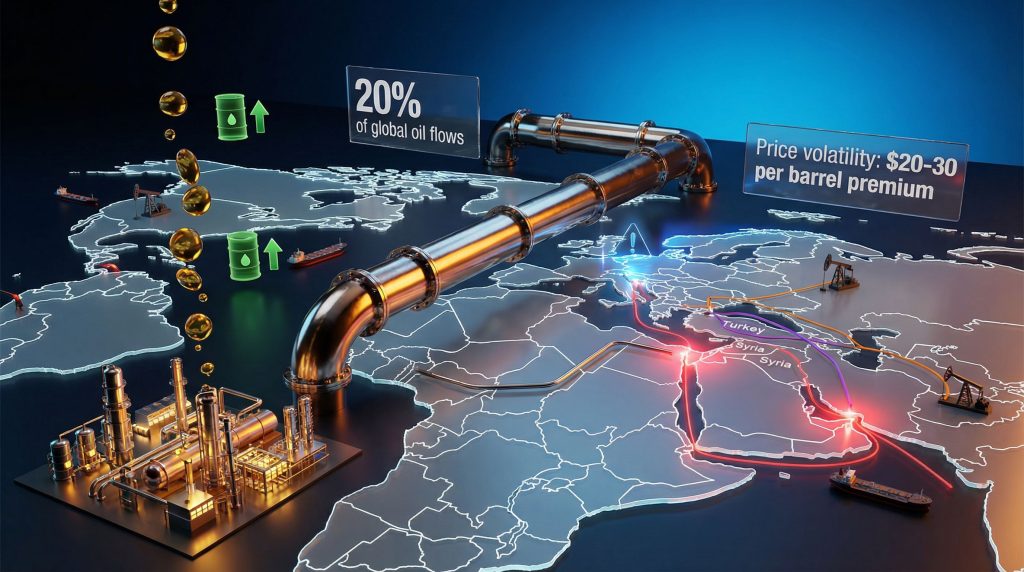
Pipeline alternatives offer different cost structures but limited capacity. However, OPEC market influence continues to shape global pricing dynamics. The Iraq-Turkey pipeline can handle 150,000-200,000 barrels per day under current conditions, with theoretical expansion potential to 400,000+ barrels per day given regional stability.
Overland trucking operations, while flexible, face severe scalability constraints. Current Syria route operations handle approximately 50,000 barrels per day, representing a fraction of maritime capacity while carrying cost premiums of 15-25% above traditional shipping methods.
Insurance markets provide another lens into chokepoint vulnerabilities. War risk insurance premiums for Gulf transits historically range 0.5-3% of cargo value, representing $2-15 million per standard supertanker load. During the 1984-1988 Tanker War, insurance premiums spiked 300%+ with some vessels becoming uninsurable at any price.
Military Escalations and Energy Market Dynamics
Military escalations trigger multi-layered market responses that amplify underlying supply concerns through speculative positioning and risk premium expansion. When WTI soars after Trump vows more weeks of attacks, scenarios demonstrate how political rhetoric can translate into immediate market volatility, even before physical supply impacts materialise.
The market response typically unfolds in three distinct phases:
Information Asymmetry Phase (Hours 0-12)
Initial price spikes reflect uncertainty premiums as futures markets react faster than physical supply assessments. Trading volumes surge as position liquidation accelerates, creating volatility that often exceeds fundamental supply impact by 30-50%.
Supply Assessment Phase (Hours 12-48)
Market participants evaluate actual production and export disruption magnitude. If physical disruption proves limited, prices typically correct downward rapidly. However, if material supply interruption occurs, elevated prices sustain and become embedded in forward curves.
Risk Premium Embedding (Days 2-30)
Geopolitical risk premiums become structural components of pricing. Academic research indicates speculative amplification can add 20-40% to fundamental supply impacts during crisis periods. During 2008, speculative long positioning peaked at 200,000+ contracts on NYMEX, adding an estimated $20-30 per barrel to underlying supply constraints.
Historical examples illustrate these patterns:
- Iraqi invasion of Kuwait (August 1990): $27 per barrel increase (+125%) within days, sustained for 6+ months
- September 11 attacks (2001): $5 per barrel increase (+10%), normalised within 3 weeks
- Saudi Aramco attack (2019): $15 per barrel spike (+12%) intraday, corrected within one week
Refinery Margin Compression Dynamics
Crack spread compression occurs when crude input costs rise faster than refined product prices can adjust. Under normal conditions, refiners maintain margins of 3-6% of crude value. During supply disruptions, when crude prices spike 20%+ while refined products lag by 8-12%, margins compress to 0-2% or turn negative.
Example calculation: If baseline crude trades at $100 per barrel generating refined products worth $108 per barrel (8% margin), a disruption driving crude to $125 (+25%) while products only reach $119 (+10%) creates a negative 4.8% margin, forcing refiners to operate at losses.
Refiners typically respond through utilisation rate reductions. During 2008, U.S. refiners cut utilisation from 85% to 78% by October as negative crack spreads persisted. Similar patterns emerged during the 2022 Ukraine crisis when European refiners initially maintained run rates but subsequently reduced operations by 5-10%.
European Energy Import Dependencies
European markets demonstrate acute vulnerability to Middle Eastern supply disruptions due to structural import dependencies developed over decades. The region's energy security framework relies heavily on established trade relationships and transportation routes that become critical failure points during geopolitical crises.
Import Dependency Analysis
| Product Category | Import Reliance | Primary Sources | Disruption Impact |
|---|---|---|---|
| Jet Fuel | 50% from Gulf region | Middle East integrated refineries | Potential price doubling |
| Diesel | 15-20% from Gulf region | Regional refinery networks | Supply shortage risks |
| Crude Oil | 25% from affected regions | Multiple OPEC sources | Alternative sourcing premiums |
Jet fuel vulnerability represents Europe's most acute exposure, with approximately 50% of imports sourcing from Gulf region refineries. This dependency explains why European jet fuel prices have historically doubled during Middle Eastern supply disruptions, reaching levels that threaten aviation industry profitability.
Diesel market exposure creates ripple effects throughout European transportation and heating sectors. With 15-20% of diesel imports originating from Gulf sources, disruptions force European buyers into competition with Asian markets for alternative supplies, driving regional price premiums.
Strategic Reserve Utilisation
European strategic petroleum reserves provide buffer capacity for 60-90 days of emergency consumption if released at maximum rates. However, reserve replacement during extended disruptions presents significant challenges, particularly if alternative supply sources demand premium pricing.
Coordinated release strategies among EU member states can maximise market stabilisation impact through timing and scale optimisation. Historical precedent from the 2011 Libya crisis demonstrated that strategic reserve releases can provide 2-4 weeks of market stability, buying time for alternative supply arrangements.
The International Energy Agency (IEA) coordinates member country reserve releases to prevent unilateral actions that might reduce overall effectiveness. Member countries maintain combined strategic reserves equivalent to approximately 4 billion barrels, though access and release timing depend on crisis severity assessments.
Pipeline Infrastructure and Alternative Routes
Pipeline infrastructure represents critical backup capacity during maritime route disruptions, though throughput limitations and geographic constraints restrict their ability to fully offset chokepoint closures. Northern route capacity through Turkey demonstrates both potential and limitations of alternative infrastructure.
Iraq-Turkey Pipeline Dynamics
Current Kirkuk crude flows to Turkey's Ceyhan terminal handle 150,000-200,000 barrels per day, with theoretical expansion potential reaching 400,000-430,000 barrels per day under optimal conditions. However, expansion requires Kurdistan region production restarts, currently prevented by security concerns.
Premium pricing dynamics emerge when pipeline routes become primary alternatives to maritime shipping. European buyers demonstrate willingness to pay significant premiums for Kirkuk crude delivered through Turkish infrastructure, reflecting supply scarcity and transportation security values.
Overland Transportation Networks
Syria route trucking operations represent emergency backup capacity with inherent scalability limitations. Current operations handle approximately 50,000 barrels per day of crude plus additional fuel oil volumes, though logistical constraints prevent material expansion.
Jordan corridor agreements provide additional overland capacity, historically handling 15,000 barrels per day under bilateral arrangements. Emergency expansion during crises can potentially triple this capacity, though costs remain substantially higher than maritime alternatives.
Transportation cost analysis reveals the economic impact:
- Maritime shipping: $3-5 per barrel for Gulf-to-Europe routes
- Pipeline transport: $8-12 per barrel including transit fees
- Overland trucking: $20-35 per barrel including security premiums
Central Banking Challenges During Energy Inflation
Energy-driven inflation creates complex policy dilemmas for central banks attempting to balance price stability with economic growth objectives. Traditional monetary policy tools face effectiveness limitations when inflation stems from supply constraints rather than demand pressures. Additionally, US economy tariffs further complicate monetary policy decisions during energy crises.
Policy Tool Constraints
Interest rate effectiveness becomes diminished during supply-driven inflation because rate increases cannot directly address production or transportation disruptions. The Federal Reserve's experience during the 1970s oil crises demonstrated how aggressive rate hikes can trigger recessions without resolving underlying supply problems.
Phillips Curve trade-offs become acute when central banks must choose between accepting higher inflation or risking employment losses through aggressive monetary tightening. The European Central Bank faces particular challenges given diverse economic conditions across member states.
International coordination requirements emerge when energy crises affect multiple economies simultaneously. G7 central bank cooperation during the 2008 financial crisis provided precedent for coordinated responses, though energy-specific crises present different challenges.
Inflation Transmission Mechanisms
Energy price increases transmit through economies via multiple channels with varying lag times:
- Immediate effects (0-30 days): Transportation fuel costs, utility pricing
- Short-term effects (1-3 months): Consumer goods pricing adjustments
- Medium-term effects (3-6 months): Wage pressure emergence, service sector pricing
- Long-term effects (6+ months): Structural inflation expectations shifts
Central banks typically see clear inflation signals 4-6 months after initial energy price shocks, limiting reactive policy effectiveness. This lag explains why energy crises often result in either delayed policy responses or preemptive actions based on incomplete information.
The next major ASX story will hit our subscribers first
Investment Strategy Evolution During Energy Volatility
Energy market volatility creates distinct investment opportunities and risks that require specialised portfolio management approaches. Institutional investors must navigate capital protection requirements while capturing opportunities created by market dislocations. Moreover, US oil production decline adds another layer of complexity to investment strategies.
Portfolio Allocation Adjustments
Energy sector overweighting becomes strategically attractive during supply disruption periods, though volatility requires careful position sizing. Energy equity performance historically outpaces broader markets by 200-400% during crisis periods, offset by extreme downside risks during resolution phases.
Currency hedging strategies gain importance for international energy investments as exchange rate volatility amplifies during crises. Energy-exporting currencies typically strengthen while importing nation currencies weaken, creating both opportunities and risks for global portfolios.
Alternative energy acceleration often receives increased investment attention during traditional energy crises, though commercialisation timelines limit immediate impact. Renewable energy projects gain political and financial support during fossil fuel supply disruptions.
Sector Rotation Dynamics
Transportation industry impacts vary significantly by subsector during energy price volatility:
- Airlines: Face immediate margin compression from jet fuel cost increases
- Trucking/logistics: Experience cost pass-through delays creating short-term pressure
- Shipping: May benefit from increased rates due to route disruptions
- Railways: Gain competitive advantages as fuel-efficient alternatives
Manufacturing competitiveness shifts occur as energy input costs affect different industries variably. Energy-intensive sectors like aluminium smelting, steel production, and petrochemicals face particular pressure, whilst service sectors experience delayed but persistent impacts.
Consumer discretionary vulnerability emerges as energy cost increases reduce disposable income. Historical analysis shows consumer spending patterns shift toward necessities during energy price spikes, affecting retail, entertainment, and luxury goods sectors.
Market Psychology and Risk Assessment
Energy market psychology during geopolitical crises demonstrates how fear and uncertainty can amplify fundamental supply disruptions through speculative positioning and risk premium expansion. Understanding these behavioural patterns provides insights into market timing and volatility management. Furthermore, oil prices continue to surge as tensions escalate globally.
Fear-Based Premium Expansion
Geopolitical risk premiums often exceed rational supply impact assessments during crisis periods. Market participants price worst-case scenarios rather than probable outcomes, creating opportunities for contrarian positioning once supply impacts clarify.
Volatility clustering occurs as uncertainty breeds additional uncertainty. High volatility periods tend to persist longer than fundamental factors suggest, reflecting information asymmetries and position adjustment requirements among market participants.
Liquidity provision challenges emerge when traditional market makers reduce activity during extreme volatility. This creates a feedback loop where reduced liquidity amplifies price swings, deterring further market participation.
Historical Risk Assessment Patterns
Analysis of past energy crises reveals consistent behavioural patterns:
- Initial overreaction (days 1-5): Prices spike beyond fundamental justification
- Reality assessment (weeks 2-4): Markets adjust based on actual supply impacts
- Premium normalisation (months 2-6): Risk premiums gradually decline absent continued disruptions
Successful investment strategies during energy volatility typically require:
- Position sizing discipline to manage extreme volatility
- Fundamental analysis focus to distinguish temporary disruptions from structural changes
- Contrarian timing to capitalise on sentiment-driven price extremes
- Geographic diversification to reduce concentration risks
Long-Term Economic Implications
Extended energy market disruptions create lasting modifications to global trade patterns, infrastructure investments, and strategic relationships that persist well beyond immediate crisis resolution. These structural changes reshape competitive advantages and economic geography. Additionally, OPEC production impact continues to influence long-term market dynamics.
Supply Chain Diversification
New trade relationships develop between previously disconnected regions as traditional suppliers become unavailable. Latin American crude exports to Asia, African gas shipments to Europe, and North American refined product exports globally demonstrate how crises accelerate geographic trade pattern evolution.
Infrastructure investment priorities shift toward strategic resilience rather than pure economic efficiency. Pipeline projects, storage terminal expansions, and alternative transportation route development receive increased political and financial support during and after energy crises.
Strategic partnership formations emerge as energy security becomes prioritised over cost optimisation. Long-term supply agreements, joint infrastructure projects, and integrated supply chains develop to reduce vulnerability to future disruptions.
Price Discovery Evolution
Benchmark crude adjustments reflect new supply realities as traditional pricing mechanisms prove inadequate during disrupted markets. Regional price differentials widen permanently due to transportation constraints and alternative routing costs.
Volatility premium embedding occurs when markets price higher base-level uncertainty into forward curves. Energy futures markets often maintain elevated volatility premiums for 12-24 months following crisis resolution, reflecting learned experience about disruption risks.
Financial market innovation typically accelerates during energy crises as participants seek better risk management tools. New derivative products, insurance mechanisms, and hedging strategies emerge to address revealed vulnerabilities.
The intersection of geopolitical tensions and energy market dynamics continues to demonstrate the fragility of global economic interconnectedness. As supply chain vulnerabilities become more apparent through repeated disruptions, the strategic value of energy security investments and diversification initiatives will likely increase substantially.
Market participants must prepare for extended periods of elevated volatility whilst governments reassess the balance between economic efficiency and strategic resilience in energy policy formulation. The lessons learned from current and historical energy crises will shape infrastructure development, trade relationships, and investment strategies for decades to come.
Disclaimer: This analysis is for educational purposes only and should not be considered investment advice. Energy markets carry substantial risks, and past performance does not guarantee future results. Readers should consult qualified financial professionals before making investment decisions based on geopolitical risk assessments or energy market volatility scenarios.
Ready to Navigate Energy Market Volatility?
Discovery Alert's proprietary Discovery IQ model delivers real-time notifications on significant ASX mineral discoveries that could benefit from energy sector volatility and supply chain disruptions. Subscribers receive actionable insights on energy-related commodities and alternative resource opportunities, helping position portfolios ahead of market shifts driven by geopolitical tensions and energy price movements. Begin your 14-day free trial today to gain a strategic advantage in volatile energy markets.

