August 20, 2026
When Volume Growth Meets Cost Pressure: Reading Australian Coal's Inflection Point
Large-scale thermal and metallurgical coal mining operates within one of the most capital-intensive, commodity-sensitive, and operationally demanding environments in the resources sector. For producers operating across multi-asset Australian portfolios, the interplay between production volume, input cost inflation, and realised pricing creates a margin equation that is perpetually in motion. Understanding how that equation evolves across a half-year reporting period requires looking well beyond headline tonnage figures, and the 1H 2026 results from Yancoal Australia offer a particularly instructive case study in that complexity.
Yancoal record production higher costs is not simply a story about operational success offset by fuel inflation. It is a window into how large coal producers manage the tension between short-term cost headwinds and longer-term strategic positioning, including balance sheet allocation, acquisition financing, and capital expenditure discipline during periods of commodity price strength. Furthermore, the coal supply challenges facing the broader sector in 2025 provide essential context for interpreting these results.
When big ASX news breaks, our subscribers know first
Yancoal's 1H 2026 Production Result: Breaking Down 19.8 Mt
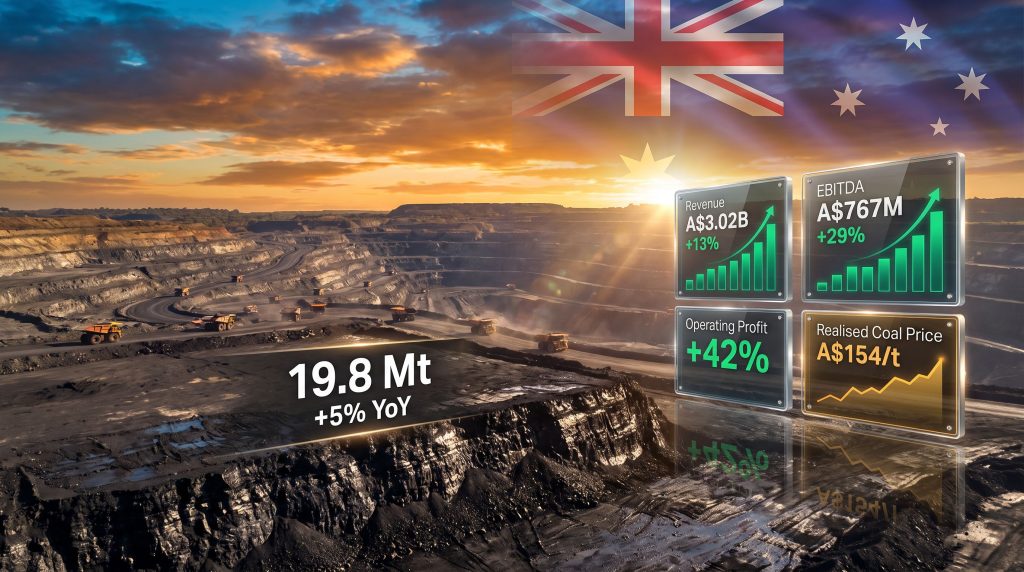
Yancoal's attributable saleable coal production reached 19.8 million tonnes (Mt) during the first half of 2026, a 5% increase on the 18.9 Mt recorded across the same period in 2025. On a 100% portfolio basis, total saleable production climbed 4% to 25.7 Mt, reflecting consistent operational delivery across the company's multi-mine asset base in New South Wales and Queensland.
What makes this result particularly notable is the acceleration visible within the period itself. The second quarter of 2026 contributed 10.8 Mt of attributable saleable coal, representing a 20% step-up from the 9.0 Mt delivered in the first quarter. That quarterly momentum is significant because it suggests the operational improvements driving the half-year record were not evenly distributed but rather concentrated in the back half of the period, implying a strong forward run-rate heading into 2H 2026.
For context, Yancoal achieved full-year attributable saleable production of 38.6 Mt in 2025, itself a strong result. With 19.8 Mt already secured through June 2026, the arithmetic required to surpass the prior annual record is relatively modest. Management has maintained its full-year guidance of 36.5 to 40.5 Mt, with operations specifically expected to deliver results in the upper half of that range.
| Scenario | Implied 2H 2026 Production | Full-Year Total |
|---|---|---|
| Lower half of guidance | ~16.7–18.7 Mt | 36.5–38.5 Mt |
| Upper half of guidance | ~18.7–20.7 Mt | 38.5–40.5 Mt |
| Record scenario (above 38.6 Mt) | >18.8 Mt required | >38.6 Mt |
With Q2 alone delivering 10.8 Mt, the production run-rate required to stay in the upper half of guidance is well within historical precedent, making a new annual production record the base case rather than an optimistic scenario.
Revenue and Earnings Growth: Separating Signal From Noise
The financial performance accompanying that production record tells a more nuanced story than volume growth alone.
| Financial Metric | 1H 2025 | 1H 2026 | Change |
|---|---|---|---|
| Revenue | ~$2.67B | $3.02B | +13% |
| EBITDA | ~$595M | $767M | +29% |
| Operating Profit | ~$231M | $328M | +42% |
| Profit After Tax | ~$170M | $17M | -90% |
| Realised Coal Price | ~$150/t | $154/t | +3% |
| Cash Operating Costs | ~$93/t | $96/t | +3% |
Revenue grew 13% to A$3.02 billion, driven by a combination of higher volumes and improved realised pricing. EBITDA expanded 29% to A$767 million, and operating profit increased 42% to A$328 million. These figures represent genuine operational leverage at work: the company produced more coal at a modestly higher cost per tonne, sold it at a slightly better price, and the combined effect amplified profitability at the earnings before financing line.
The dramatic divergence between operating profit growth of 42% and profit after tax falling 90% is not an operational story. It reflects A$272 million in non-operating items, including A$188 million tied to the annual accounting treatment of US-dollar-denominated loan obligations. These are non-cash, currency-translation adjustments and do not represent cash outflows from the business.
This distinction matters enormously for investors. A coal producer reporting a 90% decline in net profit might appear to be in structural distress. In Yancoal's case, the underlying business generated A$767 million in EBITDA during the same period. The divergence is entirely a function of how Australian accounting standards require the annual restatement of foreign-currency debt obligations when the Australian dollar moves relative to the US dollar. Investors relying solely on profit after tax as their primary performance lens risk fundamentally misreading this result.
Why EBITDA Is the Correct Lens for Capital-Intensive Coal Miners
Mining companies carry significant depreciation burdens from their long-lived physical asset bases, including underground longwall equipment, open cut draglines, processing infrastructure, and rail loading facilities. These assets depreciate over decades, and that depreciation charge flows through the income statement regardless of commodity prices or production volumes.
For a business like Yancoal, with multi-mine operations across New South Wales and Queensland, the gap between EBITDA and net profit after tax will almost always be substantial. Adding the distortion of non-cash currency adjustments on USD-denominated debt creates a secondary layer of noise that obscures the cash-generative reality of the operations. The A$767 million EBITDA result is the figure that most closely approximates the cash the business actually produced from its mining activities during the half. In addition, understanding commodity price impacts on mining company performance helps contextualise why this metric carries such weight.
Yancoal Record Production Higher Costs: Unpacking the Diesel Driver
Cash operating costs rising 3% to A$96 per tonne sits at the centre of the Yancoal record production higher costs narrative. The cause is straightforward: diesel fuel inflation. What is less widely understood is the precise mechanism through which diesel prices translate into per-tonne mining costs.
Open cut coal mining in Australia is an extraordinarily diesel-intensive activity. Large excavators and draglines consume fuel continuously during stripping operations, while fleets of rigid dump trucks haul overburden and coal across pit floors. Based on Yancoal's 2025 operational disclosures, diesel represents approximately A$7 per tonne of direct mining costs, making it one of the largest variable cost levers across the portfolio. When global crude oil markets tighten — as seen during periods of oil price rally driven by geopolitical factors — Australian diesel pump prices rise in response, and the effect flows directly and rapidly into per-tonne cost structures.
The distinction between cyclical and structural cost pressures is critical here:
- Cyclical pressures: Diesel and broader energy costs tied to global crude oil markets and geopolitical supply dynamics, which can reverse as market conditions shift
- Structural pressures: Labour costs, equipment maintenance cycles, and regulatory compliance expenditure, which tend to grow over time regardless of commodity price environments
- Mitigating factors: Yancoal's multi-asset scale provides natural cost averaging across sites, limiting the damage from any single operation experiencing localised cost blowouts
For full-year 2026, management has maintained cash operating cost guidance of A$90 to A$98 per tonne but has shifted expectations toward the upper half of that range due to sustained diesel price pressure. For context, Yancoal achieved a full-year cash operating cost of A$92 per tonne in 2025, itself a A$1 per tonne improvement on 2024. The current diesel environment represents a partial reversal of those prior efficiency gains.
Even at the upper boundary of guidance, however, the margin arithmetic remains compelling:
| Metric | 1H 2026 Value |
|---|---|
| Average Realised Price | A$154/t |
| Cash Operating Cost | A$96/t |
| Implied Cash Margin | ~A$58/t |
| Q2 Realised Price | A$160/t |
| Upper Cost Guidance | A$98/t |
| Implied Q2 Margin (upper bound) | ~A$62/t |
A cash margin of A$58 to A$62 per tonne at the upper end of cost guidance is not a stressed business. It is a highly profitable one operating in a part of the cost curve that most Australian thermal and semi-soft coking coal producers would regard as advantaged.
Realised Price Trajectory: What A$160/t in Q2 Actually Signals
The improvement in realised coal price from approximately A$150 per tonne in 1H 2025 to A$154 per tonne across 1H 2026 appears modest on a half-year basis. The quarterly decomposition, however, tells a more interesting story. Q1 2026 realised prices averaged significantly below the half-year figure, while Q2 2026 reached A$160 per tonne, representing a 9% improvement quarter on quarter.
What Is Behind the Q2 Price Improvement?
This sequential improvement likely reflects a combination of factors:
- Product mix optimisation, with a higher proportion of higher-energy or coking coal varieties shipped in Q2 relative to Q1
- Seasonal demand patterns from Asian power utilities, which typically increase thermal coal procurement ahead of northern hemisphere summer cooling demand
- Spot market tightening driven by supply disruptions elsewhere in the seaborne coal trade
Management expressed confidence in the sustainability of robust realised coal prices through the second half of 2026, though this should be interpreted as an operational expectation rather than a guaranteed outcome. Coal markets remain sensitive to Chinese import policy, Indian power sector demand, and any production disruptions across major exporting regions including Australia, Indonesia, and South Africa. Consequently, tracking metallurgical coal prices will remain important for assessing the durability of this pricing momentum.
The next major ASX story will hit our subscribers first
The Kestrel Acquisition: Strategic Logic and Funding Architecture
Yancoal closed the first half of 2026 with a cash position of A$2.1 billion, a balance that reflects both the strong cash generation of the operations and disciplined balance sheet management over prior periods. Approximately half of this cash balance will be deployed toward the US$1.85 billion acquisition of the Kestrel coal mine in Queensland's Bowen Basin, with debt financing covering the remainder.
Kestrel is a longwall underground operation producing premium hard coking coal, a product with meaningfully different market dynamics than thermal coal. Hard coking coal commands premium pricing in Asian steel markets due to its low-ash, low-sulphur, high-fluidity characteristics that are essential for blast furnace ironmaking. Adding Kestrel to Yancoal's predominantly thermal coal portfolio introduces genuine product diversification and exposure to steel sector demand cycles. Miningmagazine.com.au notes that this production record materially strengthens the strategic rationale for the Kestrel acquisition.
Several elements of the funding structure deserve attention:
- The acquisition avoids equity dilution, preserving per-share value for existing shareholders while still completing a transaction of substantial scale
- Funding through existing cash and new debt rather than equity issuance signals management confidence in the business's ongoing cash generation capacity
- Despite committing approximately A$1 billion in cash to the transaction, Yancoal simultaneously declared a fully franked interim dividend of A$0.07 per share, reinforcing the message that shareholder returns are not being sacrificed to fund growth
The use of franking credits attached to the dividend is also worth noting for Australian tax-resident investors. Fully franked dividends carry attached corporate tax credits that can offset personal income tax obligations, effectively increasing the after-tax return relative to an unfranked equivalent payment.
Capital Expenditure Deferral: Discipline or Constraint?
Attributable capital expenditure guidance was reduced from A$750 to A$900 million to A$600 to A$750 million for 2026. Management attributed this reduction to deliberate deferral of expenditure into 2027 rather than project cancellations. The implications of this shift are also relevant to evaluating mining project feasibility across similarly positioned Australian coal operations.
This distinction matters. A capex reduction driven by project cancellations signals either deteriorating project economics or a pullback in long-term growth ambition. A deferral driven by timing and cash allocation priorities signals something quite different: a management team actively sequencing capital deployment to preserve flexibility around the Kestrel acquisition without compromising the organic growth pipeline.
Deferring capex into 2027 while simultaneously progressing a near-US$2 billion acquisition reflects a capital allocation philosophy that prioritises balance sheet strength and acquisition capacity in the near term, with reinvestment into organic growth following once the acquisition financing structure has stabilised.
For investors evaluating the long-term production trajectory, the key question is whether deferred 2026 capex relates to sustaining expenditure, which maintains existing production capacity, or growth capex, which expands it. If the deferral is weighted toward growth projects, the 2027 production outlook may be affected. If it is predominantly sustaining capex that has been pushed into next year, the near-term production impact is likely to be minimal.
Understanding Longwall Mining and Why It Underpins Yancoal's Cost Position
A factor not always well understood by generalist investors is the role that mining method plays in cost structure. A significant portion of Yancoal's Australian production comes from underground longwall operations, a highly mechanised method in which a shearing machine traverses a coal seam face of several hundred metres, with hydraulic roof supports advancing progressively as extraction proceeds.
Longwall mining is capital-intensive to establish but delivers high production volumes per unit of labour once operational. The method achieves very high coal recovery rates from a given seam thickness, often exceeding 80%, and can sustain output at relatively low marginal cost per tonne once the longwall panel is commissioned and the equipment is amortised. This is why Yancoal record production higher costs remains a story of strong underlying profitability rather than structural deterioration.
The geological characteristics of Yancoal's Hunter Valley and Bowen Basin assets also contribute to cost competitiveness. Seam depths, thickness, gas content, and overburden ratios all influence mining cost, and Yancoal's portfolio generally operates in geological conditions that allow efficient extraction without the elevated gas management or deep-mine costs that affect some competing operations. As Proactive Investors reports, output climbing despite earnings headwinds from coal prices underscores the resilience of Yancoal's operational model.
Key Takeaways: Yancoal's 1H 2026 Results at a Glance
- Record first-half production of 19.8 Mt attributable saleable coal, up 5% year on year
- Revenue growth of 13% to A$3.02 billion, supported by higher volumes and improved pricing
- EBITDA expansion of 29% to A$767 million reflects genuine operational leverage at the mine level
- Cash operating costs at A$96 per tonne are trending toward the upper half of guidance due to diesel inflation
- Profit after tax of A$17 million is distorted by A$272 million in non-cash, non-operating accounting adjustments and should not be treated as a measure of operational performance
- Capex guidance reduced from A$750–900 million to A$600–750 million due to deliberate deferral into 2027
- Full-year guidance maintained at 36.5–40.5 Mt, with management confidence pointing to the upper half of the range
- Kestrel acquisition of US$1.85 billion to be funded through existing cash and debt, preserving shareholder equity
- Fully franked interim dividend of A$0.07 per share declared despite significant acquisition commitments
FAQ: Yancoal Record Production and Higher Costs
What drove Yancoal's record production result in 1H 2026?
Broad operational execution across the portfolio delivered 19.8 Mt of attributable saleable coal, with Q2 2026 alone reaching a quarterly record of 10.8 Mt. That Q2 figure was 20% higher than Q1, suggesting production systems were accelerating through the period rather than plateauing.
Why did profit after tax fall 90% while EBITDA grew 29%?
The divergence is explained by A$272 million in non-operating items, of which A$188 million relates to non-cash accounting adjustments for USD-denominated loan obligations. These entries are required under Australian accounting standards when exchange rates move between reporting periods. They do not represent cash leaving the business.
What is causing higher cash operating costs in 2026?
Elevated diesel prices are the primary driver, with diesel representing approximately A$7 per tonne of direct mining costs. Global fuel inflation has pushed per-tonne costs from around A$93 in 1H 2025 to A$96 in 1H 2026, with management expecting full-year costs to settle toward the upper portion of the A$90–A$98 guidance range.
How is Yancoal funding the Kestrel acquisition?
Approximately half of the A$2.1 billion cash balance held at 30 June 2026 will contribute to the US$1.85 billion Kestrel purchase price, with the remainder funded through new debt. The structure deliberately avoids equity issuance to prevent shareholder dilution.
Is Yancoal still paying dividends given the acquisition?
Yes. The company declared a fully franked interim dividend of A$0.07 per share, demonstrating that management regards the business as sufficiently cash-generative to sustain shareholder distributions even while committing to a major acquisition. This outcome reflects the Yancoal record production higher costs dynamic in its clearest form: strong cash generation enabling both growth investment and shareholder returns simultaneously.
This article is for informational purposes only and does not constitute financial advice. Past performance and historical production figures are not necessarily indicative of future results. Investors should conduct their own due diligence and consider seeking independent financial advice before making investment decisions. Forward-looking statements including production guidance and pricing expectations are subject to operational, market, and macroeconomic risks that could cause actual results to differ materially from those anticipated.
Want to Stay Ahead of Significant ASX Mineral Discoveries Before the Broader Market Does?
Discovery Alert's proprietary Discovery IQ model delivers real-time alerts on major ASX mineral discoveries, cutting through complex data to surface actionable opportunities for both short-term traders and long-term investors — explore historic discovery returns on the Discovery Alert discoveries page to see what early positioning in transformative finds has meant for investors, and begin your 14-day free trial today to secure a genuine market-leading edge.