July 21, 2026
When Supply Chains Depend on Two Countries, Concentration Risk Becomes Real
Commodity markets have a peculiar blind spot. When analysts model global copper supply, they often aggregate output figures into tidy national totals, smoothing over the internal dynamics that actually determine whether production rises or falls. Zambia copper output down in the first quarter of 2026 by 4.27% year-on-year reads as a straightforward contraction. However, the reality beneath it is considerably more nuanced, and for investors and industrial buyers tracking the copper supply crunch through Central Africa, that distinction matters enormously.
When big ASX news breaks, our subscribers know first
The Two-Tier Reality Inside Zambia's Copper Sector
Zambia's mining industry does not operate as a single homogeneous production system. It functions across two structurally distinct tiers: large-scale industrial operations with institutional capital, long-term mine plans, and professional workforces, and a small-scale artisanal sector characterised by informality, price sensitivity, and operational fragility.
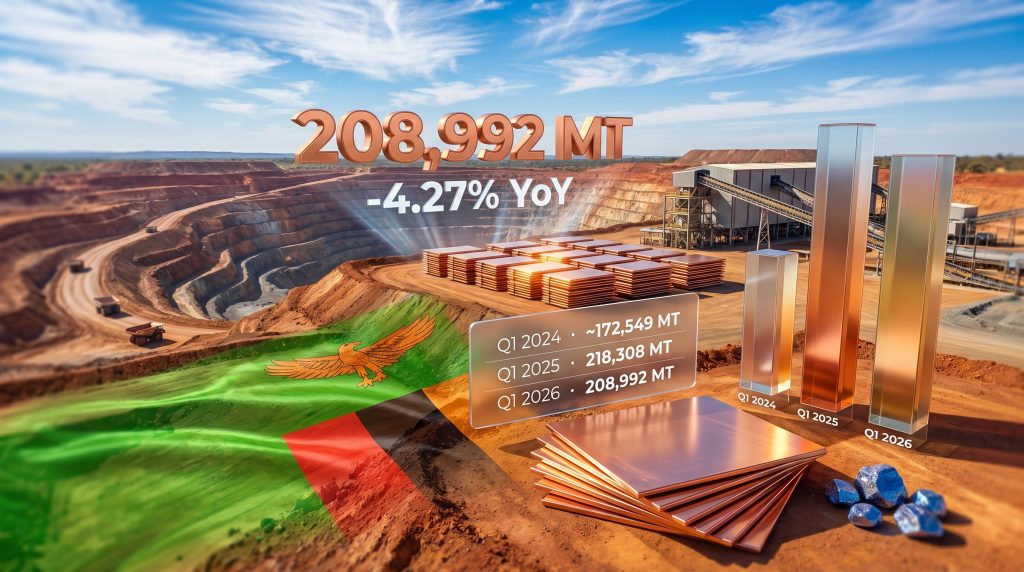
When Mines Minister Paul Kabuswe disclosed that Zambia copper output was down in the first quarter of 2026 to 208,992 metric tonnes, representing a 4.27% decline from 218,308 metric tonnes in Q1 2025, the figure landed as a negative headline. Furthermore, Kabuswe's accompanying clarification reframed the picture entirely: large-scale mine output actually grew by 1.8% year-on-year during the same period.
The operations driving that industrial-tier growth included:
- Lumwana Mine, which recorded positive output growth in the quarter
- Konkola Copper Mines (KCM), continuing its operational recovery following a near-complete production shutdown in prior years
- Mopani Copper Mines, sustaining growth momentum after a dramatic 58.5% year-on-year production surge in Q1 2025
- Several additional large-scale operations that collectively offset, at least partially, declines elsewhere in the industrial sector
The aggregate national total fell because the small-scale and artisanal mining segment contracted sharply enough to overwhelm the industrial-tier gains. This is not a peripheral detail. Small-scale mining in Zambia contributes a meaningful share of national copper output, but it is inherently volatile. Artisanal operators respond rapidly to copper price cycles, regulatory shifts, fuel cost changes, and seasonal disruptions. When margins compress or operating conditions deteriorate, output from this tier can fall precipitously with little advance warning.
The Q1 2026 aggregate decline should be read as a small-scale sector contraction, not a failure of Zambia's flagship industrial operations. These are fundamentally different production risks with different investment implications.
Production in Context: Reading the Three-Year Trend
A single quarter-on-quarter comparison rarely tells a complete story in mining. The relevant analytical frame for the Zambia copper production outlook is the multi-year trajectory, not just the twelve-month movement.
| Period | Output (Metric Tonnes) | YoY Change |
|---|---|---|
| Q1 2024 | ~172,549 | Baseline reference |
| Q1 2025 | 218,308 | +29.9% |
| Q1 2026 | 208,992 | -4.27% |
Viewed across this window, Zambia's Q1 2026 output remains substantially above Q1 2024 levels. The exceptional surge in Q1 2025 was partly a function of extraordinary circumstances: KCM had been operating at near-zero capacity following its earlier operational collapse, and its restart produced an outsized statistical rebound. Mopani similarly accelerated its ramp-up during that period.
When baseline comparisons are inflated by one-off recovery events, the subsequent quarter-on-quarter decline frequently reflects mean reversion rather than deterioration. According to reporting from The Star, this context is essential for how analysts interpret sequential data, as a 4.27% decline against a base inflated by two simultaneous major mine restarts is analytically distinct from a 4.27% decline against a stable, normalised production year.
Zambia's full-year 2025 copper output of approximately 890,346 metric tonnes fell short of the government's ambitious 1 million metric tonne annual target. Headwinds during that year included a tailings dam collapse at Sino-Metals Leach in February 2025 and a notable production drop at First Quantum Minerals' Trident operation due to lower ore grades.
The 1 Million Tonne Question
Zambia's government has maintained the 1 million metric tonne annual production target as a national mining policy objective. Based on Q1 2026's 208,992 metric tonne output, the implied annualised run rate sits at approximately 836,000 metric tonnes, meaningfully below the target threshold.
Closing that gap in 2026 would require:
- Sustained and accelerating large-scale mine output across Q2 through Q4
- A recovery in small-scale sector production, dependent on price incentives and operating conditions
- The absence of major unplanned operational disruptions at flagship mines
- Stable energy supply, particularly from hydropower, which remains sensitive to seasonal water levels in Zambia's reservoirs
None of these conditions are guaranteed, and their combined probability of simultaneous realisation is far from certain.
Cobalt's Steeper Decline: A Battery Metals Signal
Copper commands the headline, but cobalt's performance in Q1 2026 deserves independent scrutiny. Minister Kabuswe confirmed that Zambian cobalt production declined 9.15% year-on-year in the first quarter, a proportionally steeper contraction than copper's 4.27% fall. Consequently, the relationship between these two declines is not coincidental.
In Zambia, cobalt is almost entirely extracted as a by-product of copper ore processing. It does not have its own dedicated mine development economics; its output is derivative of copper production volumes, ore grades processed, and the specific processing routes employed at individual operations.
The fact that cobalt fell by more than twice the percentage rate of copper points to several possible explanations:
- Ore grade variability: If the copper ores processed in Q1 2026 carried lower cobalt grades than those processed in Q1 2025, cobalt output would fall disproportionately even at stable copper production volumes
- Processing route shifts: Some copper operations have flexibility in their metallurgical circuits. If processing shifted toward routes that are less cobalt-recovery-efficient, by-product cobalt output would decline without a corresponding copper loss
- Mine mix changes: The specific mines that grew or contracted in Q1 2026 may have different cobalt content profiles. A decline at a cobalt-rich operation and growth at a cobalt-lean one would produce exactly this outcome
For battery metals supply chain analysts, the cobalt decline carries additional significance given the broader critical minerals demand landscape. Cobalt remains a critical cathode material in certain lithium-ion battery chemistries, particularly those used in high-energy-density applications.
With the Democratic Republic of Congo accounting for the majority of global cobalt production, any sustained output contraction from Zambia as a secondary African supplier adds marginal but real pressure to an already concentrated global cobalt market.
Central Africa's Copper Corridor Under Simultaneous Pressure
The regional dimension of Q1 2026's data elevates it from a single-country production story to a supply chain risk narrative. Zambia is Africa's second-largest copper producer, and the DRC is the continent's largest. In Q1 2026, both experienced significant output contractions simultaneously: Zambia copper output was down 4.27% and the DRC's copper exports fell by almost 15% in the same quarter, according to Reuters reporting.
The convergence of these declines across both nations in the same quarter is noteworthy. Furthermore, the DRC cobalt export ban adds another layer of supply-side complexity to an already strained regional production corridor. Several structural pressures operate across the region simultaneously:
- Ore grade depletion at mature operations: Many of the Copperbelt's flagship deposits have been mined for decades, tightening production economics
- Infrastructure and logistics constraints: Road, rail, and port capacity through Central Africa's landlocked interior remains a persistent operational bottleneck
- Energy availability: Both Zambia and the DRC are heavily reliant on hydroelectric power, making reservoir levels a critical production variable
- Artisanal and small-scale sector sensitivity: Informal copper production across the region is highly responsive to commodity price cycles, creating rapid output swings
- Fiscal and regulatory uncertainty: Shifting royalty structures and licensing conditions affect investment climate and capital deployment timelines
The DRC's steeper 15% export decline compared to Zambia's 4.27% output contraction may reflect the additional complexity of export logistics, transit country constraints, or a more pronounced informal sector contraction in the DRC.
Why Copper's Demand Profile Amplifies Supply Disruptions
The strategic significance of Zambian and Congolese copper output extends well beyond African commodity markets. The copper demand drivers are being structurally elevated by three converging megatrends that are simultaneously scaling global consumption requirements.
Electric vehicles require substantially more copper per unit than conventional internal combustion engine vehicles. Conservative estimates suggest EVs use approximately 2.5 to 4 times more copper per vehicle, reflecting copper-intensive motors, wiring, charging infrastructure, and battery thermal management systems.
Renewable energy infrastructure including wind turbines, utility-scale solar installations, and grid modernisation projects is inherently copper-dependent. Offshore wind turbines in particular require significant copper volumes per megawatt of installed capacity.
Artificial intelligence data centre expansion is an emerging copper demand category that is increasingly being quantified by commodity analysts. Server infrastructure, power distribution systems, cooling architecture, and transmission capacity all require substantial copper volumes. Against this structural demand backdrop, even temporary supply contractions from major producing nations carry amplified price signal implications.
The next major ASX story will hit our subscribers first
Key Variables Shaping Zambia's Output for the Rest of 2026
| Variable | Constructive Scenario | Risk Scenario |
|---|---|---|
| Large-scale mine performance | Sustained 1-2% YoY growth continues at KCM, Mopani, Lumwana | Grade deterioration or unplanned stoppages reverse gains |
| Small-scale sector recovery | Copper price strength lifts informal output | Continued contraction if prices soften |
| Energy availability | Improved hydropower supports smelter capacity | Drought-related power shortfalls constrain processing |
| Infrastructure investment | New processing capacity reaches operational readiness | Capital project delays extend the supply gap |
| Regulatory environment | Stable fiscal terms maintain foreign investment confidence | Royalty changes deter new capital deployment |
The interaction between these variables is non-linear. A strong copper price environment might simultaneously boost large-scale mine economics and incentivise small-scale sector recovery, compressing the production gap more rapidly than linear projections would suggest. Conversely, a power supply disruption during peak processing periods could constrain both tiers regardless of other favourable conditions.
Frequently Asked Questions
How much copper did Zambia produce in Q1 2026?
Zambia produced 208,992 metric tonnes of copper in the first quarter of 2026, combining output from both large-scale industrial mines and small-scale operators, as confirmed by Mines Minister Paul Kabuswe. CNBC Africa's coverage of the announcement provides additional context on the ministerial disclosure.
Why was Zambia copper output down in the first quarter of 2026?
The 4.27% year-on-year decline was primarily driven by a contraction in small-scale mining output. Large-scale industrial mines collectively grew production by 1.8% over the same period, meaning the sector-wide decline is concentrated in the artisanal and small-scale segment. The exceptionally high Q1 2025 baseline, inflated by the simultaneous restarts of KCM and Mopani, also contributed to the unfavourable comparison.
Which Zambian copper mines increased production in Q1 2026?
Lumwana Mine, Konkola Copper Mines, and Mopani Copper Mines all recorded production gains in Q1 2026, contributing to the 1.8% aggregate growth recorded across the large-scale mining tier.
What happened to Zambia's cobalt output in Q1 2026?
Zambia's cobalt production fell 9.15% year-on-year in Q1 2026, a proportionally steeper decline than copper, reflecting the by-product nature of cobalt extraction and likely shifts in ore grades and processing routes employed across key operations during the quarter.
Is Zambia on track to reach 1 million tonnes of copper in 2026?
Based on Q1 2026 output, Zambia's annualised production rate sits at approximately 836,000 metric tonnes, short of the 1 million tonne target. Reaching this milestone would require meaningful acceleration across the remaining three quarters, driven by both large-scale and small-scale sector performance.
How does the DRC's decline compare to Zambia's?
The DRC, Africa's largest copper producer, recorded a copper export decline of almost 15% in Q1 2026, significantly steeper than Zambia's 4.27% output contraction. The simultaneous contraction across both Central African producers represents a notable combined supply signal for global copper markets.
This article is intended for informational purposes only and does not constitute financial advice or a recommendation to buy or sell any commodity, security, or financial instrument. Production forecasts, demand projections, and market impact assessments involve inherent uncertainty and should not be relied upon as definitive guidance. Readers should conduct their own research and consult qualified financial advisers before making investment decisions.
Want to Stay Ahead of Significant ASX Copper and Critical Mineral Discoveries?
Discovery Alert's proprietary Discovery IQ model delivers real-time alerts the moment significant mineral discoveries hit the ASX, cutting through complex data to surface actionable opportunities in copper, cobalt, and other critical commodities — exactly the kind of supply-constrained sectors analysed above. Explore how major mineral discoveries have historically generated substantial returns on Discovery Alert's dedicated discoveries page, and begin your 14-day free trial today to position yourself ahead of the broader market.