July 30, 2026
The Architecture of Battery Market Power: Understanding What the Numbers Really Mean
Most industries tolerate oligopolies. The global EV battery market share CATL and BYD command has moved well beyond that point. When a single company controls more than 40% of a worldwide market measured in hundreds of gigawatt-hours, and a national cohort of seven firms collectively controls nearly three-quarters of total supply, the conventional language of market competition begins to feel inadequate. Understanding how this concentration formed, why it is deepening, and what it means for the broader electrification economy requires more than a read of the headline figures.
Battery installation share, the primary metric used by South Korean research firm SNE Research, measures actual GWh of battery capacity physically installed in electric vehicles during a given period. This is distinct from nameplate production capacity, which measures what a factory could theoretically output. Installation share reflects real-world commercial relationships, customer delivery volumes, and operational execution. For investors and supply chain analysts, it is arguably the more meaningful of the two figures, capturing demand pull rather than supply push.
With that methodological foundation established, the early 2026 data reveals a market undergoing structural consolidation at pace.
When big ASX news breaks, our subscribers know first
Global EV Battery Installations in Early 2026: The Macro Backdrop
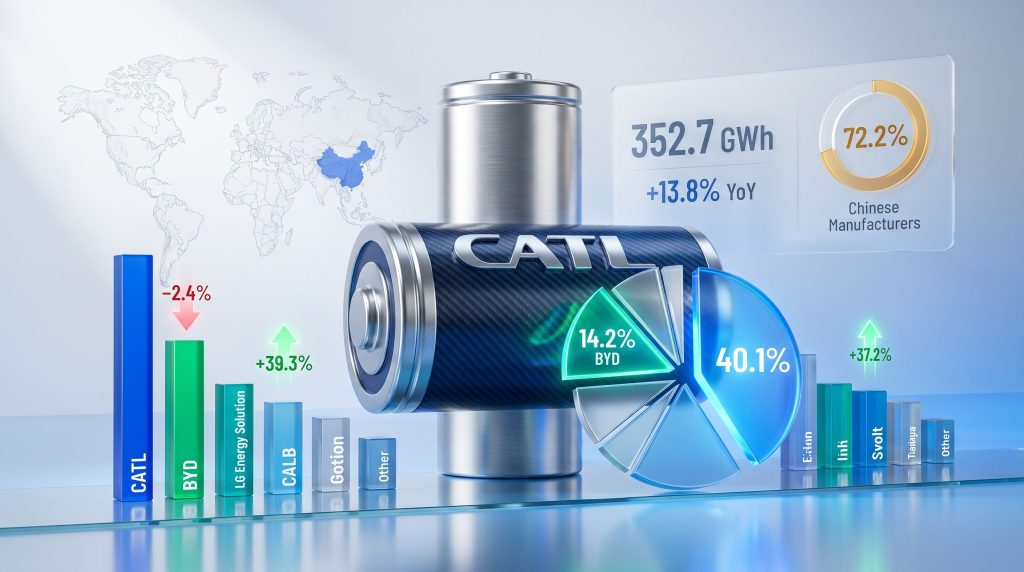
Total global EV battery installations reached 352.7 GWh across January through April 2026, representing 13.8% year-on-year growth according to SNE Research data published by CnEVPost. That growth rate, while moderating slightly from some of the more aggressive expansion periods seen in 2023 and 2024, confirms that electrification momentum remains firmly intact across major vehicle markets.
To contextualise the scale: 352.7 GWh across four months implies an annualised run rate of roughly 1,058 GWh, a figure that would have seemed extraordinary even three years ago. The sustained double-digit growth rate signals that global EV adoption has not plateaued, even as individual markets experience uneven demand patterns.
The Top 10 Global EV Battery Manufacturers: January–April 2026
| Rank | Company | Country | Market Share (%) | Installations (GWh) | YoY Growth |
|---|---|---|---|---|---|
| 1 | CATL | China | 40.1% | 141.4 | +19.8% |
| 2 | BYD | China | 14.2% | 50.0 | -2.4% |
| 3 | LG Energy Solution | South Korea | 9.1% | 32.0 | +8.3% |
| 4 | CALB | China | 5.1% | 18.1 | +39.3% |
| 5 | Gotion High-tech | China | 4.4% | 15.6 | +30.2% |
| 6 | SK On | South Korea | 3.5% | 12.3 | -7.9% |
| 7 | Panasonic | Japan | 3.4% | 12.0 | -3.7% |
| 8 | Eve Energy | China | 3.3% | 11.5 | +30.3% |
| 9 | Svolt Energy | China | 2.6% | 9.3 | +37.2% |
| 10 | Sunwoda | China | 2.5% | 8.7 | +17.6% |
| – | Others | – | 11.8% | 41.7 | – |
Source: SNE Research, January–April 2026, via CnEVPost
The table above encodes a structural story that transcends individual company performance. Seven of the ten entries are Chinese firms. The three non-Chinese players — LG Energy Solution, SK On, and Panasonic — all registered either declining volumes or growth rates trailing the market average. Furthermore, the competitive gap between the top two and the third-ranked player exceeds 31 percentage points, a moat that is widening rather than narrowing.
CATL's Global Battery Dominance: Dissecting the Lead
CATL's position in the global EV battery market share rankings is not a recent phenomenon, but the degree of that dominance in early 2026 represents a new high-water mark. The company installed 141.4 GWh across January through April 2026, a 19.8% year-on-year increase that meaningfully outpaced the broader market's 13.8% growth rate.
CATL's Market Share Trajectory: A Multi-Period View
Tracking CATL's share across consecutive measurement windows reveals a pattern of structural consolidation rather than cyclical noise:
| Period | CATL Global Share |
|---|---|
| Jan–Mar 2025 | 38.3% |
| Jan–Sep 2025 | 36.6% |
| Full-Year 2025 (est.) | ~39.2% |
| Jan–Mar 2026 | 40.7% |
| Jan–Apr 2026 | 40.1% |
The slight sequential moderation from 40.7% in the first quarter to 40.1% across the first four months is less significant than the year-on-year comparison, which shows an improvement from 38.1% in January–April 2025 to 40.1% in the same period of 2026. That nearly two percentage point gain in a market growing at 13.8% represents genuine share capture, not passive volume growth.
Within China specifically, CATL's domestic power battery market share reached 46.64% in April 2026 alone, rising 1.1 percentage points from March, according to CnEVPost. This domestic reinforcement is strategically important: CATL's home market strength provides the volume base and R&D funding that underwrites its international expansion. Consequently, market concentration in the EV battery industry continues to intensify as these dynamics compound.
What Is Driving CATL's Growth?
Several structural factors explain why CATL continues to expand its lead:
- Dual-chemistry portfolio depth: CATL's ability to offer both LFP (lithium iron phosphate) and NCM (nickel manganese cobalt) chemistry batteries allows it to serve budget urban EVs and premium long-range vehicles from a single manufacturing ecosystem. This versatility is something most competitors cannot replicate at equivalent scale.
- OEM supply breadth: Unlike BYD, which primarily supplies its own vehicles, CATL maintains long-term supply agreements with a broad roster of global automakers spanning European, North American, and Asian OEMs. This diversification insulates CATL from any single customer's volume fluctuations.
- Vertical integration: From battery management systems through to cell manufacturing and recycling infrastructure, CATL's integrated model creates compounding cost advantages that widen over time.
- International manufacturing expansion: CATL's European gigafactory development in Hungary represents a structural growth vector that could significantly expand its Western installation share over a two-to-four-year horizon, independent of trade tariff dynamics.
A battery manufacturer growing its installation share by nearly two full percentage points in a market expanding at 13.8% is not riding a tide. It is actively displacing competitors at multiple market tiers simultaneously.
BYD's Battery Position: The Paradox of a Declining Share
BYD's situation in the global EV battery market share rankings presents one of the more analytically interesting paradoxes in early 2026 data. The company's vehicle sales remain robust, yet its battery installation share contracted meaningfully on a year-on-year basis.
BYD's Market Share Trend
| Period | BYD Global Share |
|---|---|
| Jan–Mar 2025 | 16.7% |
| Jan–Sep 2025 | 17.9% |
| Full-Year 2025 (est.) | ~16.4% |
| Jan–Mar 2026 | 13.7% |
| Jan–Apr 2026 | 14.2% |
BYD installed 50.0 GWh across January through April 2026, a 2.4% year-on-year decline, making it the only top-two player to register an absolute volume contraction in a market growing at nearly 14%. Its share fell from 16.5% in the comparable prior-year period to 14.2%, a decline of 2.3 percentage points.
Why Is BYD's Battery Share Contracting?
Understanding BYD's divergence from CATL requires appreciating a fundamental structural difference between the two companies. BYD operates a largely captive battery supply model: its Fudi Battery subsidiary produces primarily for BYD's own vehicle lineup, with third-party supply representing a much smaller portion of total output compared to CATL's broad customer base.
Several interconnected dynamics appear to be contributing to the share decline:
- PHEV mix shift: BYD has been aggressively expanding its plug-in hybrid (PHEV) lineup, including models like the Sealion 06 DM-i. PHEVs carry substantially smaller battery packs than pure battery electric vehicles (BEVs), meaning that even strong PHEV sales volume can generate proportionally less GWh installation than an equivalent BEV sales mix.
- Limited third-party supply growth: BYD's external battery supply to other automakers has not grown at the pace required to offset the market denominator expanding by 13.8%. CATL's external customer base, by contrast, is actively broadening.
- Denominator effect: When the total market grows rapidly, a manufacturer that grows more slowly — or contracts slightly — loses share arithmetically, even if its absolute performance appears reasonable in isolation.
The sequential improvement from 13.7% in January–March to 14.2% in January–April suggests some month-to-month stabilisation, however the year-on-year trajectory remains one of meaningful share erosion.
The Combined Duopoly: 54.3% of the Global Market
Despite BYD's relative underperformance, the CATL-BYD duopoly's combined grip on the global EV battery market remains extraordinarily tight.
| Period | CATL Share | BYD Share | Combined Share |
|---|---|---|---|
| Jan–Mar 2025 | 38.3% | 16.7% | 55.0% |
| Jan–Sep 2025 | 36.6% | 17.9% | 54.5% |
| Full-Year 2025 (est.) | 39.2% | 16.4% | 55.6% |
| Jan–Apr 2026 | 40.1% | 14.2% | 54.3% |
The combined share has held structurally above 54% across every measured period. What the table also reveals is an internal power shift within the duopoly: CATL's share is expanding while BYD's is moderating, suggesting that the intra-Chinese competitive dynamic is resolving — at least in battery installation terms — in CATL's favour.
For the remaining market participants, this duopoly dynamic creates a compressed competitive environment. The 45.7% of global installations not controlled by CATL or BYD is divided across eight ranked players and a fragmented others category, with no single non-Chinese competitor holding more than 9.1% of global share.
The Rising Chinese Tier: CALB, Gotion, Eve, Svolt, and Sunwoda
The headline dominance of CATL and BYD can obscure an equally important dynamic occurring further down the rankings. China's second-tier battery manufacturers are growing at rates that significantly outpace both the market average and their non-Chinese competitors.
| Company | Jan–Apr 2026 Share | YoY Growth | vs. Market Average |
|---|---|---|---|
| CALB | 5.1% | +39.3% | +25.5 pp |
| Svolt Energy | 2.6% | +37.2% | +23.4 pp |
| Eve Energy | 3.3% | +30.3% | +16.5 pp |
| Gotion High-tech | 4.4% | +30.2% | +16.4 pp |
| Sunwoda | 2.5% | +17.6% | +3.8 pp |
CALB's 39.3% year-on-year growth to 18.1 GWh installed represents the most aggressive expansion in the top ten outside the duopoly. Svolt Energy's 37.2% growth rate is the second-fastest in the entire rankings. Collectively, these five companies are growing at rates between 17.6% and 39.3%, all substantially above the 13.8% market average.
This pattern suggests that Chinese battery market share expansion is not confined to CATL's dominance. It is, in fact, a multi-tier phenomenon, with the emerging layer of Chinese manufacturers simultaneously gaining ground on Japanese and South Korean rivals across the competitive spectrum.
The next major ASX story will hit our subscribers first
Non-Chinese Battery Makers: Growing in Volume, Losing in Share
The performance of LG Energy Solution, SK On, and Panasonic in early 2026 illustrates a structural challenge that volume growth alone cannot resolve: when the market expands faster than you do, your share contracts regardless.
LG Energy Solution installed 32.0 GWh, growing 8.3% year-on-year, yet its global share fell from 9.5% to 9.1%. It holds third position globally, but the gap between it and the second-ranked player exceeds 18 GWh.
SK On experienced actual volume contraction, with installations falling 7.9% year-on-year to 12.3 GWh. Its share declined from 4.3% to 3.5%, a drop attributed to weakening EV demand among its major North American and European OEM customers. This customer concentration risk highlights a structural vulnerability that differs sharply from CATL's diversified supply relationships.
Panasonic's 3.7% volume decline to 12.0 GWh reflects a comparable concentration risk: heavy dependence on Tesla as a primary customer means that any moderation in Tesla's regional sales directly impacts Panasonic's installation volumes. Its share dropped from 4.0% to 3.4%.
| Cohort | Combined Share (Jan–Apr 2026) | YoY Change |
|---|---|---|
| Chinese firms (7) | 72.2% | +2.1 pp |
| Non-Chinese firms (3) | 16.0% | -2.1 pp |
The symmetry is precise: Chinese firms gained exactly 2.1 percentage points, non-Chinese firms lost exactly 2.1 percentage points.
Critical Mineral Demand and Upstream Supply Chain Implications
The concentration of global EV battery market share in Chinese hands carries consequences that extend well beyond the battery sector itself. Shifts in the battery raw materials market are increasingly shaped by CATL and BYD's combined procurement of lithium, cobalt, nickel, and manganese at their current scale, giving them structural leverage over upstream critical mineral pricing cycles.
A manufacturer controlling 40.1% of global battery installations is, by extension, one of the most influential single demand signals in the lithium carbonate and lithium hydroxide markets. When CATL adjusts its chemistry preferences — whether toward LFP formulations that require no cobalt and less nickel, or toward higher-energy-density NCM variants — the upstream mineral demand curve shifts meaningfully.
Furthermore, the broader picture of critical minerals demand across the energy transition reinforces just how consequential these chemistry decisions are. For lithium project developers and critical mineral investors, tracking CATL's chemistry deployment decisions represents a material input to demand forecasting. The company's preference for LFP in mass-market vehicles, for instance, has contributed to structural softness in cobalt demand even as overall battery installations have grown substantially.
However, lithium demand growth driven by battery storage expansion continues to underpin long-term project economics, even where short-term lithium oversupply challenges weigh on spot pricing. In addition, Chinese battery recycling advances are beginning to create closed-loop supply dynamics that further entrench Chinese manufacturers' cost advantages over the medium term.
Geopolitical Dimensions and the Supply Chain Resilience Challenge
The 72.2% Chinese share of global EV battery installations sits at the intersection of energy policy, trade relations, and industrial strategy across multiple jurisdictions. Western governments have pursued domestic battery manufacturing capacity through frameworks including the US Inflation Reduction Act and the EU Battery Regulation, which establish localisation requirements and sustainability standards for batteries sold in those markets.
The practical tension is significant: Chinese battery manufacturers hold substantial cost advantages derived from scale, vertically integrated supply chains, and established manufacturing expertise. Replicating these advantages domestically in Western markets requires sustained capital investment over multi-year horizons. Until that capacity matures, a structural dependency on Chinese battery supply will persist for much of the global EV industry.
The efficiency gap between Chinese and non-Chinese battery manufacturers is not simply a labour cost story. It reflects accumulated manufacturing learning curves, upstream mineral processing integration, and chemistry R&D depth that have compounded over more than a decade of state-prioritised industrial development.
What Scenarios Could Shift the Competitive Balance?
| Scenario | Likely Beneficiary | Indicative Timeframe |
|---|---|---|
| Western EV demand recovery accelerates | LG Energy Solution, SK On | 2–3 years |
| BYD expands third-party supply base | BYD | 1–2 years |
| CATL's European gigafactory ramp-up | CATL | 2–4 years |
| Trade restrictions escalate on Chinese cells | Non-Chinese players | 2–5 years |
| Solid-state battery commercialisation | Varied early movers | 5–10 years |
Disclaimer: The scenarios above represent analytical projections only and should not be construed as investment advice. Market share dynamics in the EV battery sector are subject to rapid change driven by technology shifts, regulatory changes, and macroeconomic conditions.
Frequently Asked Questions
What is CATL's global EV battery market share in 2026?
CATL held a 40.1% global EV battery market share in January–April 2026, based on SNE Research data. Its installations totalled 141.4 GWh, representing 19.8% year-on-year growth, compared to a 38.1% share in the same period of 2025.
What is BYD's global EV battery market share in 2026?
BYD held 14.2% of the global market in January–April 2026, placing it second globally despite a 2.4% year-on-year decline in absolute installation volumes to 50.0 GWh. Its share fell from 16.5% in the comparable prior-year period.
How much of the global EV battery market do Chinese companies control?
Seven Chinese companies in the top 10 collectively held 72.2% of the global EV battery market in January–April 2026, an increase of 2.1 percentage points compared to the same period of 2025.
Why is BYD losing battery market share while CATL is gaining?
BYD's captive supply model primarily serves its own vehicles, and its product mix has shifted toward plug-in hybrids with smaller battery packs. CATL supplies a broad range of global OEMs and has been growing its external customer base, enabling it to capture a disproportionate share of overall market volume growth.
Who are the top 10 EV battery manufacturers globally in 2026?
As of January–April 2026: CATL (40.1%), BYD (14.2%), LG Energy Solution (9.1%), CALB (5.1%), Gotion High-tech (4.4%), SK On (3.5%), Panasonic (3.4%), Eve Energy (3.3%), Svolt Energy (2.6%), and Sunwoda (2.5%). Source: SNE Research via CnEVPost.
Key Takeaways: The State of Global EV Battery Competition in 2026
- The global EV battery market reached 352.7 GWh in January–April 2026, growing 13.8% year-on-year
- CATL commands 40.1% of global installations, its strongest early-year reading in at least two years, up from 38.1% in the prior-year period
- BYD holds 14.2% of global share, maintaining second place but experiencing year-on-year erosion from 16.5%
- The global EV battery market share CATL and BYD hold combined stands at 54.3% of global installations, a share that has remained structurally above 54% across all recent measurement periods
- Seven Chinese firms collectively account for 72.2% of global EV battery installations, up 2.1 percentage points year-on-year
- Non-Chinese competitors including LG Energy Solution, SK On, and Panasonic are all losing share in relative terms despite two of the three growing in absolute volume
- Second-tier Chinese manufacturers including CALB, Svolt, Eve Energy, and Gotion are growing at rates of 30% to 39%, well above the market average, indicating multi-tier Chinese consolidation
- The structural trajectory points toward further Chinese share concentration unless significant technology disruption — such as solid-state battery commercialisation — or trade policy intervention materially reshapes the competitive landscape
This article is based on SNE Research data published via CnEVPost (June 2, 2026) and publicly available market information. All forward-looking statements, scenarios, and projections represent analytical perspectives only and do not constitute financial or investment advice. Past market share trends are not necessarily indicative of future outcomes.
Want to Know Which ASX Mineral Discoveries Could Benefit From the Critical Minerals Boom?
Discovery Alert's proprietary Discovery IQ model delivers real-time alerts the moment significant ASX mineral discoveries are announced — including lithium, cobalt, nickel, and manganese plays tied to the surging demand for EV battery materials — ensuring subscribers can act on actionable opportunities well ahead of the broader market. Explore historic examples of major mineral discoveries and their returns, then begin your 14-day free trial at Discovery Alert to position yourself at the forefront of the critical minerals opportunity.