
July 23, 2026
When Oil Has Nowhere to Go: Understanding Iran's Storage Crisis
Global energy markets have always been shaped by chokepoints. From the Suez Canal closures of the 1950s and 1970s to the tanker wars of the 1980s, maritime geography has repeatedly demonstrated its ability to override production economics and reshape supply balances almost overnight. The Strait of Hormuz, a waterway barely 33 kilometres wide at its narrowest point, carries roughly 20% of all globally traded oil through its shipping lanes. Iran oil storage shrinks amid US blockade conditions, and when that corridor is disrupted, the consequences ripple through every crude benchmark on earth.
The events unfolding since early April 2026 represent one of the most acute stress tests this waterway has faced in decades. Iran's oil storage infrastructure is filling rapidly, its export capacity has collapsed, and the financial damage — while temporarily cushioned by payment cycles and transit lags — is accumulating at a rate that cannot be absorbed indefinitely. Tracking current crude oil prices helps contextualise just how severe the downstream effects of this disruption are becoming.
When big ASX news breaks, our subscribers know first
The Physical Arithmetic of a Storage Crisis
Understanding why Iran's situation has become so severe requires grasping a basic operational reality: oil production and oil exports must stay broadly in balance, or storage infrastructure absorbs the difference until it can't.
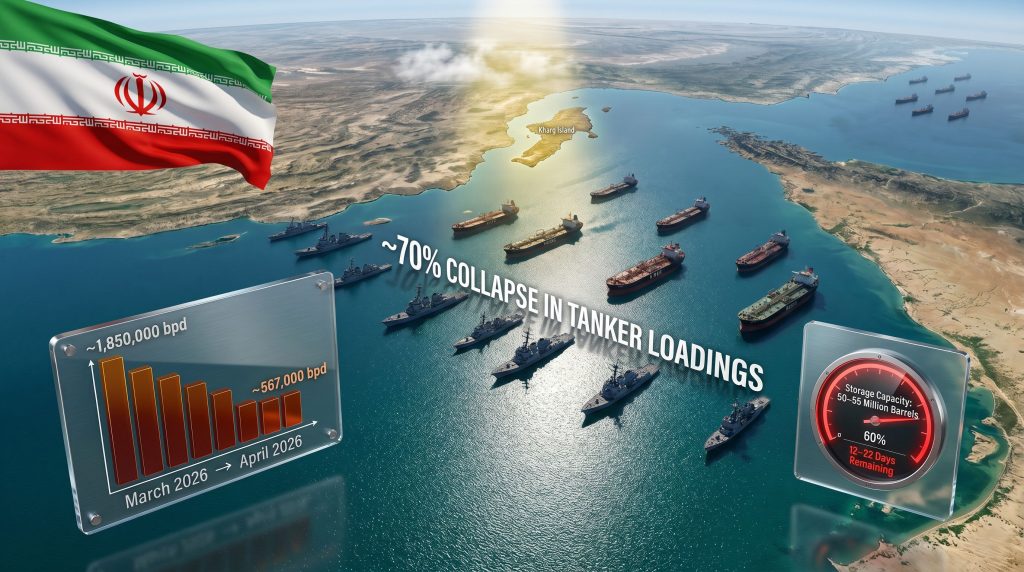
Iran's total onshore crude storage network holds an estimated 50 to 55 million barrels at maximum capacity. Before the US naval blockade intensified, approximately 60% of that capacity was already occupied, meaning the effective buffer was roughly 20 to 22 million barrels. With production continuing at an estimated 3.0 to 3.5 million barrels per day (bpd), and exports collapsing sharply, that buffer has been eroding at an alarming rate.
According to Kpler, Iran had between 12 and 22 days of unused storage capacity remaining as of late April 2026 — a leading commodity analytics and maritime intelligence firm. That window places a potential storage overflow event around mid-May 2026.
This is not merely a statistical threshold. When storage tanks approach capacity, upstream operators face a binary choice: curtail production at the wellhead, or risk infrastructure damage. There is no third option.
Why Kharg Island Is the Linchpin
Iran's export infrastructure is heavily concentrated. Kharg Island, located in the northern Persian Gulf, handles approximately 90% of the country's crude exports. It is not simply a loading terminal but the operational spine of Iran's entire oil revenue system. The imposition of a US naval blockade targeting Iranian port traffic in early April 2026 effectively severed this artery.
Tanker loadings at Kharg Island continued at partial capacity following the blockade's implementation, but overall Iranian crude shipments dropped dramatically. Kpler data shows exports falling from approximately 1.85 million barrels per day in March 2026 to roughly 567,000 barrels per day in the weeks following the blockade — a decline of approximately 70% in tanker loadings over a matter of weeks.
| Metric | March 2026 (Pre-Blockade) | April 2026 (Post-Blockade) |
|---|---|---|
| Daily crude exports | ~1,850,000 bpd | ~567,000 bpd |
| Tanker loading change | Baseline | ~70% reduction |
| Unused storage headroom | Not critical | 12 to 22 days remaining |
| Estimated production rate | ~3.0 to 3.5M bpd | Continued, constrained |
| Potential forced cuts | Minimal | Up to 1.5M additional bpd by mid-May |
Production Cuts: Forced, Not Voluntary
The distinction between discretionary production management and physically forced curtailment matters enormously for understanding Iran's position. OPEC market influence operates through quota decisions and policy signals — but what Iran is facing is an infrastructure constraint of an entirely different nature.
Goldman Sachs estimated in late April 2026 that Iran had already curtailed up to 2.5 million barrels per day of crude production in response to blocked export capacity. Kpler analysts subsequently warned that a further 1.5 million bpd in cuts could be required by mid-May 2026 if storage reaches overflow levels.
The combined potential curtailment figure reaches as high as 4 million bpd. To contextualise this: prior to the conflict escalation, Iran was among OPEC's largest producers. A 4 million bpd reduction from a single country would rank among the most severe individual-nation production disruptions in the organisation's history.
The financial cost is proportionally severe. At an estimated $435 million per day in lost revenue, the cumulative damage mounts quickly. However, as will be discussed below, the full fiscal impact operates on a delayed timeline that complicates simple day-by-day accounting.
The Regional Dimension
Iran is not absorbing this pressure in isolation. Kpler and Bloomberg reporting note that neighbouring OPEC producers — including Saudi Arabia, Iraq, Kuwait, and the UAE — have also reduced output since the conflict began on February 28, 2026. Furthermore, while specific curtailment volumes for these producers are not publicly confirmed in available sources, the simultaneous regional compression adds a meaningful layer of tightness to global crude supply balances.
The concentrated nature of Persian Gulf production geography means that disruptions in this corridor affect global supply disproportionately to their geographic footprint. Understanding these geopolitical oil tensions is therefore essential for any accurate reading of where markets are headed.
Dark Fleet Operations: A Pressure Valve With Limits
No analysis of Iran's situation is complete without addressing the shadow logistics network that has sustained partial export flows. Iranian crude has long reached international buyers through indirect channels, particularly since the reimposition of US sanctions in 2018. These mechanisms have grown considerably more sophisticated over the intervening years.
Maritime intelligence firm Windward AI identified approximately 20 million barrels being rerouted through covert offshore networks following the blockade. Their data points to approximately 11 tankers operating off Malaysia, conducting ship-to-ship (STS) transfers using sanctioned or falsely flagged vessels as intermediaries. Kpler data further indicated that 4.6 million barrels were recently loaded, with roughly 4 million barrels having crossed the blockade perimeter, representing a cargo value of approximately $400 million.
STS transfers work by conducting at-sea cargo exchanges between vessels, allowing oil to change hands and documentation before proceeding to buyer ports. The Malaysian offshore zone has historically served as a transshipment hub for Iranian, Russian, and Venezuelan barrels seeking to obscure origin.
However, Kpler researchers reported that no tankers had been confirmed as successfully evading the US naval cordon in the Strait of Hormuz vicinity as of late April 2026. This distinction matters: covert flows may be occurring through circuitous routes that avoid the primary enforcement zone, but they are not breaching the blockade perimeter directly.
The operational reality likely sits between total disruption and business-as-usual. Covert flows through indirect routing and offshore hubs provide partial relief but remain insufficient to prevent the accumulation of storage pressure.
What Shadow Fleet Data Can and Cannot Tell Us
A layer of genuine analytical uncertainty surrounds dark fleet volume estimates. The conflicting signals between official blockade enforcement confirmation and observed covert loading activity create real difficulty in precise export volume assessment. Satellite imagery, AIS transponder monitoring, and port call data all have blind spots when applied to vessels intentionally operating outside normal reporting frameworks.
Investors and analysts should consequently treat dark fleet volume figures as directional estimates rather than precise measurements. The data suggests partial operational continuity — not normalised export flows.
The Revenue Lag: Why Tehran's Pain Is Delayed but Not Avoided
One of the less-intuitive aspects of this crisis is the timing mismatch between physical disruption and fiscal consequences. Understanding this lag is important for accurately projecting when Iran's government finances will begin to show strain.
Iranian crude cargoes destined for Chinese ports — which serve as the primary buyer for the country's oil through opaque transshipment channels — require approximately two months in transit. Once cargo arrives, buyers typically have a further two months to settle payments. The combined cycle creates a three-to-four month lag between export disruption and revenue shortfall.
| Phase | Approximate Timeline | Financial Impact |
|---|---|---|
| US blockade intensifies | Early April 2026 | Tanker loadings collapse ~70% |
| Storage reaches critical threshold | Mid-May 2026 (estimated) | Potential further 1.5M bpd cuts |
| Cargo transit to Chinese ports | ~2 months from loading | Revenue pipeline still moving |
| Buyer payment settlement | Further ~2 months | Payments from pre-blockade cargoes still arriving |
| Full revenue crunch begins | July to August 2026 | Existing payment pipeline exhausted |
This delay mechanism explains why Iran's budget may not yet be showing severe strain in April and May 2026. Pre-blockade cargoes loaded in late March and early April are still in transit, and payments for earlier shipments are still being received under normal commercial terms. The fiscal cliff, however, is approaching.
The structural implication is significant: every day the blockade persists, the revenue pipeline thins. By mid-to-late 2026, Iran will be receiving payment for a fraction of its previous export volumes while simultaneously absorbing deep production curtailments. The mathematics of this economic warfare make for stark reading.
Global Supply Implications and Market Sensitivity
The Iran oil storage shrinks amid US blockade crisis does not exist in a vacuum. Its implications extend directly into global crude pricing, Asian import balances, and energy market volatility frameworks. In addition, the trade war oil impact already pressuring markets compounds the difficulty of forecasting where prices settle.
Key sensitivity factors for global markets include:
- Combined curtailment scale: A potential 4 million bpd reduction from Iran alone represents a significant withdrawal from global supply, before accounting for regional OPEC producer adjustments
- Strait of Hormuz throughput: With approximately 20% of globally traded oil transiting this waterway, any sustained reduction in passage rates transmits directly into energy price formation across Brent, WTI, and Middle Eastern benchmark contracts
- China import dependency: Chinese refiners are the primary buyers of Iranian crude through indirect channels, and disruption to dark fleet operations could tighten Asian crude balances independently of official market movements
- Mid-May inflection point: If storage overflow forces confirmed additional production cuts around mid-May 2026, Brent crude price dynamics are likely to reflect a sharper supply tightening signal
- OPEC regional coordination uncertainty: The simultaneous output reductions among Gulf producers create layered supply uncertainty that complicates forecasting models built on pre-conflict production baselines
The Speculative Horizon: Scenarios Beyond Mid-May
If no relief emerges and storage fills completely, Iran's operational production trajectory could deteriorate toward levels approaching or below 1 million bpd — a threshold last visited during the most restrictive periods of international sanctions enforcement prior to the 2015 JCPOA. This would represent not just a cyclical production adjustment but a structural collapse in Iranian upstream capacity utilisation.
Conversely, any diplomatic development that reopens even partial export pathways could rapidly ease storage pressure, given that Iran retains its production infrastructure and could resume loading operations relatively quickly under permissive conditions. Furthermore, oil price movements in either direction will be heavily influenced by whether those diplomatic signals emerge before the mid-May storage threshold is reached.
Disclaimer: This article contains forward-looking analysis, projections from third-party research firms including Kpler and Goldman Sachs, and scenario-based commentary. All figures are sourced from Bloomberg and ET EnergyWorld reporting dated April 28, 2026. This material is intended for informational purposes only and does not constitute financial, investment, or trading advice. Supply projections, storage estimates, and revenue forecasts are subject to significant uncertainty and may not reflect actual outcomes.
The next major ASX story will hit our subscribers first
Key Data Summary: Iran's Oil Storage Crisis
| Indicator | Figure |
|---|---|
| Total onshore storage capacity | ~50 to 55 million barrels |
| Pre-blockade capacity utilisation | ~60% occupied |
| Remaining unused storage window | 12 to 22 days (as of late April 2026) |
| Pre-blockade exports (March 2026) | ~1.85 million bpd |
| Post-blockade exports (April 2026) | ~567,000 bpd |
| Export decline since blockade | ~70% |
| Production already curtailed | Up to 2.5 million bpd (Goldman Sachs) |
| Further cuts at risk (mid-May) | Up to 1.5 million bpd (Kpler) |
| Daily revenue loss estimate | ~$435 million |
| Revenue impact delay | 3 to 4 months |
| Dark fleet volumes detected | ~20 million barrels (Windward AI) |
| Confirmed blockade breaches | None (Kpler, late April 2026) |
Want to Position Ahead of the Next Major Commodity Market Shift?
Discovery Alert's proprietary Discovery IQ model scans ASX announcements in real time, delivering instant alerts on significant mineral discoveries and helping investors identify actionable opportunities before the broader market reacts — whether energy disruptions are tightening supply or opening new resource plays. Explore how historic mineral discoveries have generated substantial returns and begin a 14-day free trial to gain a genuine market-leading edge.