
May 23, 2026
When Price and Inventory Move in Opposite Directions: Understanding the Aluminium Paradox
Commodity markets have a long history of confounding conventional logic. The standard relationship between supply and price is intuitive: when stocks fall, prices rise. When inventories swell, prices retreat. Yet aluminium markets in late April 2026 are presenting something far more complex — a simultaneous drawdown in LME-registered stocks alongside a sharp correction in contract pricing across the forward curve. This LME aluminium prices and stocks decline requires looking well beyond warehouse data and into the deeper mechanics of speculative positioning, macroeconomic sentiment, and the structural aftereffects of trade policy shocks.
This analysis contextualises the correction within the broader 12-month price trajectory and examines what the forward curve architecture is revealing about medium-term market expectations. Furthermore, it draws on current data to provide strategic insights for procurement teams and market participants navigating this unusual environment.
When big ASX news breaks, our subscribers know first
The LME Aluminium Forward Curve: Reading Between the Numbers
Before analysing the price movements themselves, it is worth understanding how the LME forward curve functions as a market intelligence tool. Unlike equity markets where a single price reflects consensus value, aluminium forward curve contracts trade across multiple settlement dates, each reflecting a different balance of supply, demand, financing costs, and sentiment expectations.
Three contract structures are central to this analysis:
- Cash contracts reflect immediate settlement and are most sensitive to physical supply and demand conditions in the spot market.
- Three-month contracts are the most actively traded LME aluminium instrument and represent the benchmark used by most industrial buyers for procurement pricing.
- Long-dated contracts (such as December 2027) represent market expectations about future price equilibrium, typically incorporating views on supply expansion, demand trends, and long-run cost curves.
The relationship between these tenors — specifically the spread between spot and long-dated pricing — communicates whether the market views current conditions as a temporary dislocation or a structural shift.
What the April 28, 2026 Session Revealed About Market Sentiment
The April 28 session delivered a meaningful move across the entire aluminium forward curve. The data confirmed broad-based selling pressure rather than isolated spot market noise:
| Contract | April 27 Price (USD/t) | April 28 Price (USD/t) | Change |
|---|---|---|---|
| Cash Bid | $3,660 | $3,599 | -1.66% |
| Cash Offer | $3,662 | $3,600 | -1.69% |
| 3-Month Bid | $3,587.50 | $3,535 | -1.46% |
| 3-Month Offer | $3,588 | $3,537 | -1.42% |
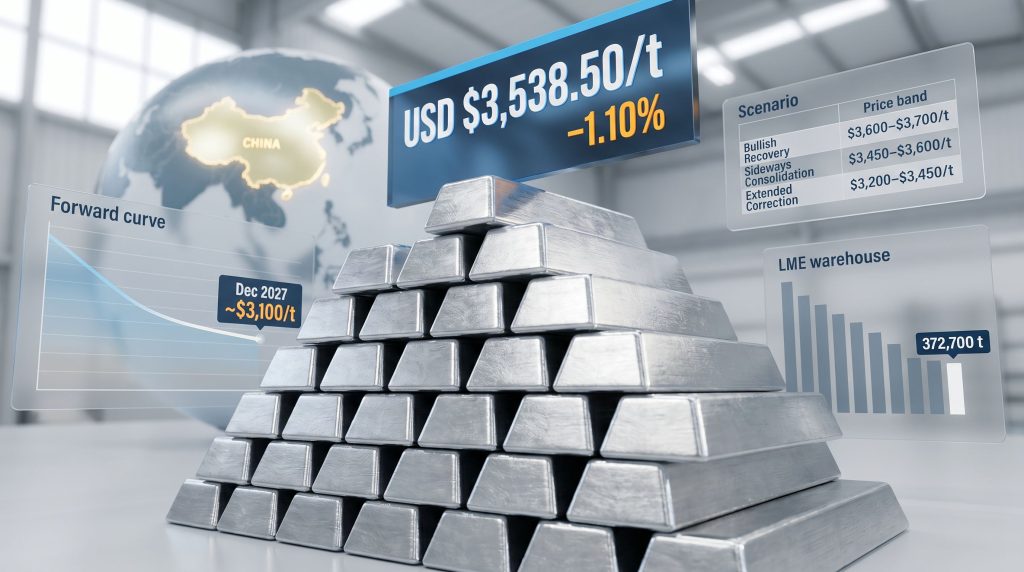
| 3-Month Reference Price | $3,578 | $3,538.50 | -1.10% |
| Dec-27 Bid | $3,102 | $3,100 | -0.06% |
| Dec-27 Offer | $3,107 | $3,105 | -0.06% |
The near-uniform decline across short-dated contracts signals systemic bearish positioning rather than a supply-specific event. Critically, the December 2027 contract barely moved, declining just 0.06% compared to the 1.42–1.69% drops seen in cash and three-month instruments.
When short-dated contracts fall sharply while long-dated tenors hold firm, the market is typically pricing in near-term demand weakness rather than anticipating a structural collapse in the commodity's value. This distinction is critical for industrial procurement teams calibrating their hedging strategy.
This forward curve architecture matters because it reveals that institutional participants do not view the current weakness as permanent. If the market anticipated a genuine structural surplus, long-dated contracts would also be pricing significantly lower. Indeed, LME aluminium prices easing across near-term tenors while longer contracts hold steady is a recurring feature of sentiment-driven corrections.
LME Aluminium Prices and Stocks Decline: The Simultaneous Paradox
The headline dynamic that makes late April 2026 analytically interesting is the concurrent decline in both LME aluminium prices and stocks. Inventory drawdowns continued throughout the week leading into April 28, as the following sequence demonstrates:
| Date | Opening Stocks (tonnes) | Change |
|---|---|---|
| April 21, 2026 | 386,250 | — |
| April 22, 2026 | 383,275 | -0.77% |
| April 24, 2026 | 378,825 | -1.16% |
| April 28, 2026 | 372,700 | -0.95% |
Live Warrants held steady at 335,000 tonnes on April 28, signalling that the metal held in LME-registered warehouses and still available for delivery remained stable. Meanwhile, cancelled warrants — which represent metal earmarked for physical withdrawal — fell from 37,700 to 35,275 tonnes, a 6.43% reduction in a single session.
Under classical commodity theory, a consistent drawdown in exchange-held inventory should exert upward pressure on spot pricing by tightening the physically available supply buffer. The fact that this is not occurring points to a market where forward-looking sentiment is overriding real-time supply signals.
This is not without historical precedent. During periods of demand-shock uncertainty, such as the 2022–2023 energy cost crisis affecting European smelters, physical inventory and price signals decoupled for extended periods as institutional investors priced in demand destruction faster than physical supply conditions could respond.
The Three Forces Driving the Current Price Correction
China's Demand Outlook Is Dominating Global Price Discovery
China consumes approximately half of global primary aluminium production annually, making its economic cycle the single most influential variable in LME price formation. When Chinese industrial output contracts, fixed-asset investment softens, or retail consumption data disappoints, the market reprices aluminium demand expectations globally — even if physical drawdowns outside China continue uninterrupted.
The late April 2026 correction reflects exactly this dynamic. Bearish readings on Chinese factory activity, weaker-than-expected consumer spending data, and subdued infrastructure investment signals have collectively shifted institutional sentiment toward the downside. Because the LME forward curve is continuously repriced by global participants with real-time access to Chinese economic releases, the market responded swiftly and proportionally.
What makes this particularly complex for price forecasters is the feedback loop involved: Chinese aluminium producers also respond to price signals, meaning that a sustained price decline could incentivise Chinese smelter output curtailments, which would in turn tighten supply and create the conditions for recovery. This self-correcting mechanism has historically prevented aluminium from sustaining deep and prolonged price declines during periods of short-term demand weakness.
Speculative Positioning Has Amplified the Move
Institutional money managers have reportedly concentrated net short positions in aluminium to their highest levels since mid-2024. This matters because speculative positioning can both amplify and accelerate price moves that may otherwise be gradual and orderly.
When short positioning reaches extreme concentrations, it creates a dual-scenario dynamic:
- If bearish catalysts continue: Short positions remain profitable, reinforcing downward price momentum through additional selling.
- If a positive catalyst emerges: A short-covering rally can be abrupt and disproportionate to the underlying fundamental trigger, as short sellers race to exit positions simultaneously.
Historical aluminium market cycles suggest that elevated short positioning tends to be an unreliable predictor of sustained price declines, particularly when physical inventory dynamics do not corroborate the bearish thesis. The current disconnect between falling stocks and falling prices may resolve itself when speculative positioning normalises.
The Post-Tariff Mean Reversion Effect
The February 2026 United States tariff announcements on aluminium imports initially propelled LME cash prices to approximately $3,670 per tonne, a three-year high reached on April 16, 2026. However, US aluminium tariffs driving artificial price floors carry a structural fragility that fundamentally demand-driven price increases do not.
When tariffs create an artificial price floor, they simultaneously:
- Incentivise buyers to front-load purchases ahead of tariff implementation.
- Distort demand timing without increasing underlying consumption.
- Create an overhang of pre-purchased inventory that suppresses subsequent buying activity.
- Generate speculative long positioning that eventually must be unwound.
The correction observed in late April 2026 is consistent with this post-tariff normalisation pattern. Furthermore, as the initial tariff shock is absorbed into supply chain pricing models and pre-purchase activity subsides, prices migrate back toward levels supported by genuine end-use demand. This is a recurring dynamic observed most clearly during the steel and aluminum tariffs cycle of 2018–2019.
The 12-Month Price Context: Why Magnitude Matters
Short-term corrections must be evaluated against the broader price trajectory to avoid misreading near-term volatility as structural deterioration. LME aluminium prices in late April 2026 remain approximately 44% above their equivalent levels from the same period in 2025 — a year-on-year appreciation that reflects genuine structural repricing rather than speculative excess alone.
This 12-month gain incorporates several durable price drivers:
- Energy cost pressures on primary smelters: Aluminium smelting is exceptionally energy-intensive, consuming approximately 13–14 megawatt-hours per tonne of aluminium produced. Elevated electricity and natural gas costs in key producing regions have sustainably elevated the cost floor for primary production.
- Supply-side constraints: Bauxite export restrictions, alumina refinery disruptions, and smelter capacity rationalisation in high-cost regions have collectively tightened the primary supply pipeline.
- Demand recovery in the energy transition sector: Aluminium's role in electric vehicle battery enclosures, solar panel frames, and grid infrastructure is driving structural demand growth independent of traditional construction and packaging cycles.
The LME alumina Platts closing price of USD $307.21 per tonne on April 28 provides a useful upstream reference point. A Platts alumina price above $300 per tonne represents a meaningful cost input for smelters and implies a structural cost floor that limits how far primary aluminium prices can sustainably decline before unprofitable smelter capacity curtailments begin. In addition, aluminum and alumina markets have shown that upstream cost pressures translate with a lag into downstream pricing support.
The next major ASX story will hit our subscribers first
Strategic Procurement and Hedging Considerations
For industrial buyers, procurement managers, and treasury teams managing aluminium price exposure, the current market configuration presents a nuanced set of decisions rather than a straightforward buy-or-wait scenario.
Scenario Analysis: Three Possible Price Trajectories Over the Next Three Months
| Scenario | Trigger Conditions | Indicative 3-Month Price Range |
|---|---|---|
| Bullish Recovery | Chinese stimulus announcement, short-covering rally, positive macro data | $3,600 – $3,700/t |
| Sideways Consolidation | Mixed economic data, steady inventory drawdown, stable speculative positioning | $3,450 – $3,600/t |
| Extended Correction | Deepening Chinese demand weakness, inventory build, continued speculative selling | $3,200 – $3,450/t |
Disclaimer: Scenario projections are illustrative analytical frameworks only and do not constitute financial advice. Commodity prices are subject to rapid change and significant uncertainty. Readers should consult qualified financial and commodity risk advisors before making procurement or hedging decisions.
Key strategic considerations for procurement teams navigating the current environment include:
- Forward contract windows: The current price softening may represent a tactical opportunity to lock in three-month forward prices at levels meaningfully below the April 16 peak, reducing the average cost of aluminium over the procurement cycle.
- Alumina cost tracking: Monitoring LME alumina Platts pricing alongside primary aluminium contracts provides an early indicator of smelter margin pressure, which historically precedes supply curtailment announcements and subsequent price support.
- Inventory positioning: For buyers with storage capacity, gradual physical accumulation during price weakness can reduce exposure to a short-covering rally scenario if Chinese stimulus announcements or positive trade policy developments emerge.
- Hedging tenure alignment: The relative stability of December 2027 contracts at approximately $3,100–$3,105 per tonne suggests that longer-dated hedges are currently available at a meaningful discount to spot. Consequently, aluminium premiums and forward pricing together offer genuine value for procurement teams with multi-year consumption visibility.
Frequently Asked Questions: LME Aluminium Prices and Stocks Decline
Why are LME aluminium prices falling while stocks are also declining?
Inventory drawdowns and price declines can occur simultaneously when demand-side sentiment dominates market pricing. Physical metal continues to be withdrawn from LME warehouses, reflecting genuine industrial consumption activity. However, forward-looking price expectations driven by Chinese macroeconomic concerns and elevated speculative short positioning are overriding the bullish signal that tightening stocks would normally provide.
What was the LME aluminium three-month reference price on April 28, 2026?
The LME aluminium three-month reference price closed at USD $3,538.50 per tonne on April 28, 2026, representing a 1.10% decline from the prior session's $3,578 per tonne.
What do December 2027 aluminium contract prices indicate about long-term market expectations?
The December 2027 contract traded at approximately $3,100–$3,105 per tonne on April 28, 2026. This pricing level — roughly $495–$500 below current spot prices — suggests the market anticipates a gradual normalisation of aluminium pricing from current elevated levels as supply-side dynamics stabilise and demand growth moderates. The minimal daily change in this tenor confirms that participants do not view current weakness as a long-term structural collapse.
How significant is the year-on-year price appreciation context?
Aluminium prices as of late April 2026 remain approximately 44% above equivalent 2025 levels, a figure that underscores the scale of structural repricing the commodity has undergone over the past 12 months. Near-term corrections of 1–2% per session, while notable, represent modest retracements against this broader appreciation. The top aluminium producers have nonetheless been responding to margin pressures as pricing adjusts across the curve.
Key Takeaways for Market Participants
- The simultaneous LME aluminium prices and stocks decline represents a demand-sentiment override of physical supply signals — a temporary dislocation with historical precedent rather than a structural market breakdown.
- Short-dated contracts have absorbed the bulk of selling pressure, while long-dated tenors remain relatively stable, confirming that the market views current weakness as cyclical rather than permanent.
- Speculative short positioning at multi-month highs introduces asymmetric risk: a positive catalyst could trigger a disproportionate short-covering rally that rapidly reverses current weakness.
- The alumina Platts price above $307 per tonne provides an upstream cost floor signal that limits how far primary aluminium prices can sustainably decline before smelter economics force output reductions.
- Procurement teams should treat the current correction as a strategic evaluation window, assessing whether forward contract terms now available represent genuine value against their medium-term consumption budgets.
This article is intended for informational purposes only and does not constitute investment or financial advice. Commodity market conditions are subject to rapid change. All price data sourced from AL Circle market reporting for April 28–29, 2026. Readers are encouraged to consult qualified financial advisors before making any commercial or investment decisions based on commodity market analysis.
Want to Track the Next Major ASX Mineral Discovery Before the Market Moves?
Discovery Alert's proprietary Discovery IQ model delivers real-time alerts on significant ASX mineral discoveries, turning complex commodity data into actionable investment insights for both short-term traders and long-term investors — explore Discovery Alert's discoveries page to understand how historic mineral finds have generated substantial returns, and begin a 14-day free trial to position yourself ahead of the broader market.