August 5, 2026
The Hidden Architecture Behind LME Aluminium Prices and Stocks
Commodity markets rarely move in straight lines, and aluminium is no exception. The metal sits at the intersection of energy economics, industrial policy, and long-cycle infrastructure spending, making it one of the more complex base metals to read at any given moment. Understanding what is happening beneath the surface of LME aluminium prices and stocks requires more than observing a daily percentage change. It demands an appreciation of inventory mechanics, contract structure, feedstock relationships, and the downstream forces reshaping demand profiles for decades to come.
The opening weeks of July 2026 have delivered a telling set of data points for anyone tracking this market closely. Prices recovered across every contract tenor, warehouse stocks continued their multi-week drawdown, and a key feedstock benchmark held steady, all while a broader year-on-year gain of over 21% sat quietly in the background. Each of these developments carries meaning for traders, producers, and investors alike.
When big ASX news breaks, our subscribers know first
Understanding LME Aluminium Price Architecture: Cash, Three-Month, and Forward Contracts Explained
How the LME Pricing Ladder Works for Aluminium
The London Metal Exchange operates a pricing structure that functions differently from most equity or futures markets. Rather than a single quoted price, the LME maintains a ladder of contract maturities, each reflecting a different slice of the market's forward expectations.
The cash price represents the cost of immediate settlement, typically two business days forward. The spread between the cash bid and cash offer is a liquidity indicator: tighter spreads signal active two-way trading, while wider spreads can indicate reduced market confidence or thinner participation.
The three-month contract is the LME's primary benchmark and serves as the global reference price for physical aluminium transactions worldwide. Most smelter offtake agreements, trader financing arrangements, and producer hedge programmes are benchmarked to this figure.
Longer-dated forwards, such as the December 2027 contract, embed the market's collective view of where supply and demand will sit roughly 18 months from today. When these contracts trade at a discount to spot, it implies the market expects conditions to ease over time, a dynamic known as backwardation. Conversely, when they trade at a premium, the market is pricing in ongoing tightness.
Snapshot: LME Aluminium Price Levels as of Early July 2026
| Contract Type | Price (July 6, 2026) | Prior Session (July 3, 2026) | Change (%) |
|---|---|---|---|
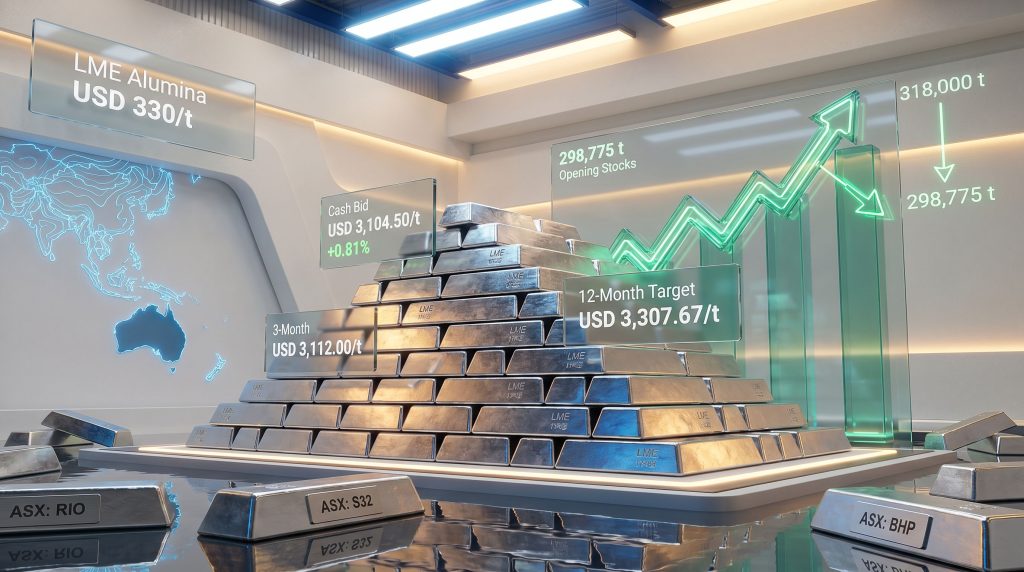
| Cash Bid | USD 3,104.50/t | USD 3,079.50/t | +0.81% |
| Cash Offer | USD 3,105.00/t | USD 3,080.00/t | +0.81% |
| 3-Month Bid | USD 3,112.00/t | USD 3,086.00/t | +0.84% |
| 3-Month Offer | USD 3,113.00/t | USD 3,087.00/t | +0.84% |
| Dec 2027 Bid | USD 3,048.00/t | USD 3,022.00/t | +0.86% |
| Dec 2027 Offer | USD 3,053.00/t | USD 3,027.00/t | +0.86% |
| Asian Reference Price | USD 3,115.50/t | Prior Session | +0.81% |
The uniform 0.81 to 0.86% gain registered across all contract maturities on July 6 is a meaningful detail. When gains are distributed evenly along the curve rather than concentrated at the front end, it typically reflects genuine market-wide confidence rather than short-term speculative positioning.
How Have LME Aluminium Prices Performed Over the Past 30 to 90 Days?
June 2026: A Period of Volatility and Price Compression
The aluminium market endured a challenging mid-June period, with cash bid prices retreating toward the USD 3,401.50 range before a subsequent correction established a more meaningful floor. The three-month contract also faced selling pressure, touching the USD 3,400 area during that window as near-term demand uncertainty weighed on sentiment.
The most significant data point from this period was the establishment of USD 3,224 per tonne as the lowest aluminium price since March 2026, effectively defining the lower boundary of the current price range. For technical analysts, this level carries weight as a support zone that the market has since moved decisively above.
The Recovery Trajectory Into July 2026
The path from the mid-June low back toward USD 3,112 per tonne by early July represents a meaningful recovery, though the broader 30-day picture still shows a 13.43% price decline over that window. This apparent contradiction — a recovery within a negative 30-day return — reflects the sharp sell-off that occurred in the latter part of June before stabilisation took hold.
What makes the current recovery more analytically interesting is its context: despite near-term softness, LME aluminium prices and stocks data confirms the market remains approximately 21.09% higher than year-ago levels. This year-on-year gain is not a product of speculation alone. It reflects a structural supply environment that has tightened meaningfully across major producing regions, driven by energy cost pressures, regulatory constraints, and restrained capacity additions.
Despite near-term softness across June, aluminium on the LME remains significantly elevated versus year-ago levels, a reflection of structural supply constraints and sustained downstream demand from the energy transition and automotive electrification sectors.
What Do Declining LME Aluminium Warehouse Stocks Signal for the Market?
Decoding LME Inventory Mechanics: Warrants, Cancellations, and Physical Demand
LME warehouse inventory data is often misread by those unfamiliar with the mechanics. Understanding the distinction between the different warrant categories is essential for interpreting what the numbers actually mean.
- Opening stocks represent the total aluminium held across all LME-registered warehouses globally at the start of each trading session.
- Live warrants are stocks that remain available for delivery against LME contracts. These represent metal that can be sold, transferred, or used to settle an exchange obligation.
- Cancelled warrants are stocks that have been designated for physical withdrawal from a warehouse. Metal in this category has effectively been claimed and is no longer available for trading purposes. A high level of cancelled warrants indicates imminent physical demand; a falling cancelled warrant figure suggests that near-term physical offtake pressure may be moderating.
LME Aluminium Stock Movements: A Structured Overview
| Inventory Metric | July 6, 2026 | July 3, 2026 | Change |
|---|---|---|---|
| Opening Stocks | 298,775 t | 300,275 t | -1,500 t (-0.50%) |
| Live Warrants | 246,600 t | 246,600 t | Unchanged |
| Cancelled Warrants | 48,950 t | 52,175 t | -3,225 t (-6.18%) |
The Broader Inventory Drawdown Trend: June to July 2026
Zooming out from the single-session data reveals a more significant trend. LME aluminium stocks stood at approximately 318,000 tonnes in early June 2026, declining to 306,725 tonnes by June 26 before falling further to 298,775 tonnes by July 6. This represents a cumulative drawdown of roughly 19,225 tonnes over approximately five weeks, or just under 6% of total opening stocks.
The psychological significance of the sub-300,000 tonne threshold should not be underestimated. Historically, LME aluminium inventory levels below 300,000 tonnes have been associated with tighter spot market conditions and increased price sensitivity to any supply disruption. Furthermore, falling stocks and cancelled warrants have historically preceded meaningful price moves in the physical market.
Persistent inventory drawdowns at LME warehouses, when combined with stable live warrants, typically reflect genuine physical demand absorption rather than speculative warrant cancellation activity. This combination is widely regarded within the trading community as a structurally bullish signal for forward pricing.
One nuance worth noting: the 6.18% decline in cancelled warrants on July 6 does not contradict the bullish inventory narrative. It simply indicates that the queue of metal waiting to leave warehouses shortened slightly on that specific day, while the overall stock level continued to fall. The two data points must be read together, not in isolation.
Is the LME Aluminium Price Rally Sustainable? Forward Outlook and Price Projections
Quantitative Forecasts for LME Aluminium Through 2026 to 2027
Consensus quantitative modelling places LME aluminium at approximately USD 3,144.42 per tonne by the end of Q3 2026, with a 12-month forward projection suggesting a potential move toward USD 3,307.67 per tonne. From current July 2026 levels, this represents approximately 6.3% upside over the next year, a modest but meaningful return profile for a physical commodity market.
The December 2027 forward contract, already trading at USD 3,048 to 3,053 per tonne, embeds a slight discount to current spot, implying that the market anticipates some degree of supply normalisation over the 18-month horizon. This is a reasonable assumption given the potential for capacity restarts if energy economics improve.
Disclaimer: Price forecasts and projections are based on quantitative modelling and consensus estimates. They do not constitute financial advice and should not be used as the sole basis for investment decisions. Commodity markets carry significant risk and actual outcomes may differ materially from projections.
Structural Demand Drivers Supporting the Bullish Case
Several interconnected demand forces are providing a durable floor beneath aluminium prices:
- Electric vehicle manufacturing: Aluminium's role in lightweighting EV bodies and battery enclosures is growing as manufacturers prioritise range efficiency. Each EV typically contains significantly more aluminium than an equivalent internal combustion vehicle.
- Grid infrastructure expansion: The global buildout of electricity transmission networks, a prerequisite for the energy transition, relies heavily on aluminium conductors. Overhead transmission lines use aluminium almost exclusively due to its favourable conductivity-to-weight ratio.
- Packaging recovery in Asia: Consumer goods demand in key Southeast and East Asian markets is driving sustained aluminium packaging consumption, adding a steady baseload to demand forecasts.
- Construction sector aluminium use: Architectural facades, window systems, and structural components in the building sector continue to represent a major demand category, particularly in markets experiencing urban expansion.
Supply-Side Risks That Could Cap Price Upside
The bull case is not without its counterweights. Several supply-side scenarios could limit price appreciation:
- Chinese smelter restarts: If power costs in Yunnan, Sichuan, and other hydro-dependent provinces moderate, idled capacity could return to production relatively quickly. China's aluminium industry retains significant latent capacity that can be activated within months under the right energy price conditions.
- Gulf region capacity additions: Aluminium smelters in the Middle East benefit from access to subsidised or low-cost natural gas. New capacity additions in this region could add to global supply at relatively low marginal cost.
- US aluminium tariffs and trade policy uncertainty: Cross-border aluminium flows are increasingly sensitive to trade policy developments. Shifts in tariff frameworks can redirect metal between markets, creating localised oversupply in some regions while maintaining tightness in others.
- European production constraints: Elevated energy costs across European smelters continue to pressure production economics, with some capacity remaining curtailed. However, any energy price relief could bring this metal back to market.
What Is LME Alumina Pricing and Why Does It Matter?
The Alumina-to-Aluminium Cost Relationship
A detail that receives insufficient attention in mainstream aluminium market commentary is the critical role of alumina pricing in determining smelter economics. Alumina is the white powder derived from bauxite that serves as the direct feedstock for primary aluminium production. Indeed, the broader bauxite supply chain is a foundational driver of smelter cost structures globally.
The production chain works roughly as follows:
- Approximately 4 to 5 tonnes of bauxite are required to produce one tonne of alumina through the Bayer refining process.
- Approximately 2 tonnes of alumina are then consumed in electrolytic reduction cells (potlines) to produce one tonne of primary aluminium.
- This process also requires substantial electrical energy input, typically 13,000 to 15,000 kilowatt-hours per tonne of aluminium produced, which is why smelter location relative to low-cost power sources is a defining competitive variable.
With the LME Platts alumina price holding at USD 330 per tonne as of early July 2026, the feedstock cost component of aluminium production remains relatively contained. At a consumption ratio of 2 tonnes of alumina per tonne of aluminium, the alumina input cost represents approximately USD 660 per tonne of aluminium produced, equivalent to roughly 21% of the current LME three-month price. This leaves meaningful room for smelter margins, particularly where energy costs are low.
Alumina price stability at the USD 330 per tonne level is a quietly significant data point. It indicates that the feedstock cost component of the production chain is not adding inflationary pressure to smelter operating costs at a time when finished metal prices are recovering.
Alumina Price Context Within the 2026 Market Environment
The aluminum and alumina markets have their own supply and demand dynamics that can diverge from the finished metal market. Refinery outages, bauxite shipping disruptions, or refinery capacity constraints in key producing nations including Australia, Brazil, and Guinea can cause alumina prices to spike independently of LME aluminium movements.
When both move upward simultaneously, smelter margins compress rapidly. The current environment of stable alumina and recovering aluminium prices is therefore relatively favourable for integrated producers.
The next major ASX story will hit our subscribers first
How Does LME Aluminium Pricing Affect ASX-Listed Aluminium Producers?
The LME-to-Revenue Transmission Mechanism for Major Producers
For ASX-listed companies with aluminium operations, the LME price is not simply a number on a screen. It is the primary determinant of realised revenue for every tonne of metal sold. The transmission from LME benchmark to actual invoice price involves several steps:
- The LME three-month price serves as the base reference for most physical sales contracts.
- A regional premium or discount is added, reflecting freight costs, local market conditions, and product form (ingot, billet, slab, etc.).
- Currency conversion from USD to AUD then applies, meaning that movements in the AUD/USD exchange rate can amplify or dampen the revenue impact of LME price changes for Australian operators.
- Hedging programmes employed by larger producers can smooth volatility over time, though they also limit upside participation during price rallies.
ASX Top 200 Exposure to Aluminium Price Movements
The three most significant vehicles for ASX investors seeking exposure to LME aluminium price movements are:
- South32 (ASX: S32): Operates aluminium and alumina assets across Australia, South Africa, and Brazil. Its Worsley Alumina operation in Western Australia and the Brazil Aluminium smelter provide direct exposure to both the alumina and LME aluminium price benchmarks.
- Rio Tinto (ASX: RIO): One of the world's largest integrated aluminium producers, the company's Gladstone aluminium operations in Queensland are a material contributor to group revenue. LME price movements flow directly through to earnings across its Pacific Operations and international smelters.
- BHP (ASX: BHP): Holds indirect exposure through bauxite mining operations and alumina refining assets. While BHP's aluminium exposure is less direct than South32 or Rio Tinto, LME aluminium trends inform the strategic value of its bauxite portfolio and capital allocation decisions across base metals.
For ASX-listed producers, a sustained LME aluminium price above USD 3,100 per tonne generally supports strong free cash flow generation, particularly where energy input costs remain contained and the AUD/USD rate does not move sharply against their favour.
A lesser-appreciated dynamic for Australian producers is the natural hedge that the AUD/USD relationship can provide. When global commodity markets weaken, the Australian dollar often depreciates against the US dollar, softening the revenue decline in local currency terms. Conversely, when commodity markets strengthen, AUD/USD tends to appreciate, reducing some of the upside. This currency relationship means that raw LME price movements do not translate one-for-one into Australian dollar earnings outcomes.
Furthermore, monitoring the top aluminium producers globally provides valuable context for understanding how production shifts and corporate strategies may influence future LME pricing dynamics. Investors can track aluminium price movements in real time to complement their analysis of warehouse stock trends and forward curve positioning.
Frequently Asked Questions: LME Aluminium Prices and Stocks
What is the current LME aluminium cash price?
As of July 6, 2026, the LME aluminium cash bid price was USD 3,104.50 per tonne, representing a gain of approximately 0.81% from the prior trading session on July 3, 2026.
What does a decline in LME aluminium opening stocks mean?
A reduction in LME warehouse opening stocks, which fell to 298,775 tonnes on July 6 from 300,275 tonnes on July 3, generally indicates that physical demand is absorbing available supply. Declining stocks at LME-registered warehouses are widely interpreted as a constructive signal for aluminium prices.
What are cancelled warrants on the LME?
Cancelled warrants represent aluminium inventory that has been formally designated for physical withdrawal from an LME-registered warehouse. On July 6, cancelled warrants fell by 6.18% to 48,950 tonnes, which indicates that the volume of metal actively being claimed for physical delivery moderated slightly on that session.
What is the LME aluminium price forecast for the next 12 months?
Quantitative consensus models project LME aluminium at approximately USD 3,144.42 per tonne by end of Q3 2026, with a 12-month forward target of approximately USD 3,307.67 per tonne, implying around 6.3% upside from early July 2026 levels. These are model-based projections and carry inherent uncertainty.
How does the LME aluminium price affect Australian mining stocks?
ASX-listed producers including Rio Tinto, South32, and BHP carry direct or indirect earnings sensitivity to LME aluminium price movements. Rising prices generally support higher realised revenues, improved smelter margins, and stronger free cash flow generation across these operators.
What is the LME Asian Reference Price for aluminium?
The LME Asian Reference Price is a daily official fixing used to settle aluminium contracts traded during Asian market hours. On July 6, 2026, this reference price stood at USD 3,115.50 per tonne, up 0.81% from the prior session.
Key Takeaways: LME Aluminium Prices and Stocks at a Glance
- LME aluminium cash and three-month prices recovered 0.81 to 0.84% on July 6, 2026, following a period of mid-June softness
- Opening warehouse stocks declined to 298,775 tonnes, crossing below the psychologically significant 300,000 tonne level
- The cumulative inventory drawdown from approximately 318,000 tonnes in early June to below 299,000 tonnes by early July represents a material tightening of the physical supply picture
- Stable live warrants combined with declining total stocks point to genuine physical demand absorption rather than speculative activity
- The LME Platts alumina price held at USD 330 per tonne, supporting smelter margins during the aluminium price recovery
- Forward price projections point toward USD 3,307 per tonne within 12 months, underpinned by energy transition demand, grid infrastructure spending, and restrained smelting capacity growth
- ASX-listed majors including Rio Tinto (ASX: RIO) and South32 (ASX: S32) remain the primary equity vehicles for investors seeking exposure to LME aluminium price appreciation, with currency dynamics adding an additional layer of complexity to return outcomes
Want To Stay Ahead of the Next Major ASX Mineral Discovery?
Discovery Alert's proprietary Discovery IQ model delivers real-time alerts on significant ASX mineral discoveries, instantly turning complex commodity data into actionable insights for investors across all experience levels — start your 14-day free trial today and gain a market-leading edge, or explore Discovery Alert's dedicated discoveries page to understand how historic finds have generated substantial returns for early investors.