July 13, 2026

The global energy sector faces a critical challenge as the uranium supply gap widens, threatening nuclear power expansion plans worldwide. Mining industry analysts project that by 2040, nuclear reactors will demand approximately 391 million pounds of uranium annually, while all currently identified supply sources can deliver only 179 million pounds per year. This creates a staggering gap of 212 million pounds with no identified sources to bridge the shortfall.
This uranium supply gap represents more than a statistical imbalance. It reflects decades of underinvestment, geopolitical disruptions, and the fundamental economics of nuclear fuel production converging into a supply crisis that compounds annually. Unlike cyclical commodity shortages, this deficit stems from structural forces that cannot be quickly reversed through price signals alone.
The mathematics are stark: current global uranium consumption exceeds primary production by approximately 25-30%, with the difference historically masked by secondary sources including recycled reactor fuel and downblended weapons material. However, these finite stockpiles are depleting rapidly, forcing utilities to confront the reality of primary production shortfalls that have persisted since 2011.
Understanding the Fundamental Economics of Uranium Scarcity
Defining the Supply-Demand Imbalance in Nuclear Fuel Markets
The uranium supply gap emerges from a complex interplay between rising nuclear energy demand and constrained primary production capacity. Current global uranium consumption runs approximately 180-190 million pounds annually, while primary mine production delivers roughly 140-150 million pounds per year. This shortfall has persisted for over a decade, creating cumulative inventory depletion across the nuclear fuel supply chain.
Secondary supply sources have historically bridged this gap through several mechanisms:
- Recycled uranium from spent reactor fuel reprocessing
- Downblended highly enriched uranium from dismantled nuclear weapons
- Utility and government strategic reserves accumulated during previous oversupply periods
- Enrichment tails re-enrichment using advanced centrifuge technology
World Nuclear Association data confirms that these secondary sources currently provide approximately 25% of reactor requirements. However, their contribution has declined steadily from over 40% in the early 2000s, as weapons material downblending programs near completion and reprocessing capacity remains limited to specific jurisdictions.
Quantifying the Scale of the Global Deficit
Projected Uranium Supply Gap by Region (2026-2040)
| Region | Current Demand (Mlbs/year) | Projected 2040 Demand | Identified Supply | Annual Deficit |
|---|---|---|---|---|
| North America | 55 | 75 | 25 | 50 |
| European Union | 45 | 65 | 15 | 50 |
| Asia Pacific | 85 | 180 | 85 | 95 |
| Rest of World | 15 | 25 | 15 | 10 |
| Global Total | 200 | 345 | 140 | 205 |
North American uranium demand faces particular intensity due to 98% import dependency despite operating 93 nuclear reactors that generate approximately 20% of domestic electricity supply. The United States consumed roughly 40 million pounds of uranium in 2025, while domestic production contributed less than 1 million pounds, creating strategic vulnerability to supply disruptions.
European markets confront similar challenges, with France's 56 reactor fleet requiring 8,000-10,000 tonnes of natural uranium annually while domestic production remains negligible. The European Union's dependence on Russian enrichment services compounds these constraints, as sanctions and diversification efforts reshape traditional supply relationships.
Asian nuclear expansion drives the most significant incremental demand growth. China's nuclear construction program targets 150 GWe of installed capacity by 2035, requiring approximately 25,000-30,000 tonnes of natural uranium annually at full operation. Combined with Japan's reactor restart program and South Korea's nuclear expansion, Asian demand could reach 180 million pounds annually by 2040.
When big ASX news breaks, our subscribers know first
What Economic Forces Are Driving Uranium Market Transformation?
Nuclear Renaissance Economics and Capital Investment Cycles
Government policy shifts toward carbon-free baseload power generation have fundamentally altered nuclear energy economics across major consuming nations. The Paris Climate Agreement commitments require massive decarbonisation of electricity generation systems, creating renewed recognition of nuclear power's role in achieving net-zero emissions targets while maintaining grid stability.
Private sector nuclear technology investments reflect this transformation through several key developments:
- Small Modular Reactor (SMR) deployment capital exceeding $10 billion globally
- Advanced reactor technology venture funding approaching $5 billion since 2020
- Utility nuclear fleet life extension investments totaling over $50 billion
- Government nuclear research and development budgets increasing 40% since 2022
Utility procurement strategies have shifted dramatically following uranium supply-demand volatility between 2021-2025. Historical reactive spot market purchasing has given way to strategic forward contracting, with some utilities securing 10-15 year uranium supply agreements to ensure fuel security. This transition from just-in-time procurement to strategic inventory management creates additional demand pressure on available supplies.
Geopolitical Supply Chain Disruptions and Market Restructuring
Russian uranium supply chains face increasing restrictions following geopolitical tensions that began in 2022. Russia historically provided approximately 40% of global uranium enrichment capacity through Rosatom subsidiaries, creating supply bottlenecks as Western nations pursue diversification strategies. The US Senate ban on Russian uranium effective 2024, while European utilities accelerate procurement from alternative suppliers.
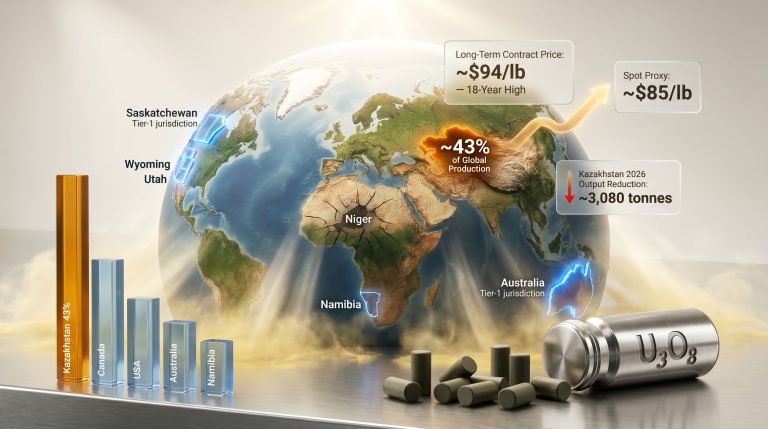
Kazakhstan production constraints compound these disruptions despite the country's position as the world's largest uranium producer. Kazatomprom, the national uranium company, has implemented production cuts exceeding 20% since 2022 due to operational challenges, regulatory changes, and sulfuric acid supply constraints. These reductions remove approximately 10-12 million pounds of annual supply from global markets.
Western nations have responded through strategic uranium reserve policies and domestic production incentives. The United States established a $4.3 billion uranium reserve program targeting domestic production capacity development. Canada maintains strategic uranium stockpiles while implementing export review mechanisms for nuclear materials. Australia, controlling roughly 30% of global uranium resources, has streamlined mining approvals for strategic projects.
How Do Mining Economics Explain the Production Shortage?
Capital Allocation Patterns in Uranium Mining Investment
The 2011-2020 period following the Fukushima nuclear incident created systematic underinvestment in uranium mining that persists today. Industry capital expenditure fell approximately 80% between 2011-2016 as uranium prices declined from over $70 per pound to below $25 per pound. This prolonged downturn forced mine closures, deferred development projects, and eliminated exploration programs across major uranium-producing regions.
Current project development timelines require 7-15 years from initial discovery to commercial production, encompassing:
- Exploration and resource definition (2-4 years)
- Environmental assessment and permitting (2-4 years)
- Engineering design and construction (2-5 years)
- Commissioning and production ramp-up (1-3 years)
Break-even cost analysis reveals that sustained uranium prices above $70-80 per pound are necessary to justify most new uranium projects. Higher-cost deposits, including many Western jurisdiction projects, require $100+ per pound for economic viability. Current uranium spot prices, while improved from 2020 lows, remain below levels that incentivise widespread new mine development.
Operational Challenges Constraining Existing Production
Key Production Bottlenecks:
Major operating mines face accelerating depletion rates that cannot be replaced by new capacity additions in the near term. McArthur River in Saskatchewan, historically the world's largest uranium mine, suspended operations in 2018 and restarted at reduced capacity in 2022. Olympic Dam in South Australia produces uranium as a byproduct of copper mining, with uranium output dependent on copper market conditions rather than uranium demand.
Technical challenges in unconventional uranium extraction methods create additional production constraints. In-situ recovery (ISR) technology, dominant in Kazakhstan and certain U.S. operations, requires specific hydrogeological conditions that limit deployment to suitable locations. ISR operations also face environmental compliance obligations and community relations challenges that can extend development timelines significantly.
Environmental permitting delays affect both existing operations and new project development. Regulatory approval processes have become increasingly complex, with some projects facing 5-7 year permitting timelines before construction can begin. Community relations costs, particularly in indigenous territories where many uranium deposits are located, require extensive consultation processes that add both time and expense to project development.
Processing infrastructure represents another critical bottleneck. Uranium concentrate production requires specialised mills and processing facilities that cannot be rapidly constructed or expanded. North America operates only two commercial uranium processing mills, creating potential bottlenecks even if primary production increases. This infrastructure constraint partially explains why proximity to existing processing capacity provides significant economic advantages for new uranium projects.
Which Geographic Regions Face the Most Severe Supply Constraints?
North American Market Dynamics and Strategic Implications
The United States operates 93 commercial nuclear reactors generating approximately 20% of domestic electricity, yet domestic uranium production provides less than 2% of reactor fuel requirements. This 98% import dependency creates strategic vulnerability that government policies increasingly recognise as a national security concern.
Canada's role as a swing producer complicates North American supply security despite shared continental geography. Saskatchewan's Athabasca Basin produces roughly 15% of global uranium supply, but Canadian export policies prioritise long-term strategic relationships over spot market sales. The province's high-grade deposits, including some exceeding 20% uranium content, provide cost advantages but require specialised mining techniques and extensive infrastructure development.
Mexico's nuclear expansion plans add incremental demand pressure to North American uranium markets. The country's two operating reactors at Laguna Verde may be joined by additional units as part of energy security initiatives. Regional uranium demand could exceed 60 million pounds annually by 2030, while identified North American production capacity remains below 30 million pounds per year.
North American Uranium Supply-Demand Balance (2026-2035)
| Year | Regional Demand | Domestic Production | Import Requirement | Supply Gap Risk |
|---|---|---|---|---|
| 2026 | 55 Mlbs | 8 Mlbs | 47 Mlbs | Moderate |
| 2030 | 62 Mlbs | 15 Mlbs | 47 Mlbs | High |
| 2035 | 70 Mlbs | 25 Mlbs | 45 Mlbs | High |
European Energy Security and Uranium Procurement Strategies
France's nuclear fleet requires 8,000-10,000 tonnes of natural uranium annually to fuel its 56 operating reactors that generate approximately 70% of domestic electricity. Électricité de France (EDF) has historically relied on long-term contracts with Niger, Kazakhstan, and other producers, but supply diversification has become a strategic priority following geopolitical disruptions.
Eastern European reactor fuel diversification accelerated following Russian supply chain restrictions. Countries including Czech Republic, Hungary, and Bulgaria historically depended on Russian-designed reactor fuel assemblies that require specific uranium specifications. Alternative fuel suppliers require multi-year qualification processes, creating transition challenges that compound supply constraints.
The United Kingdom's nuclear new-build programs face particular uranium procurement challenges due to delayed project timelines and uncertain political support. Hinkley Point C construction delays have pushed commercial operation beyond 2030, while Sizewell C approval remains pending. British energy policy emphasises nuclear power's role in achieving net-zero emissions, but delivery timelines suggest uranium demand will materialise later than originally projected.
European Union energy security policies increasingly treat uranium as a critical raw material requiring strategic stockpiling and supply chain resilience. Furthermore, US uranium market disruptions compound these challenges, affecting global supply patterns. The bloc's REPowerEU plan specifically addresses nuclear fuel supply security, including provisions for emergency sharing mechanisms and coordinated procurement strategies among member states.
What Investment Opportunities Emerge from Supply Gap Economics?
Primary Producer Valuation Models in Tight Markets
Uranium producer economics undergo fundamental transformation during supply shortage periods, with margin expansion potential exceeding most traditional mining sectors. High-grade deposits demonstrate particular sensitivity to uranium price increases, as fixed mining and processing costs represent smaller proportions of total production expenses compared to lower-grade operations.
Uranium Producer Economic Metrics Comparison
| Producer Category | Average Grade | Production Cost | Breakeven Price | Margin at $100/lb |
|---|---|---|---|---|
| High-Grade (>10%) | 25% | $35/lb | $45/lb | 180% |
| Mid-Grade (1-10%) | 3.5% | $55/lb | $70/lb | 80% |
| Low-Grade (<1%) | 0.3% | $75/lb | $95/lb | 5% |
| ISR Operations | Variable | $45/lb | $60/lb | 120% |
Resource quality metrics extend beyond grade to include jurisdiction stability, regulatory clarity, and infrastructure proximity. Canadian Athabasca Basin deposits command valuation premiums despite higher development costs due to political stability and established nuclear industry expertise. Australian deposits benefit from streamlined permitting processes and proximity to Asian uranium markets.
Market capitalisation versus in-situ resource value analysis reveals significant valuation disparities across uranium producers. Advanced development projects with completed feasibility studies trade at enterprise values representing $8-15 per pound of contained uranium, while early-stage exploration companies may command less than $2 per pound. These valuation gaps create acquisition opportunities for well-capitalised producers seeking to expand resource bases.
Secondary Market Opportunities and Financial Instruments
Uranium spot price versus long-term contract pricing dynamics create arbitrage opportunities for sophisticated investors. Long-term uranium contracts currently trade at significant premiums to spot prices, reflecting utility willingness to pay for supply security. This pricing differential incentivises financial players to purchase physical uranium for forward delivery contracts.
Physical uranium funds have emerged as alternative investment vehicles that directly impact available supply. The Sprott Physical Uranium Trust and Yellow Cake PLC collectively control over 100 million pounds of uranium stockpiles, removing material from utility procurement markets. These funds create positive feedback loops where uranium purchases drive price increases that attract additional investor capital for further purchases.
Enrichment services and conversion capacity investments present related opportunities within the nuclear fuel cycle. Moreover, uranium investment strategies must account for these broader supply chain constraints. Uranium conversion capacity has declined following facility closures in Canada and France, creating potential bottlenecks even if primary uranium supply increases. Enrichment capacity expansion faces technological barriers and significant capital requirements that limit new market entrants.
How Might Market Forces Resolve the Supply Gap Over Time?
Price Signal Transmission and Production Response Mechanisms
Uranium supply elasticity varies significantly across different price levels, with meaningful production response requiring sustained prices above $80-100 per pound for most undeveloped deposits. At $80 per pound, approximately 15-20 mothballed mines become economically viable for restart operations. At $100 per pound, an additional 25-30 development projects achieve positive economics, potentially adding 50-75 million pounds of annual production capacity over 5-7 year development timelines.
Restart economics for mothballed mines provide the most immediate supply response mechanism. These operations retain existing infrastructure, environmental permits, and local expertise that enable production resumption within 12-24 months of restart decisions. However, restart capacity is limited to approximately 30-40 million pounds annually across all currently mothballed facilities globally.
Supply Response Scenarios by Price Level
| Price Level | Restart Capacity | New Projects | Timeline | Annual Addition |
|---|---|---|---|---|
| $60-80/lb | 15 Mlbs | 5 projects | 2-3 years | 20 Mlbs |
| $80-100/lb | 35 Mlbs | 15 projects | 3-5 years | 60 Mlbs |
| $100-150/lb | 45 Mlbs | 35 projects | 5-8 years | 120 Mlbs |
Exploration budget allocation trends indicate renewed interest in uranium discovery programs following years of underinvestment. Global uranium exploration expenditure increased approximately 150% between 2020-2025, though absolute spending levels remain below historical peaks. Discovery success rates have declined as easily identified deposits were found during previous exploration cycles, requiring more sophisticated exploration techniques and higher capital investments.
Demand-Side Adjustments and Substitution Effects
Nuclear plant life extensions offer partial demand mitigation through improved fuel efficiency and load factor optimisation. Advanced reactor designs achieve uranium utilisation rates 30-40% higher than current generation reactors, reducing fuel requirements per unit of electricity generated. However, these efficiency gains occur gradually through fleet turnover processes spanning multiple decades.
Alternative energy source competition intensifies as uranium prices increase, particularly affecting nuclear power's economic competitiveness versus natural gas and renewable energy combined with storage. However, falling uranium spot prices can temporarily alleviate these competitive pressures. Levelised cost of electricity (LCOE) calculations suggest nuclear power maintains competitiveness at uranium prices below $200 per pound, above which alternative generation sources become increasingly attractive.
Grid stability value propositions provide nuclear power with premium pricing opportunities that partially offset higher fuel costs. Electricity markets increasingly recognise nuclear power's dispatchable baseload characteristics, with some jurisdictions implementing capacity payment mechanisms that reward nuclear plants for reliability services. These additional revenue streams improve nuclear economics even during periods of elevated uranium costs.
The next major ASX story will hit our subscribers first
What Are the Long-Term Structural Implications for Global Energy Markets?
Nuclear Power's Role in Decarbonisation Economics
Nuclear power represents approximately 10% of global electricity generation but provides nearly 20% of clean electricity production worldwide. According to the World Nuclear Association, International Energy Agency scenarios consistent with 1.5°C climate targets require nuclear capacity to double by 2050, implying uranium demand growth exceeding 100% over current consumption levels.
Levelised cost of electricity comparisons increasingly favour nuclear power as renewable energy storage costs remain elevated and grid integration challenges multiply. Nuclear plants provide dispatchable power that complements variable renewable generation without requiring backup fossil fuel capacity or extensive energy storage systems.
Nuclear vs. Alternative Energy Economics (2026 Analysis)
| Technology | LCOE ($/MWh) | Capacity Factor | Carbon Intensity | Grid Stability |
|---|---|---|---|---|
| Nuclear | $85-120 | 90%+ | Near Zero | Excellent |
| Wind + Storage | $95-140 | 35-45% | Near Zero | Variable |
| Solar + Storage | $85-130 | 25-30% | Near Zero | Variable |
| Natural Gas CCGT | $60-90 | Variable | High | Good |
Carbon pricing mechanisms enhance nuclear competitiveness through avoided emissions value. Carbon prices exceeding $50 per tonne CO2 equivalent provide nuclear power with economic advantages versus fossil fuel generation that improve as carbon pricing increases. Several jurisdictions have implemented or proposed carbon prices approaching $100 per tonne, significantly improving nuclear power economics.
Strategic Resource Security and National Energy Policy
Critical minerals classification increasingly includes uranium alongside lithium, rare earth elements, and other strategic materials essential for energy transition. Government policies emphasise domestic production capability and supply chain resilience to reduce dependence on imports from potentially unstable regions.
International cooperation frameworks for nuclear fuel assurance have expanded through institutions including the International Atomic Energy Agency (IAEA) Low Enriched Uranium (LEU) Bank and proposed commercial fuel banks. Furthermore, insights from Sprott's uranium market analysis highlight the importance of these mechanisms in providing fuel supply guarantees for countries developing nuclear power programs while maintaining non-proliferation objectives.
Emergency reserve policies vary significantly across major consuming nations. Some countries maintain strategic uranium stockpiles equivalent to 2-3 years of reactor requirements, while others rely on commercial utility inventories and market procurement. Supply disruption scenarios highlight the importance of emergency planning and coordination mechanisms among allied nations.
Market intervention mechanisms remain contentious but may become necessary if supply shortages threaten energy security. Potential interventions include export restrictions, strategic reserve releases, and emergency procurement programs. The effectiveness of such measures depends on international coordination and the magnitude of supply shortfalls.
Frequently Asked Questions About Uranium Supply Gap Economics
What exactly is the uranium supply gap?
The uranium supply gap represents the mathematical difference between projected nuclear reactor fuel requirements and confirmed uranium production capacity from existing mines and development projects. Industry analysis indicates this gap could reach 50-200 million pounds annually by 2030, equivalent to 25-100% of current global production levels.
How long does it take to bring new uranium production online?
New uranium mine development typically requires 7-15 years from initial discovery through commercial production. This timeline includes exploration drilling (2-4 years), environmental and regulatory approval (2-4 years), construction and commissioning (2-5 years), and production ramp-up (1-3 years). Restart of previously operating mines can occur within 12-24 months under favourable conditions.
Which countries are most vulnerable to uranium supply disruptions?
Nations with high nuclear electricity generation but limited domestic uranium production face the greatest supply vulnerability. This includes France (70% nuclear electricity, minimal domestic production), South Korea (30% nuclear electricity, no domestic production), Japan (6% nuclear electricity but growing, minimal domestic production), and the United States (20% nuclear electricity, less than 2% domestic production).
Can recycled uranium and weapons material fill the supply gap?
Secondary uranium sources currently provide approximately 25% of global reactor requirements but are declining steadily. Weapons material downblending programs are largely complete, while reprocessing capacity remains limited to specific countries including France, the United Kingdom, and Japan. These sources cannot sustainably bridge the growing gap between reactor requirements and primary mine production.
What uranium price levels would incentivise new mine development?
Economic analysis suggests sustained uranium prices above $70-80 per pound are necessary to justify most new uranium projects globally. Higher-cost deposits in Western jurisdictions typically require $100+ per pound for positive development economics. Price sustainability matters more than peak levels, as mining companies require long-term price confidence to commit development capital.
How does uranium grade affect production economics and investment returns?
Uranium grade directly impacts production costs per pound through mining volume requirements, processing throughput, and waste management obligations. High-grade deposits exceeding 10% uranium content can produce uranium at costs below $35 per pound, while low-grade deposits below 0.5% may require costs exceeding $75 per pound. This creates dramatic margin differences during periods of elevated uranium prices.
What role do geopolitical factors play in uranium supply constraints?
Geopolitical disruptions affect both uranium production and enrichment services. Russia historically provided 40% of global uranium enrichment capacity, while Kazakhstan produces approximately 40% of global primary uranium. Sanctions, export restrictions, and supply diversification efforts have reduced available capacity while increasing procurement costs for Western utilities.
How do electricity market changes affect long-term uranium demand?
Decarbonisation policies drive structural uranium demand growth as nuclear power provides dispatchable clean electricity that complements variable renewable generation. Grid stability requirements favour nuclear baseload capacity, while carbon pricing mechanisms improve nuclear competitiveness versus fossil fuel alternatives. These trends support sustained uranium demand growth regardless of short-term economic cycles.
Disclaimer: This analysis contains forward-looking statements and projections based on current industry data and expert assessments. Uranium markets involve significant volatility and geopolitical risks that may materially differ from projected scenarios. Readers should conduct independent research and consider professional investment advice before making uranium-related investment decisions.
Considering Investment Opportunities in Uranium Supply Constraints?
Discovery Alert's proprietary Discovery IQ model provides real-time alerts on significant ASX mineral discoveries, including uranium exploration breakthroughs that could capitalise on the growing supply gap. Subscribers gain immediate access to actionable insights when companies announce uranium discoveries or development milestones, positioning themselves ahead of market movements that often follow major resource announcements. Begin your 14-day free trial today to secure your advantage in identifying the next generation of uranium producers before supply constraints drive broader market recognition.